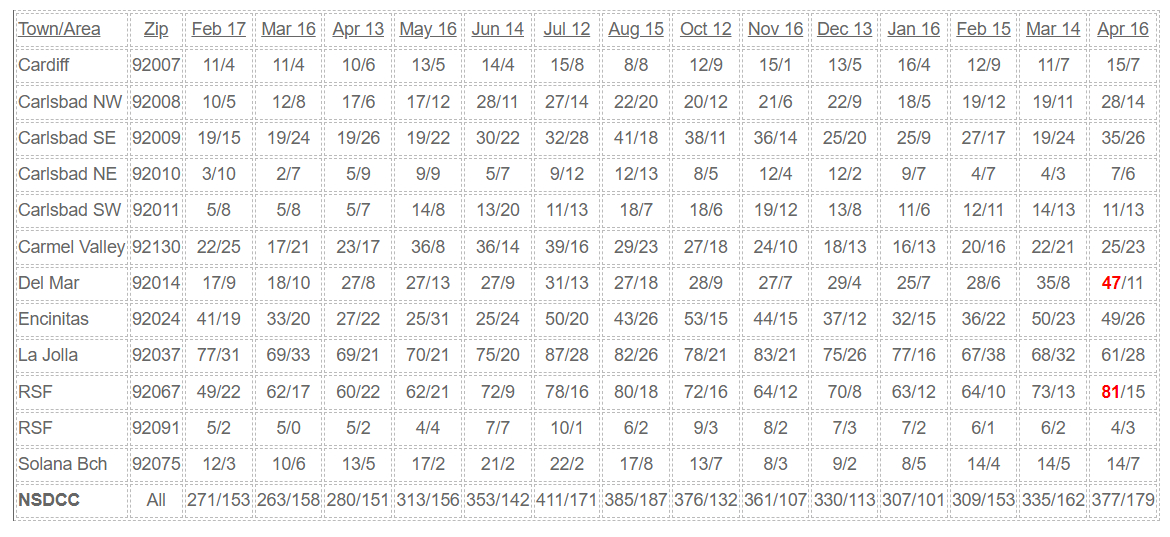
The unsold listings are stacking up earlier than normal in Del Mar (Median LP = $4,750,000) and in Rancho Santa Fe (Median LP = $7,895,000) but no one is going to feel sorry for them.
The other areas are hanging tough around the 2:1 ratio or better, which has been the healthy-market zone.
But look at SE Carlsbad for an example. It has the exact same number of pendings as there were at this time last April, but the number of actives are almost doubled, even with a reasonable median LP of $2,099,000.
This year, there will be more listings that price too high, don’t adjust, and get left behind.
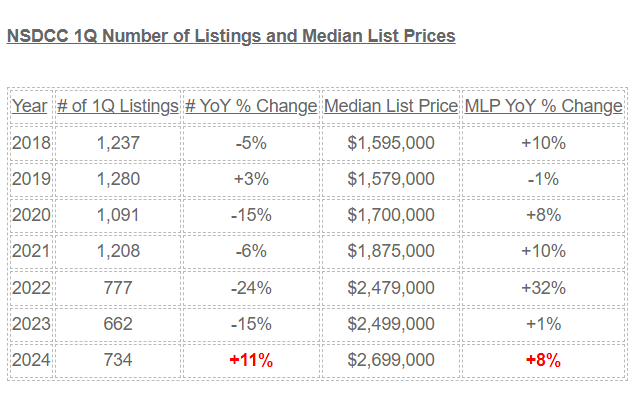
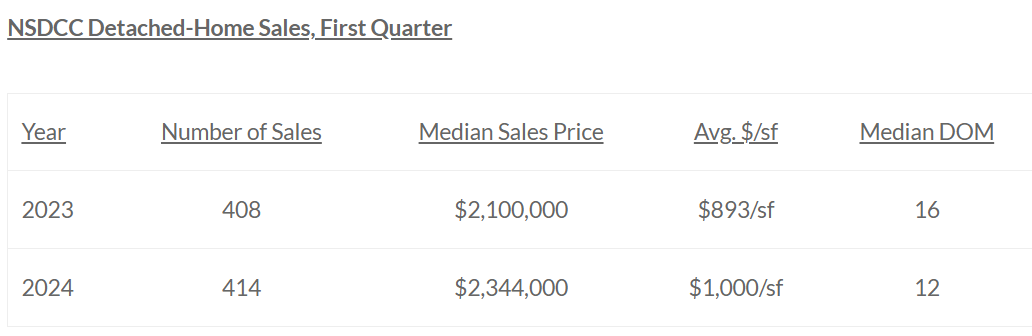
The first quarter of 2024 is the only 1Q in recent history to have increases in BOTH the number of listings AND the median list price. Previously, increases in pricing had a corresponding dip in the number of listings available for buyers to consider.
If you are like me, you’ve seen a noticeable surge in seller optimism in 2024. It’s not just the median list price that is up 8%, doesn’t it seem like everything is $200,000 higher than last year?
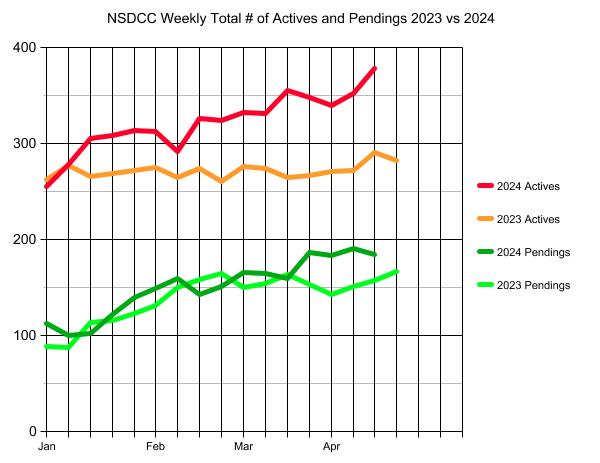
Because the inventory was so low last year, I thought the market could easily handle a 10% to 20% increase in active listings this year.
But now the number of actives is +30% YoY, and the pendings aren’t increasing in a similar fashion. If sales don’t pick up, it means a glut of unsold listings could be forming over the next 1-2 months.
Will buyers care?
Probably not, because they have shrugged off worse (higher prices and rates). But once a listing goes unsold for 2-3 weeks, it will take something drastic to get the buyers’ attention again.
Attorneys for the plaintiffs claim they spent 96,500 hours and $13 million of their own money to review over 5 million documents. They retained at least 20 experts and consultants, and performed approximately 180 depositions, and suffered through three unsuccessful attempts at mediation to achieve this result. The two lawsuits have over 1,800 docket entries. Under well-established precedent, they say they are entitled to an award of attorneys’ fees representing one-third of the $208,500,000 settlement fund ($68,805,000).
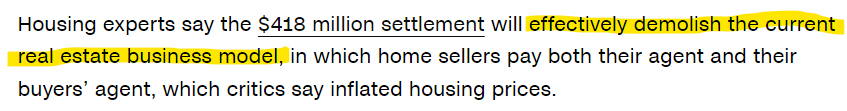
Americans can claim payments as part of a major settlement from the National Association of Realtors and other real estate groups. A variety of real estate companies were also involved in the suit, which is paying out up to $418 million.
RE/MAX, Anywhere and Keller Williams were all named in the suit, which alleged that groups forced home sellers to pay commissions through anti-competitive agreements.
Agreements between companies can result in non-competition across an industry, which inflates prices and corporate profits.
These practices, allegedly used by the named real estate companies, may violate antitrust laws, which aim to protect consumers by preventing monopolies.
Plaintiffs in the case claimed that home sellers paid inflated commissions to brokers and real estate agents as a result. There are few details yet available on how much those impacted will be paid, according to Top Class Actions.
The deadline to file a claim is May 9.
If you were impacted and do not wish to be included in the settlement, the deadline for exclusions and opt-outs is April 13.
None of the companies involved in the suit admitted any wrongdoing.
First, you must have sold a home on a multiple listing service, or MLS, in the time period covered by the suit. Date ranges vary greatly based on region and listing service. The oldest complaints that could get payments are from 2014, with the newest being from early 2024.
The exact dates for your location can be found on the settlement website:
You must also have paid a commission to a real estate brokerage in connection with that sale.
These brokerages are common across the industry, but many have speculated that could change soon as a result of years of legal trouble facing real estate companies.
If you’re unsure whether the suit applies to you, the settlement administrator can be reached at 888-995-0207.
If you do not opt out or file a claim, you may lose your right to be able to sue any of the companies implicated over this issue in the future.
The individual payouts are expected to be around $10-$13 per transaction. I’ll also include a pair of tickets to the Del Mar Turf Club for any of our clients!
Urban sprawl in west Phoenix is a tradition and it makes you think that eventually the desert will be paved all the way to California!
We have clients who have befriended Shawn and find her personable and a believer in real estate videos. Here’s her introduction the the best 55+ homes in the west valley:
For the newer readers, Donna and I have two daughters.
After Kayla graduated from the University of Oregon, she worked with us for five years and then moved to Manhattan where she’s been a realtor there for the last six years.
Natalie has always been a dancer, and she graduated from UCLA with a degree in dance. Since then, she has lived in Los Angeles doing smaller gigs in hopes they would lead to a full-blown concert tour with a major artist. She got her break last year, and has been on tour with Karol G. since August.
For those who aren’t familiar with Karol G., she has been called the latin Beyonce. The tour will conclude in Madrid, a city where she is bigger than Bruce Springsteen and Taylor Swift:
While it has been the dream tour of a lifetime for Natalie, it will come to an end in July (not June – the wiki clip above has the wrong month), after which she will continue to pursue her dance career. Stay tuned!
At the same time, she has also been our full-time marketing director. She authors our email newsletters and handles all of our social media accounts!
Because dance careers tend to be limited to younger people, we anticipate that Natalie will take over our business at some point. She handles Kayla’s marketing too, and if it all goes right, the future of the Klinge Realty Group will be bi-coastal and continue for decades!
Attention realtors who don’t have kids taking over their business. We can help you! When the times comes for you to exit the realtor business, we will buy your database, and take care of your people! Contact me when the time is right for you.
We are with daughter Natalie who is on tour with Karol G. on their Latin America leg with shows in Lima, Peru this weekend. We went to Machu Picchu yesterday:
While the media has been stirring up their hysteria over the commission decoupling…..this from CNN:
It’s the second part of the settlement that will likely frustrate buyers even further:
Let’s call it, The Return of the PEAD!
When Covid broke out, it was decided that the only way we could safely show homes again was if every buyer and agent submitted a form to the listing agent that declared they didn’t have Covid, and weren’t exposed to anyone who did. It was a joke of an exercise, but we had to do something.
Because this is a business where the competency of the listing agent is many times just measured by their ability to complete the forms, the gathering of the PEADs became almost militant in nature. Listing agents demanded that a buyer-agent MUST provide their PEADs before even thinking about scheduling an appointment to show the home!
Do you remember how in the minutes/hours it took to send the PEADs over to the listing agents, it caused just enough delay to allow shenanigans to take place behind the scenes? Listing agents would declare with glee, “Oh, you took too long to submit your PEADs and I already sold the house to someone else!”
The same thing will happen with the buyer-broker agreements. I’ve already had a Coldwell Banker agent tell me that if I was going to submit an offer on his listing, to make sure I include a copy of my buyer-broker agreement. It’s not required until July, but hey, it’s never too early to bust the chops of the buyer agents!
Secondly, think about the buyers who haven’t found a buyer-agent they liked yet, and just want to attend an open house that looked semi-interesting online.
The new rule says you can’t see the house without a buyer-broker agreement.
Open-house agents will be manning the front door with their “sign-in” sheets. But now those sheets will be committing the buyer to a buyer-agent commitment too. Will the agents mention that part? How many unwitting buyers will attend an open house in July and then find themselves in a 3-month or 6-month commitment with an agent they just met?
The legit agents will at least designate their agreement for this house only, where the buyers are committed to the agent if they buy the open house. But those buyers will be giving up their name, address, phone, and email so if you don’t buy this one, the agents keep contacting you until you buy or die.
Oh, you don’t like that program?
Chuck had the best reply so far, “Hey, it’s the DOJ”.
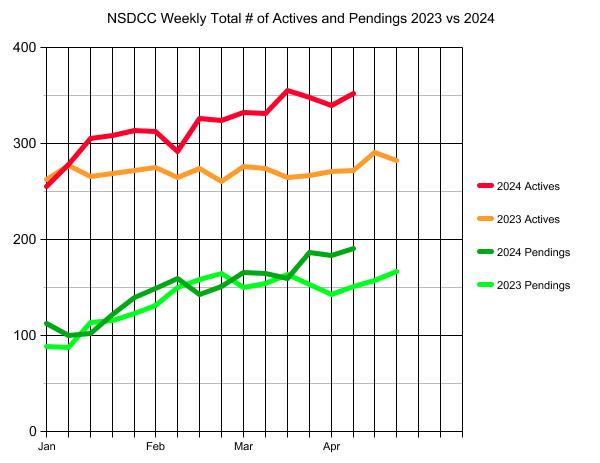
The number of active listings is a reflection of how many new listings are coming on the market vs. how many are going off the market at the same time.
While today’s number of actives is 29% higher than it was last year at this time, let’s note that the 2023 inventory was a virtual flat line where they were selling as fast as they were coming on the market.
Any reason for alarm today?
Not really – more actives means there are more homes to choose from, which should mean more sales as long as the number of unsold listings doesn’t start looking like a glut and spook the buyer pool (apparently, the +29% is acceptable). So far, so good in 2024.
This year looks pretty strong! If you house isn’t selling, it ain’t the market’s fault.
Trustindex verifies that the original source of the review is Google.
Jim & Donna Klinge helped us sell our home of 30 years in Ocean Hills. We were very happy with their service and would HIGHLY recommend them to anyone looking for an Honest, Knowledgeable, Skilled, Informed Efficient realty team. Both Jim & Donna were so helpful in different ways and complemented each others skills. Please refer to a more detailed review that we wrote on YELP. Thank You Both for all your help!!!
Jesse O'Hara
June 12, 2025
Trustindex verifies that the original source of the review is Google.
A+ thank you
Lisa Tuomi
June 11, 2025
Trustindex verifies that the original source of the review is Google.
Many years ago, we purchased a home in Carlsbad, using a realtor that was recommended to us - Jim Klinge. Fast forward to 2025, we recently had the privilege of selling 2 homes in Carlsbad, CA and didn't hesitate to reach out to Jim and Donna Klinge of Klinge Realty Group to guide us through the sales. The transactions were very different, each with its own unique situation, opportunities and challenges. From start to finish, Donna and Jim helped navigate the pre-sale preparation, the listing, showing of the house, buyer negotiations, the final close and all of the paperwork and decisions in between. What stands out with both transactions is the professionalism of Jim and Donna (and their team), wonderful communication (timely, relevant, concise), their deep understanding of market dynamics (setting realistic expectations), their access to top-notch contractors, and last, their ability to guide us across the finish line successfully. We wouldn't hesitate to use Jim and Donna in the future and highly recommend them for anyone looking to buy or sell a property in North San Diego County.
Jerry Meyer
March 28, 2025
Trustindex verifies that the original source of the review is Google.
We sold a home with Jim and Donna and from beginning to end they were consummate professionals. Their initial walk through the property resulted in a list of items to be repaired or updated. They supplied a list of vendors and job quotes to do the repairs and updates. We originally wanted to sell ‘as is’ and just get it over with. They gave us a selling price for ‘as is’ and options for doing a few updates/repairs to doing it all with the selling price for each option. We agreed to do all they suggested and we sold for the exact price they predicted. For every dollar spent we got back more than $2 back in the selling price. And they got that price in a rising interest rate environment! Donna and Jim are extremely detailed and guide you through ever aspect of the sale. There were no surprises thanks to their guidance. We couldn’t be more pleased with their representation.
Thank you Donna and Jim,
Jerry and Mary
Heather Quejada
March 27, 2025
Trustindex verifies that the original source of the review is Google.
We have known Jim & Donna Klinge for over a dozen years, having met them in Carlsbad where our children went to the same school. As long time North County residents, it was a no- brainer for us to have the Klinges be our eyes and ears for San Diego real estate in general and North County in particular. As my military career caused our family to move all over the country and overseas to Asia, Europe and the Pacific, we trusted Jim and Donna to help keep our house in Carlsbad rented with reliable and respectful tenants for over 10 years.
Naturally, when the time came to sell our beloved Carlsbad home to pursue a rural lifestyle in retirement out of California, we could think of no better team to represent us than Jim and Donna. They immediately went to work to update our house built in 2004 to current-day standards and trends — in 2 short months they transformed it into a literal modern-day masterpiece. We trusted their judgement implicitly and followed 100% of their recommended changes. When our house finally came on the market, there was a blizzard of serious interest, we had multiple offers by the third day and it sold in just 5 days after a frenzied bidding war for 20% above our asking price! The investment we made in upgrades recommended by Jim and Donna yielded a 4-fold return, in the process setting a new high water mark for a house sold in our community.
In our view, there are no better real estate professionals in all of San Diego than Jim and Donna Klinge. Buying or selling, you must run and beg Jim and Donna Klinge to represent you! Our family will never forget Jim, Donna, and their whole team at Compass — we are forever grateful to them.
Lou F
March 27, 2025
Trustindex verifies that the original source of the review is Google.
WeI had the pleasure of working with Klinge Realty Group to sell our home in Carmel Valley, and I cannot recommend them highly enough!
Jim and Donna demonstrated exceptional professionalism, offering expert guidance on market conditions and pricing strategy, which resulted in a quick and successful sale.
Communication was prompt and we were well-informed throughout the entire process.
For anyone looking for a dedicated and knowledgeable real estate team, look no further!
---
William Sams
March 25, 2025
Trustindex verifies that the original source of the review is Google.
Donna and Jim Klinge of Klinge Realty Group have our highest possible recommendation. From Donna and Jim’s first visit to our house through closing their advice and counsel was candid and honest in all dealings. They kept us fully informed throughout the process. The house sold less than three days after listing with a two-week closing. My wife and I have sold several houses during our lives. This was by far the best experience. Klinge Reality is a premium service realtor. You can’t make a better choice for someone to sell your home fast and for top dollar.
Emily Hernandez
December 29, 2024
Trustindex verifies that the original source of the review is Google.
Donna and Jim provided exceptional support and professionalism throughout the entire process. We couldn't have been happier with their efforts. They made our house shine, and thanks to their expertise, it sold above the listing price in the very first weekend! Truly a fantastic experience from start to finish.
Jesus Adrian Sahagun
November 11, 2024
Trustindex verifies that the original source of the review is Google.
This year has been difficult on our family, mainly due to having to sell our home. Thankfully we knew God had a plan for us and working with the Klinge team was a key part of it. It was an obvious decision to work with them again after such an amazing experience when purchasing the same home we needed to sell. The challenge was, how will we do this in so little time with so much going on? Jim and Donna held our hand every step of the way. Whenever an unexpected issue arose they found and provided a solution. Never once did we feel pressured to make a decision and the Klinges were always reassuring after providing the information that the decision was ours to make. Despite the curve balls, they never panicked and exemplified the “can do” attitude, making us feel optimistic and taken care of. Their expertise and professionalism was superb. But of all the reasons to work with the Klinges, the most impactful and valuable is their compassion and genuine care for their clients. We pray that we can one day purchase our forever home and you better believe that Jim and Donna will be representing us - as long as they will have us of course. Thank you again Klinge team! Your execution, experience, and care are unmatched.
SABIHA PASHA
July 23, 2024
Trustindex verifies that the original source of the review is Google.
Jim and Donna were fantastic! Jim understanding my needs, recommending potential places, pointing out the pros and cons of each property was invaluable. Then when the offer was accepted Donna’s organized guidance through the inspections, paperwork etc made the whole process seem effortless.
So grateful that I had them on my side!