Sure, when they are higher-end luxury estates in Rancho Santa Fe owned by blog readers!
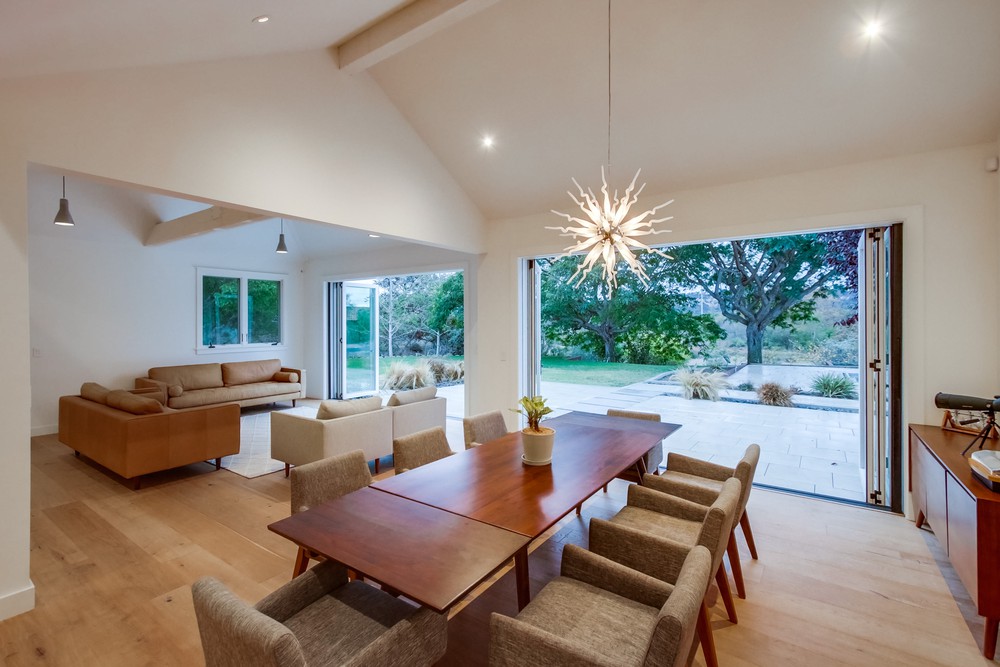
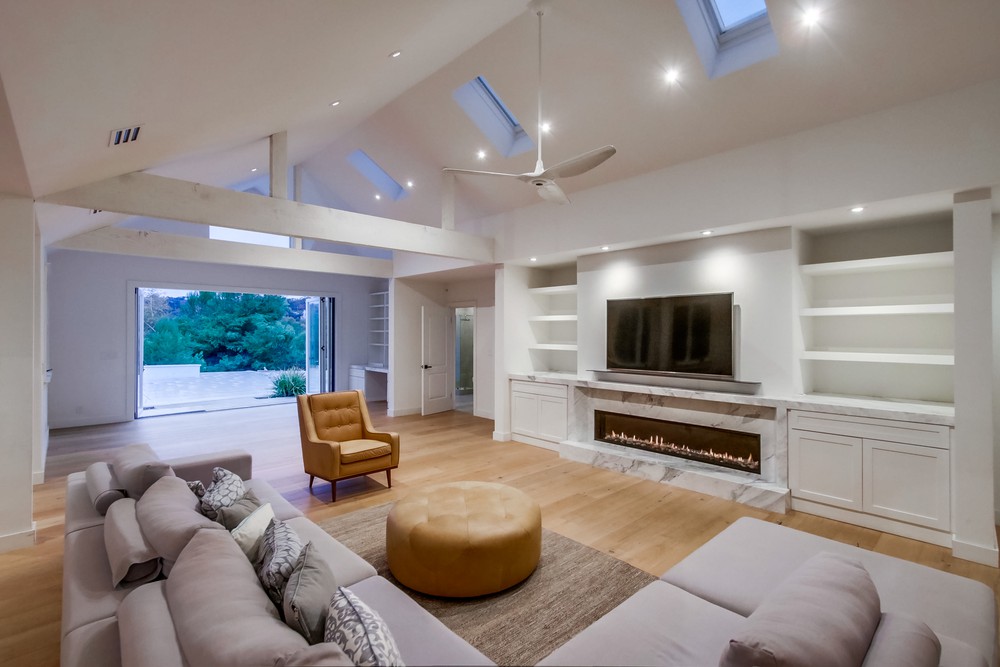
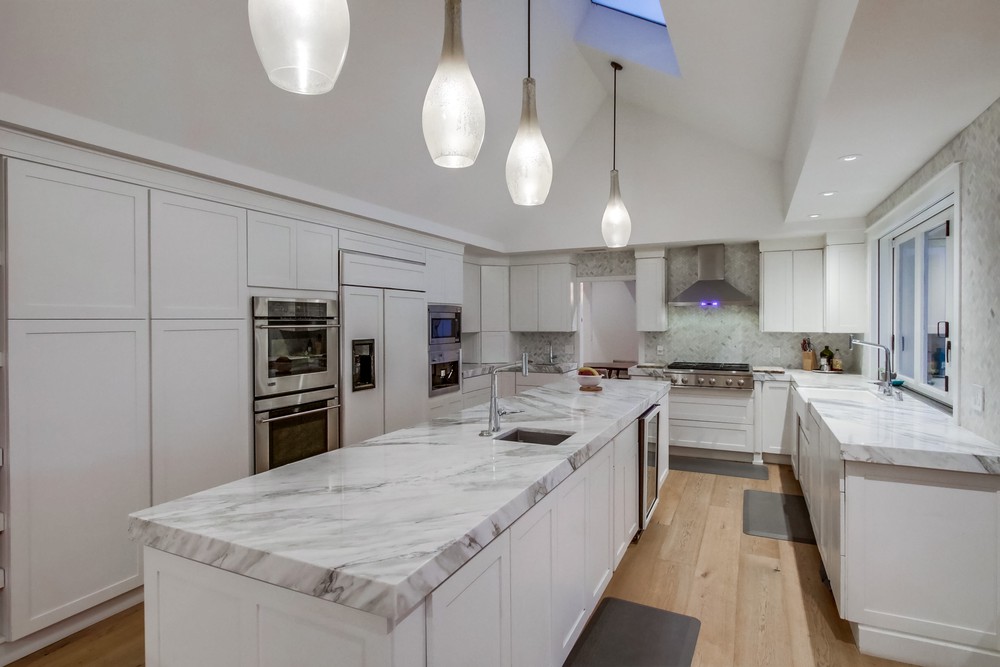
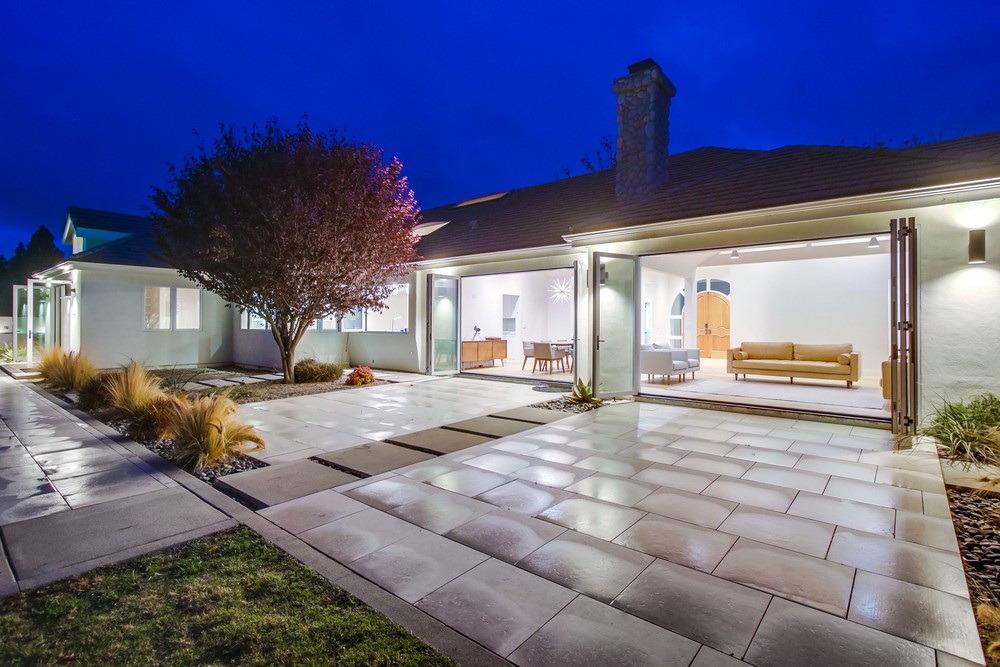
4124 Stonebridge Lane, Rancho Santa Fe
5 br/6.5 ba, 3,734sf
LP = $15,000 per month.
Stylish one-story contemporary home on 2.87 acres in gated Stonebridge that has recently-updated kitchen and baths, cantina doors, and hardwoods throughout! Pool/spa, solar, tankless water heater, large flat private backyard, and RV parking on site. The 4-car garage was converted to a br/office with full bath and are counted as the 5th bedroom and 6th full bathroom. Partially furnished – what you see in the photos is included. Water, pool maintenance and gardener provided by landlord.
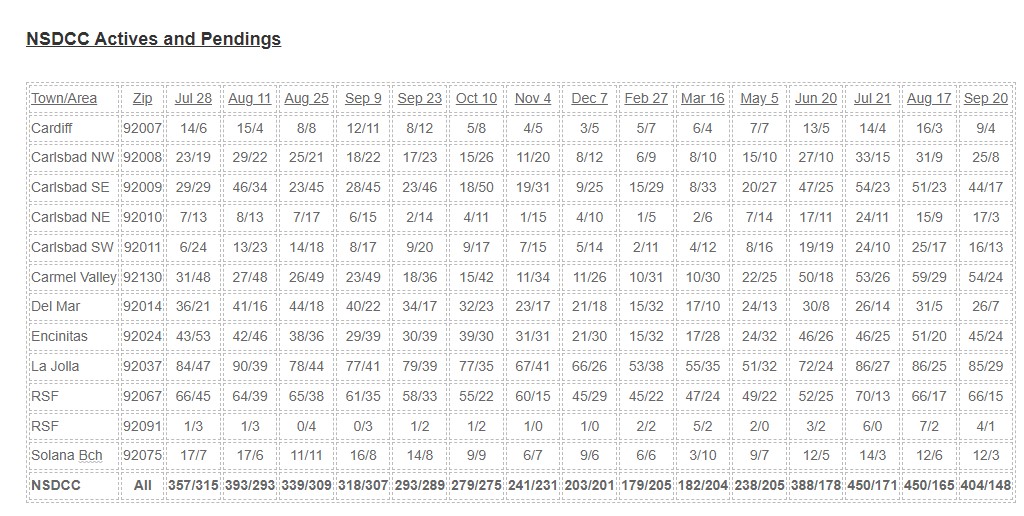
For those who are willing to investigate the sales data in our local areas, here are the detached-home sales from the last 90 days. Poke around a little, and I doubt you’ll believe that we’re getting ‘creamed’.
The highlights: three RSF sales over $10 million in the last 90 days; nine sales above $5,000,000 in La Jolla (and 60 sales overall!), 81 sales in Encinitas – more than one every business day; and of the 182 sales in Carlsbad, 46 of them were $2,000,000 and higher.
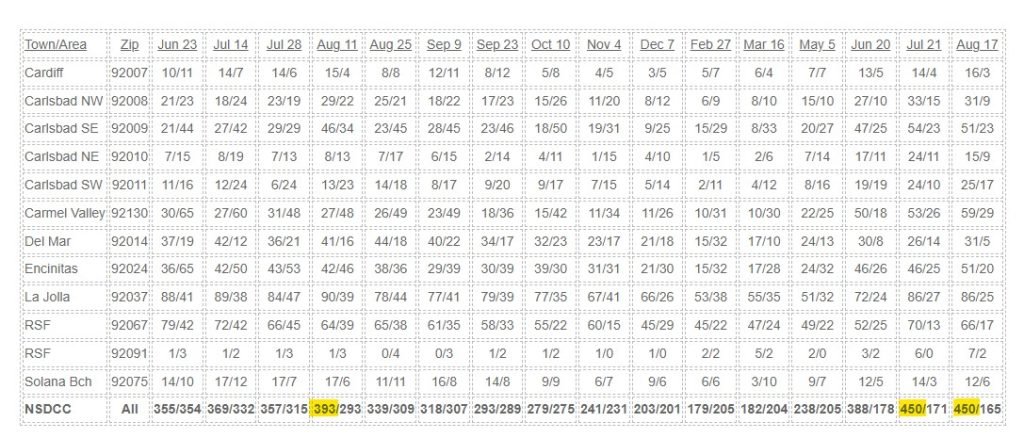
The reason for breaking down the active and pending listings by zip code is to give the readers a closer look at their neighborhood stats. We’ve considered a 2:1 ratio of actives-to-pendings to be a healthy market.
While other areas in America are reporting a surge of inventory, it’s not happening here, at least not yet. Comparing the current stats to the last few months, there really isn’t any reason to be overly concerned:
Taking out La Jolla and Rancho Santa Fe, the actives-to-pendings is 2.4-to-1 (249:103), which isn’t bad, all considered, and it’s the same ratio as it was last month.
The holiday season is less than a month away…..and the NFL season is already two weeks old. The Super Bowl is right around the corner, and so is the 2023 Selling Season!
One of my favorite Compass agents went all out today to promote her new $15,000,000 listing – the MLS remarks:
If these walls could talk, they would speak of the fact that this estate was built by a US ambassador to Italy as a summer home for he and his family with many materials imported from Italy. They’d mention the famous houseguests, upscale fundraisers and political gatherings that have taken place here. Upon driving down the private road to the estate’s gate, you’ll be transported to Tuscany from the moment you pull in. Unlike anything else in the upscale town of Rancho Santa Fe, this home’s historic architecture is met with modern features from a head-to-toe renovation over the last two years.
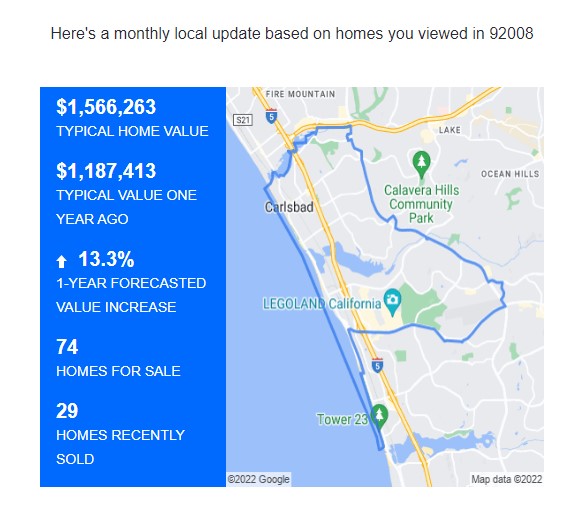
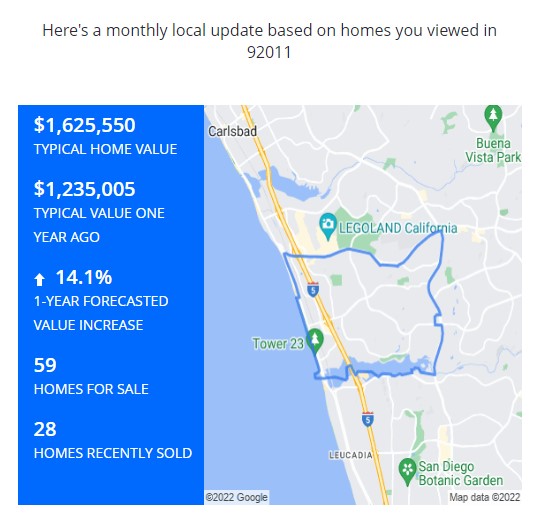
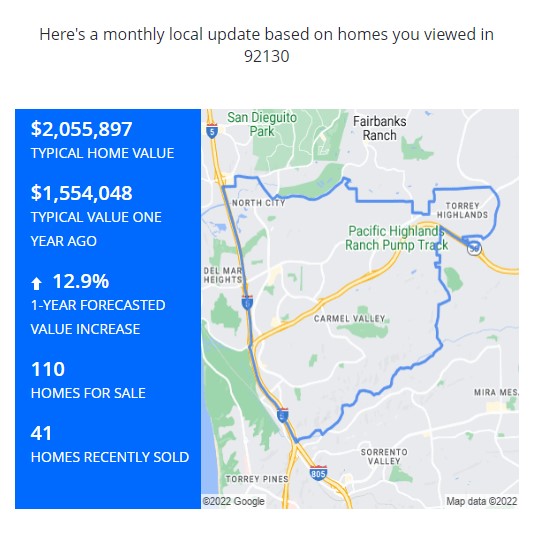
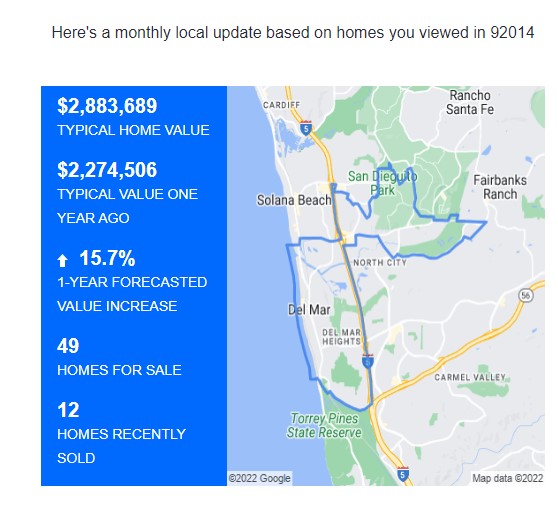
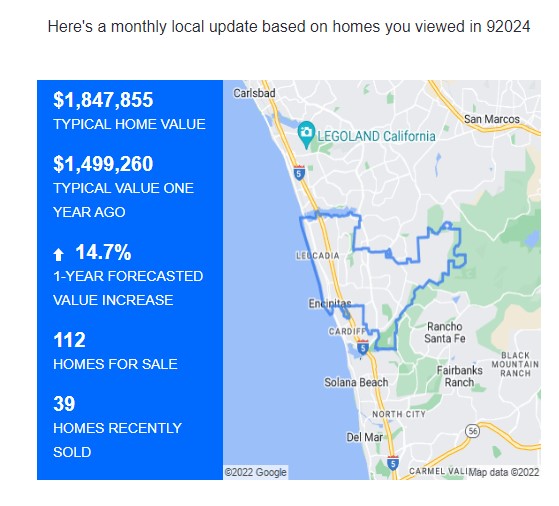
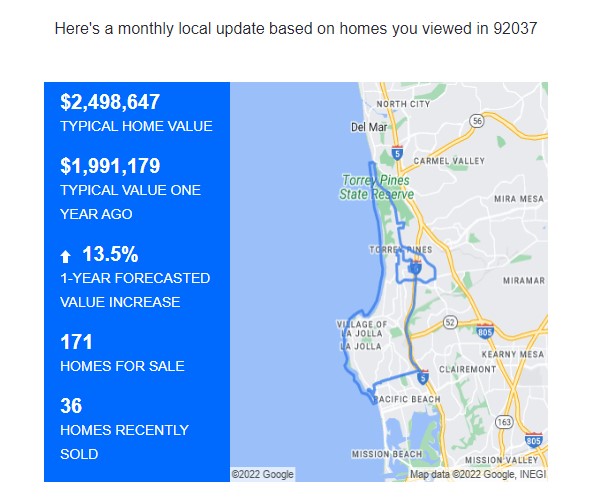
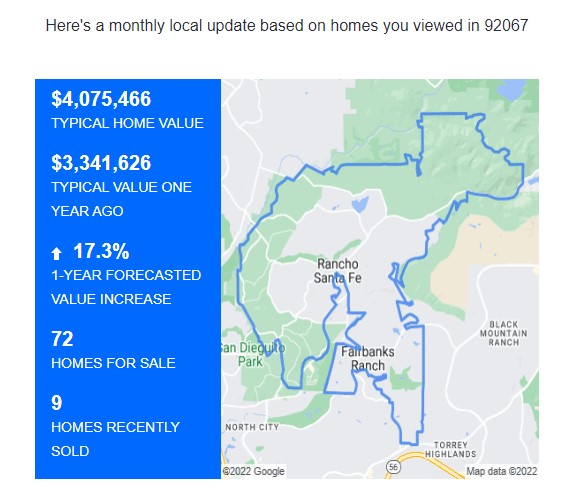
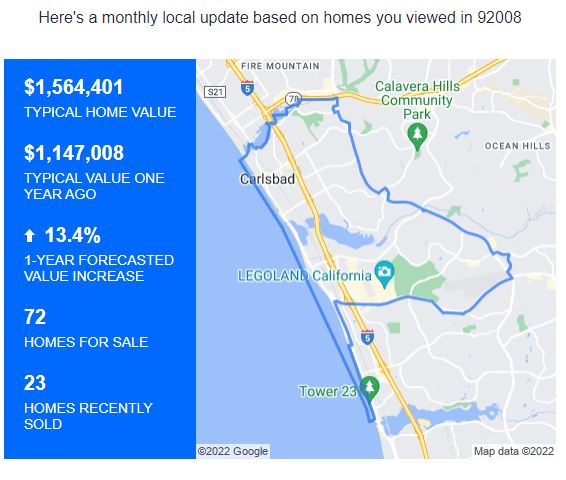
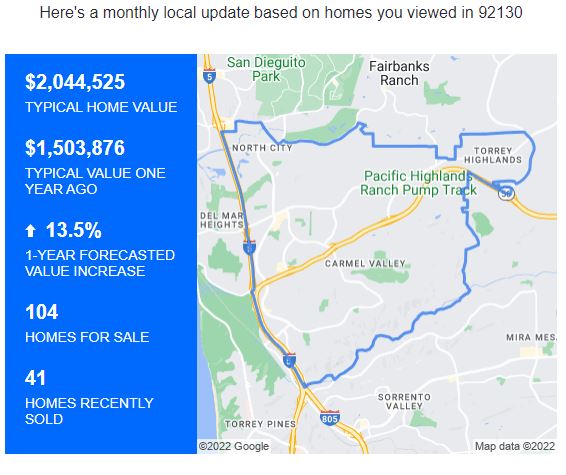
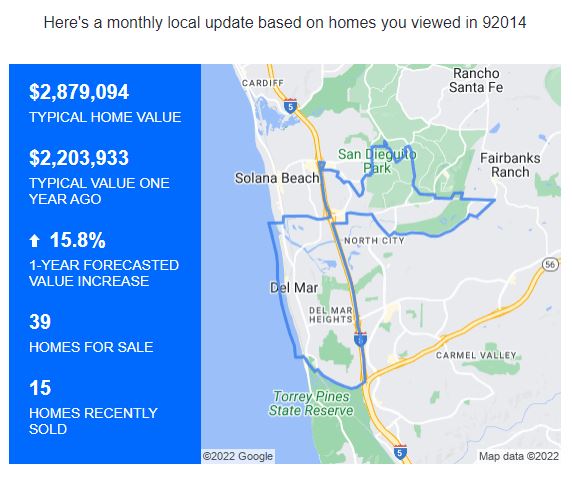
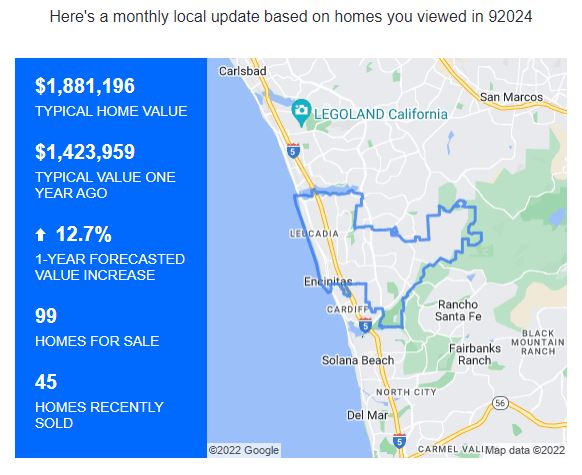
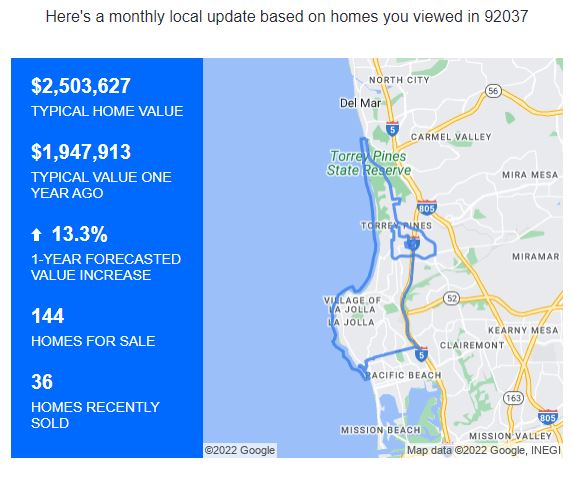
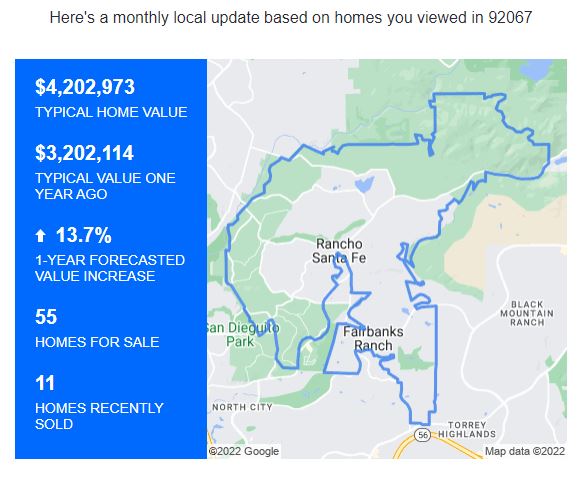
The latest Zillow 1-Year Forecasted Values are still expecting a fairly strong appreciation rate over the next year – these estimates are the same or higher than last month! I can see a path to how this could happen.
The Spring Selling Season gets frenzied up for 3-4 months where buyers and sellers all jump in at the same time, and then the market goes flat for the rest of the year…..kinda like this year!
NW Carlsbad, 92008:
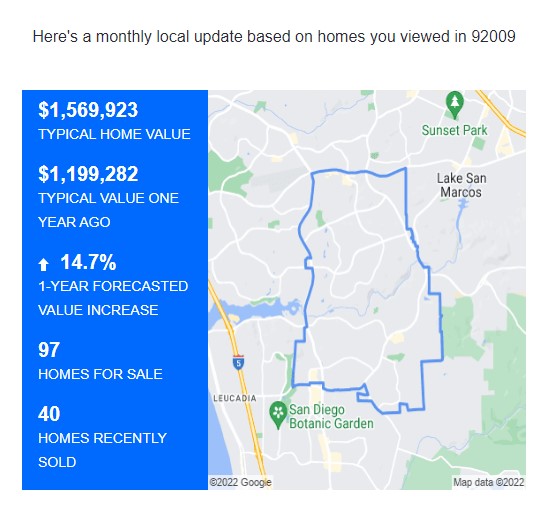
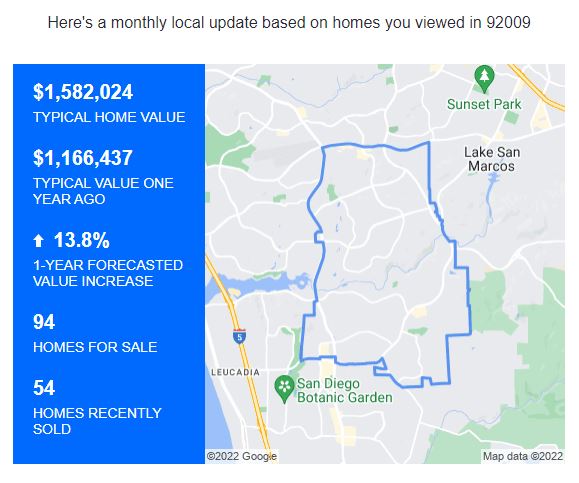
SE Carlsbad, 92009:
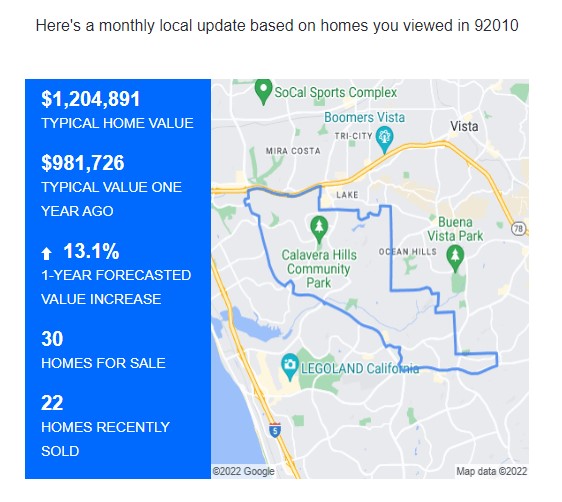
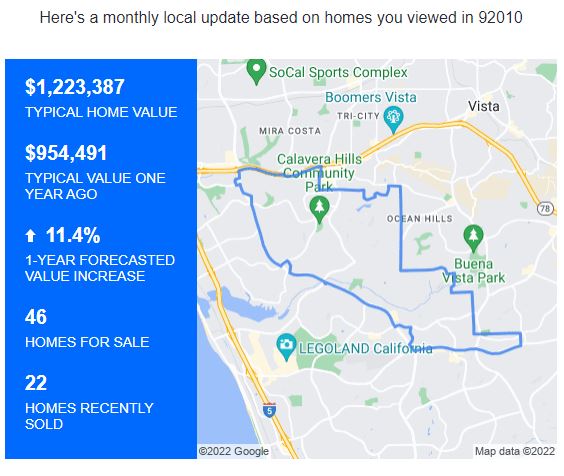
NE Carlsbad, 92010:
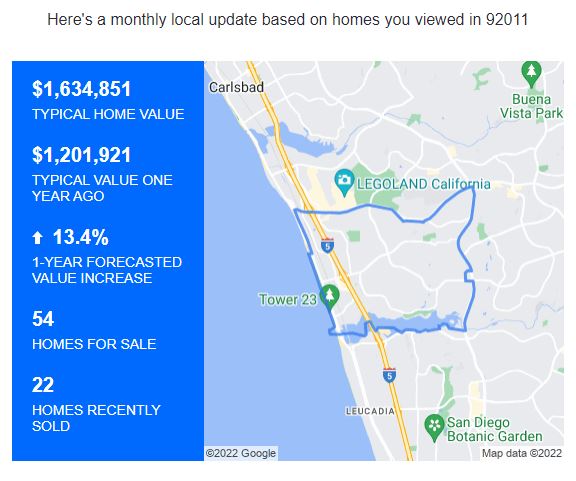
SW Carlsbad, 92011:
Carmel Valley, 92130:
Del Mar, 92014:
Encinitas, 92024:
La Jolla:
Rancho Santa Fe, 92067:
They do have website-viewer data that nobody else has, and hopefully they are using it to track the activity and make predictions.
The reason for breaking down the active and pending listings by zip code is to give the readers a closer look at their neighborhood stats. We’ve considered a 2:1 ratio of actives-to-pendings to be a healthy market.
Most areas today have the same or better stats as they did last month. The number of active listings hit their peak in August last year, as usual, and it’s likely that the count of unsold listings will drop slowly over the rest of 2022 (and the pendings follow). Prepare for 2-3 months of NSDCC sales being under 100!
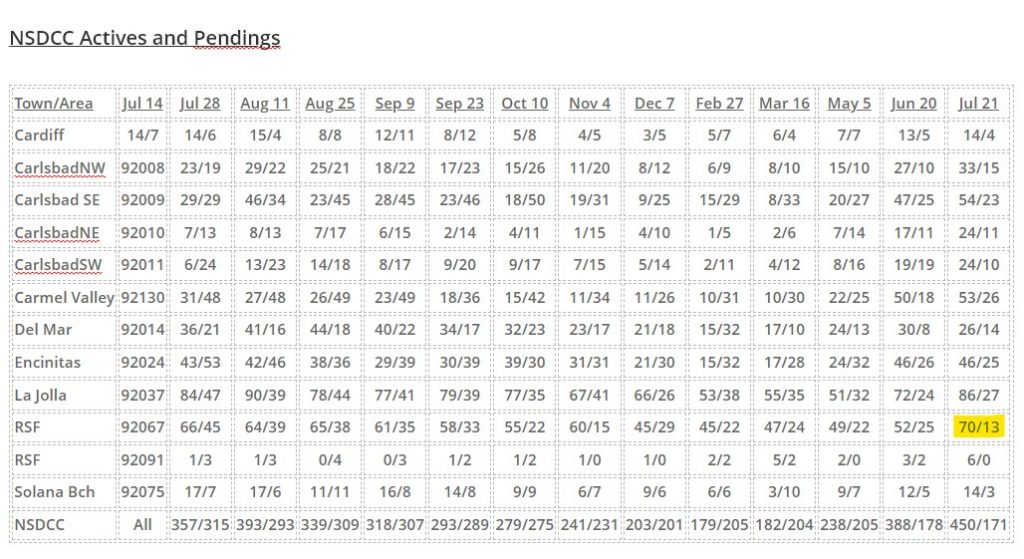
NSDCC Actives and Pendings
Taking out the high-enders La Jolla and Rancho Santa Fe, the actives-to-pendings is 2.4-to-1 (291:121), which isn’t bad, all considered.
Mid-February, and the 2023 Selling Season, is only six months away!
The reason for breaking down the active and pending listings by zip code is to give the readers a closer look at their neighborhood stats.
In the recent years prior to the pandemic, the actives/pendings in Rancho Santa Fe ran at a 10:1 pace. Nobody is in a hurry there, they don’t have to sell, and they’re not going to give it away. Those days appear to be coming back.
The median list price of those RSF actives is $5,995,000 – is anyone going to feel sorry for them? Probably not. Does it reflect what is going on in the rest of the area? Not really – the other areas are mostly around a 2:1 ratio (except La Jolla) which has been our standard for a healthy market and pretty good, all considered.
In 2020, we had 400+ pendings from June 22nd to November 30th – with a peak of 491 pendings on September 7, 2020.
The latest Zillow 1-Year Forecasted Values are still expecting a fairly strong appreciation rate over the next year. In May, they were guessing +19% or more in all areas, so this looks like a soft landing:
NW Carlsbad, 92008:
SE Carlsbad, 92009:
NE Carlsbad, 92010:
SW Carlsbad, 92011:
Carmel Valley, 92130:
Del Mar, 92014:
Encinitas, 92024:
La Jolla:
Rancho Santa Fe, 92067:
They do have website-viewer data that nobody else has, and hopefully they are using it to track the activity and make predictions.
Hat tip to long-time reader Todd who we saw at the game last night – we did bug out early, but it was only to pick up Kayla at the airport. The Padres walked it off in the 11th inning!
Meanwhile, people are wondering where the local real estate market is going to end up.
For conditions to change much, sellers would have to panic, and dump on price. Otherwise, we will just be taking a leisurely stroll through Plateau City, admiring all the homes that aren’t selling.
Here are the favorite zip codes around North County – SE Carlsbad (92009), Encinitas (92024), Carmel Valley (92130), and Rancho Santa Fe (92067).
A few months ago, we had the lowest number of active listings of all-time:
While lately the number of the active listings have been growing steadily, they would have to double from this point before getting into the danger zone – but we’re going to run out of time before that happens.
Now that doom is being broadcast everywhere, sellers will decide that ‘now isn’t a good time to sell’, and by August they will quit listing their homes for sale.
There are 396 NSDCC active listings today (and 180 pendings), and we might hit 500 before August, but that will be the peak for 2022.
The market won’t keep getting worse – it will just taper off for rest of the year as buyers AND sellers lose interest. Instead, we’ll be talking about the playoffs and our first-place Padres going to the World Series!
Let’s break down the active and pending listings by zip code is to give you a closer look at the neighborhood stats. We’re going to have more active listings simply because the the list prices were all based on red-hot frenzy conditions (comps + 5% or more), and we’re past the red-hot days.
NSDCC Actives and Pendings
Town/Area
Zip Code
Feb 27
Mar 16
May 5
Jun 20
Cardiff
92007
5/7
6/4
7/7
13/5
Carlsbad NW
92008
6/9
8/10
15/10
27/10
Carlsbad SE
92009
15/29
8/33
20/27
47/25
Carlsbad NE
92010
1/5
2/6
7/14
17/11
Carlsbad SW
92011
2/11
4/12
8/16
19/19
Carmel Valley
92130
10/31
10/30
22/25
50/18
Del Mar
92014
15/32
17/10
24/13
30/8
Encinitas
92024
15/32
17/28
24/32
46/26
La Jolla
92037
53/38
55/35
51/32
72/24
Rancho Santa Fe
92067
45/22
47/24
49/22
52/25
Rancho Santa Fe
92091
2/2
5/2
2/0
3/2
Solana Bch
92075
6/6
3/10
9/7
12/5
NSDCC
All Above
179/205
182/204
238/205
388/178
The selling season started early in 2022, and was cooking by the end of February. Let’s group the different areas based on how their pendings are holding up.
Frenzy-ish:
Carlsbad SW – A few houses finally went up for sale, and buyers responded.
Rancho Santa Fe – The active listings aren’t growing like in the other high-end areas of Del Mar and La Jolla, and the number of pendings are very impressive. It was once normal when the Ranch had a 10:1 ratio between actives and pendings!
Normal-ish:
Everyone else, except……
Crash Zone
Carmel Valley – which has always had more pendings than actives over the last two years – and sometimes twice as many pendings! While having 50 actives and 18 pendings anywhere else would be a win, in the CV it feels like a meltdown.
Here they are:
(I tried to sort those by price order, but all they have is sort by date added)
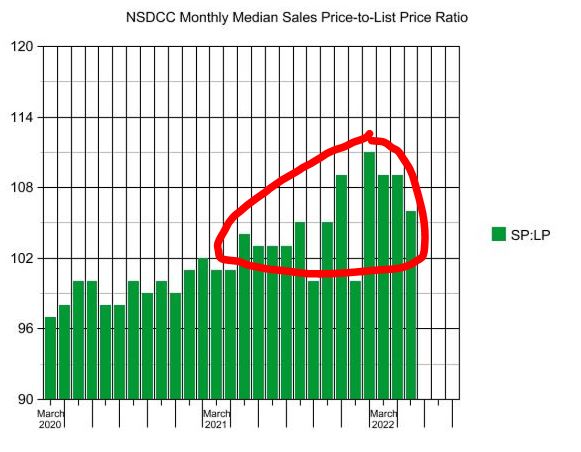
This nonsense about every buyer paying way over list price has to stop. If the SP:LP was around 100% we’d be elated, yet it was 111%, 109%, and 109% in the February-April stretch.
So far in June, the SP:LP is 107% for the 104 detached-home sales between Carlsbad and La Jolla!
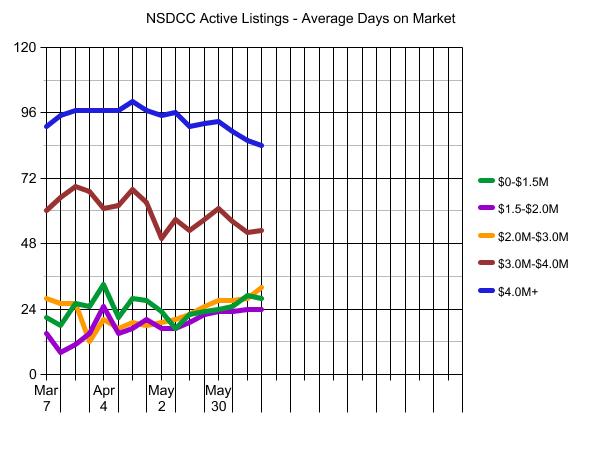
We can also track the average market times too. Any upward trends here would indicate market slowing – it’s early so nothing too startling yet:
The hottest of the red-hot was in 2020, when we had 400+ pendings from June 22nd to November 30th – with a peak of 491 pendings on 9/7/2020. Today we have 178 pendings.