This is the other article that several people sent in – thank you!
Rob Dawg wondered if these cases of dozens of offers could be tempered by putting the right price on these from the beginning. The agent’s Zillow profile shows 30 sales in the last year – and 26 of those were seller sides which is great and it means she knows something about pricing. But I think when you are pricing a home on the lower-end of the market these days, you can add easily 10% on top of the comps and buyers won’t notice – because other sellers are already doing it too. Note: the agent didn’t take the highest offer here either.
Ellen Coleman had never received so many offers on a house in her 15 years of selling real estate.
She listed a fixer-upper in suburban Washington, DC for $275,000 on a Thursday. By Sunday evening, she had 88 offers. “The offers just kept coming,” she said. “I felt like Lucy with the chocolates. I’m thinking, ‘This is just out of control.'”
Of those 88 offers, 76 were all-cash, said Coleman, who works for RE/MAX Realty Centre. There wasn’t even enough time for all of the bidders to visit the property. She said 15 offers were sight unseen.
The four-bedroom, 1,800 square-foot home sold for $460,000, nearly a 70% increase from the asking price. She said the winning bid was not the highest offer, but it was all-cash with no contingencies and it had paperwork in place.
The buyer, she said, is an investor who is likely to renovate and resell at an even higher price.
“It was a lower priced property for the area and may have been an outlier,” she said. But even her other listings have typically been getting closer to 15 offers. “Several people came in wanting to be homeowners and do the repairs themselves. There is such low inventory out there and people feel like that is a way they can get into a home.”
Pending home sales, a measure of signed contracts on existing homes, fell a wider-than-expected 10.6% in February compared with January, according to the NAR. Sales were 0.5% lower year over year. There were just 1.03 million homes for sale at the end of February, a 29.5% drop compared with February 2020. That is the largest annual decline ever and the lowest supply on record.
Yesterday’s real estate news was filled with drops and declines, but around here we’re doing fine:
All that matters is whether the bubble going to burst.
Four reasons why it won’t:
No easy money – buyers have to be solid qualifiers.
Foreclosures are extinct.
Everyone has loads of equity (except 2021 buyers).
No easy place to move to.
For the bubble to burst, we would need an event to drive down prices. Sellers would have to panic and cheap-sell for less to start a downward cycle. Even an earthquake probably wouldn’t be enough.
Thanks to the readers who sent in this article – and it makes you wonder how many offers any house for sale would get if listing agents didn’t shut down the showings so quickly:
CITRUS HEIGHTS, Calif. (KTXL) — A Citrus Heights home in a quiet cul-de-sac received 122 offers in one weekend on the market.
The 1,400 square feet home has three bedrooms, two baths and a spacious backyard with a swimming pool and an asking price of $399,900.00.
“People would think that it was underpriced. It was not underpriced. It was straight on with the comps,” said Deb Brittan, the listing agent for the property. “I had hoped, I thought, maybe if we get 20 offers that would be amazing.”
Barry and Anita Jackier are the sellers of the Citrus Heights home.
“We had this little friendly wager going. I’m like, ‘I think we’re going to get eight offers,” Anita Jackier said.
“I said 10,” Barry Jackier said.
They all underestimated the number of offers, by a lot.
They received 122 offers in one weekend.
“That’s 121 people who didn’t get a house. And that’s kind of heartbreaking in this market to think that there are so many buyers out there. And if you don’t have an agent that understands how to put a strategic offer in on a house and get it accepted, you’re just out burning your gas and a lot of emotional turmoil because of the nature of our market currently,” Brittan said.
Brittan says the highest offer was above $500,000, but that was not the winning offer. There were other factors to consider.
The couple is buying a home in Idaho.
They need time for the escrow to close on that home, so one big factor was they needed a buyer to wait until that happens before moving in.
“I’d like to think that the buyer that was supposed to have gotten the house, has gotten the house,” Brittan said.
The selling price of the home was in the mid-$400,000 range.
“We have so many great memories. And that’s going to be hard to let go of,” Barry Jackier said.
“But you know what I’m excited about is now another family gets to have a blank palate to make all those memories on. We are keeping those memories and they have an opportunity to start their own,” Anita Jackier said.
The couple said they felt called by God to move to Idaho and from that perspective, it’s a miracle they were able to find a home there.
“That house was on the market for three hours,” Anita Jackier told FOX40.
“So I don’t know that it’s going to slow down any time soon. And I don’t know what it’s going to take to slow it down,” Brittan said.
Yesterday’s Case-Shiller Index was a reflection of November, December, and January market data. Here’s a local supplement to help map out what’s coming – and this is only through February:
This was in a fairly tight range of $400/sf to $450/sf for a couple of years. But six months ago, this metric went ballistic, and in that short of time it’s catapulted well into the $500s!
The intertubes go crazy about what a racist Eric Clapton was, but let’s consider the full spectrum.
He was such a heroin addict that he didn’t leave his house for three years.
He was so madly in love with Pattie Boyd that she finally divorced his best friend George Harrison and married him. They divorced ten years later.
Coming off the heroin trip, be became so addicted to alcohol that he couldn’t finish a concert.
He was so drunk at one show that he went off on a racist bender. I don’t forgive him for that, but let’s don’t trash the rest of his 50 years of contribution just because of one bad night. He has received 18 Grammys and is the only three-time inductee of the Rock and Roll Hall of Fame.
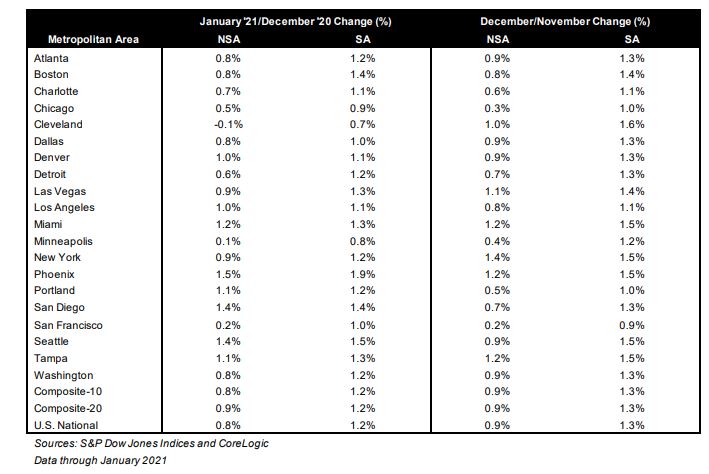
It’s more than just the trendy areas – it’s red-hot everywhere.
Every metro area on the list is having substantial gains in their index, which means there has been a psychological shift happening coast-to-coast on how human beings feel about their homes. With the real-estate-selling business being one of the last totally-free markets left, it’s going to run wild for a while.
The #1 market, Phoenix, hit +1.9% month-over-month, which is incredible for a January reading.
It should put them on track for a +20% to +25% annual gain in 2021, and we won’t be far behind.
I think we might catch them!
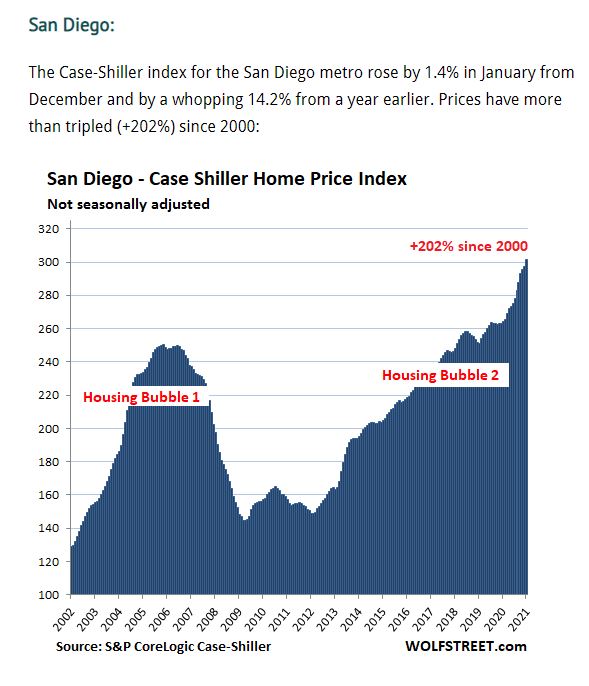
San Diego had positive gains straight through the Covid-19 era last year, and now we have 2% monthly gains in our sights for the next few months. Look how that compares to the 2019 readings:
“The strong price gains that we observed in the last half of 2020 continued into the f irst month of the new year. In January 2021, the National Composite Index rose by 11.2% compared to its year-ago levels,” says Craig J. Lazzara,Managing Director and Global Head of Index Investment Strategy at S&P DJI. “The trend of accelerating prices that began in June 2020 has now reached its eighth month and is also reflected in the 10- and 20-City Composites (up 10.9% and 11.1%, respectively). The market’s strength is broadly-based: all 20 cities rose, and all 20 cities gained more in the 12 months ended in January 2021 than they had gained in the 12 months ended in December 2020.
“January’s performance is particularly impressive in historical context. The National Composite’s 11.2% gain is the highest recorded since February 2006, just one month shy of 15 years ago. In more than 30 years of S&P CoreLogic Case-Shiller data, January’s year-over-year change is comfortably in the top decile. That strength is reflected across all 20 cities. January’s price gains in every city are above that city’s median level, and rank in the top quartile of all reports in 18 cities.
“January’s data remain consistent with the view that COVID has encouraged potential buyers to move from urban apartments to suburban homes. This demand may represent buyers who accelerated purchases that would have happened anyway over the next several years. Alternatively, there may have been a secular change in preferences, leading to a shift in the demand curve for housing. Future data will be required to analyze this question
“Phoenix’s 15.8% increase led all cities for the 20th consecutive month, with Seattle (+14.3%) and San Diego (+14.2%) close behind. Although prices were strongest in the West (+11.7%), gains were impressive in every region.”
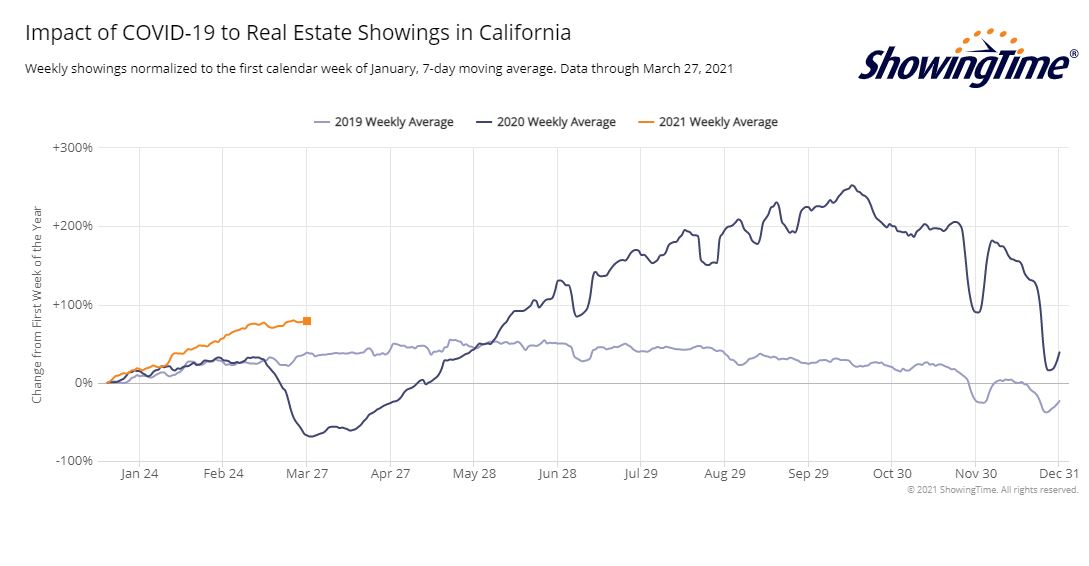
This year’s orange line has plateaued. It’s been in the 70% range all month, meaning there has been 70% more showings each week than there were during the first week of the year.
Even though it’s twice as much, it mirrors the 2019 trend that the spring selling season is underway, and I think we can assume that every buyer who is thinking about moving in 2021 is out looking at homes.
The buyer pool is full, and engaged. Sellers, no need to wait!
Trustindex verifies that the original source of the review is Google.
We sold a home with Jim and Donna and from beginning to end they were consummate professionals. Their initial walk through the property resulted in a list of items to be repaired or updated. They supplied a list of vendors and job quotes to do the repairs and updates. We originally wanted to sell ‘as is’ and just get it over with. They gave us a selling price for ‘as is’ and options for doing a few updates/repairs to doing it all with the selling price for each option. We agreed to do all they suggested and we sold for the exact price they predicted. For every dollar spent we got back more than $2 back in the selling price. And they got that price in a rising interest rate environment! Donna and Jim are extremely detailed and guide you through ever aspect of the sale. There were no surprises thanks to their guidance. We couldn’t be more pleased with their representation.
Thank you Donna and Jim,
Jerry and Mary
Heather Quejada
March 27, 2025
Trustindex verifies that the original source of the review is Google.
We have known Jim & Donna Klinge for over a dozen years, having met them in Carlsbad where our children went to the same school. As long time North County residents, it was a no- brainer for us to have the Klinges be our eyes and ears for San Diego real estate in general and North County in particular. As my military career caused our family to move all over the country and overseas to Asia, Europe and the Pacific, we trusted Jim and Donna to help keep our house in Carlsbad rented with reliable and respectful tenants for over 10 years.
Naturally, when the time came to sell our beloved Carlsbad home to pursue a rural lifestyle in retirement out of California, we could think of no better team to represent us than Jim and Donna. They immediately went to work to update our house built in 2004 to current-day standards and trends — in 2 short months they transformed it into a literal modern-day masterpiece. We trusted their judgement implicitly and followed 100% of their recommended changes. When our house finally came on the market, there was a blizzard of serious interest, we had multiple offers by the third day and it sold in just 5 days after a frenzied bidding war for 20% above our asking price! The investment we made in upgrades recommended by Jim and Donna yielded a 4-fold return, in the process setting a new high water mark for a house sold in our community.
In our view, there are no better real estate professionals in all of San Diego than Jim and Donna Klinge. Buying or selling, you must run and beg Jim and Donna Klinge to represent you! Our family will never forget Jim, Donna, and their whole team at Compass — we are forever grateful to them.
Lou F
March 27, 2025
Trustindex verifies that the original source of the review is Google.
WeI had the pleasure of working with Klinge Realty Group to sell our home in Carmel Valley, and I cannot recommend them highly enough!
Jim and Donna demonstrated exceptional professionalism, offering expert guidance on market conditions and pricing strategy, which resulted in a quick and successful sale.
Communication was prompt and we were well-informed throughout the entire process.
For anyone looking for a dedicated and knowledgeable real estate team, look no further!
---
William Sams
March 25, 2025
Trustindex verifies that the original source of the review is Google.
Donna and Jim Klinge of Klinge Realty Group have our highest possible recommendation. From Donna and Jim’s first visit to our house through closing their advice and counsel was candid and honest in all dealings. They kept us fully informed throughout the process. The house sold less than three days after listing with a two-week closing. My wife and I have sold several houses during our lives. This was by far the best experience. Klinge Reality is a premium service realtor. You can’t make a better choice for someone to sell your home fast and for top dollar.
Emily Hernandez
December 29, 2024
Trustindex verifies that the original source of the review is Google.
Donna and Jim provided exceptional support and professionalism throughout the entire process. We couldn't have been happier with their efforts. They made our house shine, and thanks to their expertise, it sold above the listing price in the very first weekend! Truly a fantastic experience from start to finish.
Jesus Adrian Sahagun
November 11, 2024
Trustindex verifies that the original source of the review is Google.
This year has been difficult on our family, mainly due to having to sell our home. Thankfully we knew God had a plan for us and working with the Klinge team was a key part of it. It was an obvious decision to work with them again after such an amazing experience when purchasing the same home we needed to sell. The challenge was, how will we do this in so little time with so much going on? Jim and Donna held our hand every step of the way. Whenever an unexpected issue arose they found and provided a solution. Never once did we feel pressured to make a decision and the Klinges were always reassuring after providing the information that the decision was ours to make. Despite the curve balls, they never panicked and exemplified the “can do” attitude, making us feel optimistic and taken care of. Their expertise and professionalism was superb. But of all the reasons to work with the Klinges, the most impactful and valuable is their compassion and genuine care for their clients. We pray that we can one day purchase our forever home and you better believe that Jim and Donna will be representing us - as long as they will have us of course. Thank you again Klinge team! Your execution, experience, and care are unmatched.
SABIHA PASHA
July 23, 2024
Trustindex verifies that the original source of the review is Google.
Jim and Donna were fantastic! Jim understanding my needs, recommending potential places, pointing out the pros and cons of each property was invaluable. Then when the offer was accepted Donna’s organized guidance through the inspections, paperwork etc made the whole process seem effortless.
So grateful that I had them on my side!
Anu Koberg
July 13, 2024
Trustindex verifies that the original source of the review is Google.
We first found Jim through his blog at bubbleinfo.com, which really showcased his knowledge of SoCal real estate. Since then we've done three transactions with Jim and Donna, and they are an incredible full service agency, with Jim's deep market insight and Donna's deft contract and project management. We trust them implicitly in their analysis and strategy, which is based on years of experience. They're always available and on top of things, and we strongly recommend them to anyone.
Bjorn Isachsen
July 10, 2024
Trustindex verifies that the original source of the review is Google.
The Good
The Klinge Realty Group operates like a finely tuned machine, with a very personal touch. We contacted them on a Sunday and they were talking to us about our family and our needs on our living room couch the following day. They carefully listened to us and worked with us to identify the best and quickest path to listing within 2 weeks to take advantage of the low inventory conditions in our South Carlsbad neighborhood. They knew our tract specifically and had many previous sales there over the years - they came prepared with a thorough analysis of comparative sales and recommended a pricing strategy that they felt confident would yield offers the first weekend on the market.
The Great
Over the next two weeks Donna coordinated a range of vendors who she knew from experience could get the preparation to list work we needed done on time and with high quality. Our light tune-up involved excellent experiences with their stagers, landscapers, contractors, electricians, and plumbers. Throughout this period Donna's daily communication was clear, concise, and responsive. Any time we had questions Donna picked up the phone or texted immediately - but almost always, she answered our questions before we even knew we had them.
The Outstanding
We had a tricky situation with a shared fence that could have delayed our escrow. Donna used superb mediation skills to negotiate the terms of replacement and was personally on site with the fence contractor to make sure everything went smoothly. The fence looks great and escrow closed on time.
The Truly Exceptional
Our house came on the market on a Wednesday and between then and Monday morning Jim was personally at all three open houses. He was in constant communication explaining potential buyer reaction and strength. As he predicted offers began to come in on Saturday and each one was incrementally higher than the last. At the end we had 5 offers, 4 of which were over list, and the final accepted offer was $100,000 over list. In addition to being over list it included rent back terms that met our needs.
The Recommendation
For all of these reasons we would strongly recommend The Klinge Team to anyone wanting to sell in North County Coastal San Diego. I had been reading Jim's bubbleinfo.com blog for 15 years and knew when the time came to sell that he would be our first call. Jim Klinge is not your standard realtor. He is keenly aware of market conditions and sales strategies. And, works his tail off - though not as hard as Donna . At this point he's gone from realtor to friend and I plan to have him over to grill and chill at our new place to talk real estate, but also just about life and raising kids in San Diego. He's more interested in relationships than his sales numbers - and that's why his sales numbers are so high. We have already recommended the Klinge's to some close friends and another successful sale is on deck right around the corner...
Chris Shea
June 21, 2024
Trustindex verifies that the original source of the review is Google.
We recently had the pleasure of working with Jim and Donna from Klinge Realty Group to sell our house, and we couldn't be more satisfied with the experience. From the initial meeting, they listened attentively to our needs and provided invaluable guidance on specific improvements to get our home market ready.
Their responsiveness throughout the entire process was truly impressive. Anytime we had questions or concerns, they were quick to address them, ensuring we felt comfortable and informed every step of the way. What stood out the most was their team and extensive network of tradespeople, which made addressing any necessary repairs or updates seamless and stress-free.
Thanks to their expertise and dedication, our house sold quickly and at a great price. We highly recommend Jim and Donna to anyone looking to buy or sell a home. They are a fantastic team who truly care about their clients and deliver exceptional results.