
It’s more than just the trendy areas – it’s red-hot everywhere.
Every metro area on the list is having substantial gains in their index, which means there has been a psychological shift happening coast-to-coast on how human beings feel about their homes. With the real-estate-selling business being one of the last totally-free markets left, it’s going to run wild for a while.
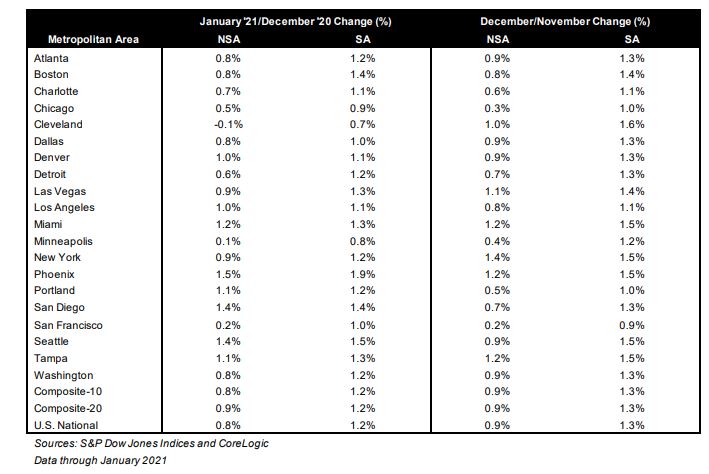
The #1 market, Phoenix, hit +1.9% month-over-month, which is incredible for a January reading.
It should put them on track for a +20% to +25% annual gain in 2021, and we won’t be far behind.
I think we might catch them!
San Diego had positive gains straight through the Covid-19 era last year, and now we have 2% monthly gains in our sights for the next few months. Look how that compares to the 2019 readings:
San Diego Non-Seasonally-Adjusted CSI changes
| Observation Month | |||
| January ’19 | |||
| Feb | |||
| Mar | |||
| Apr | |||
| May | |||
| June | |||
| July | |||
| Aug | |||
| Sep | |||
| Oct | |||
| Nov | |||
| Dec | |||
| Jan ’20 | |||
| Feb | |||
| Mar | |||
| Apr | |||
| May | |||
| June | |||
| July | |||
| Aug | |||
| Sep | |||
| Oct | |||
| Nov | |||
| Dec | |||
| Jan ’21 |
From S&P
“The strong price gains that we observed in the last half of 2020 continued into the f irst month of the new year. In January 2021, the National Composite Index rose by 11.2% compared to its year-ago levels,” says Craig J. Lazzara,Managing Director and Global Head of Index Investment Strategy at S&P DJI. “The trend of accelerating prices that began in June 2020 has now reached its eighth month and is also reflected in the 10- and 20-City Composites (up 10.9% and 11.1%, respectively). The market’s strength is broadly-based: all 20 cities rose, and all 20 cities gained more in the 12 months ended in January 2021 than they had gained in the 12 months ended in December 2020.
“January’s performance is particularly impressive in historical context. The National Composite’s 11.2% gain is the highest recorded since February 2006, just one month shy of 15 years ago. In more than 30 years of S&P CoreLogic Case-Shiller data, January’s year-over-year change is comfortably in the top decile. That strength is reflected across all 20 cities. January’s price gains in every city are above that city’s median level, and rank in the top quartile of all reports in 18 cities.
“January’s data remain consistent with the view that COVID has encouraged potential buyers to move from urban apartments to suburban homes. This demand may represent buyers who accelerated purchases that would have happened anyway over the next several years. Alternatively, there may have been a secular change in preferences, leading to a shift in the demand curve for housing. Future data will be required to analyze this question
“Phoenix’s 15.8% increase led all cities for the 20th consecutive month, with Seattle (+14.3%) and San Diego (+14.2%) close behind. Although prices were strongest in the West (+11.7%), gains were impressive in every region.”
~~~~~~~~~~~~~~~~~~~~~~~~~~~~~~~~~~~~~~~~~


People in Washington these days don’t really buy houses. They win them.
There was the picturesque Tudor in Silver Spring that asked $798,000, then sold for $943,000 after reeling in 22 offers. There was the modern three-bedroom near Glen Echo that also got 22 bids—despite that its owner didn’t allow an open house and required everyone who made a private appointment to first show proof of approval by a lender. That one asked $899,000 and sold for more than $1.1 million.
There was the place in North Cleveland Park, where so many people wanted to get in that listing agent Amy Levin had to reprogram the lockbox to allow for 24-hour access. The brick Colonial was priced at $1.595 million and got $1.775 million. After that, says Levin, “I called the 12 other people I’ve ever sold houses to over there and was like, ‘You’ve gotta get your house on the market.’ ”
And then there was the five-bedroom in Alexandria with the great backyard. On the afternoon of the open house, listing agent Marian Rosaaen turned onto the cul-de-sac and at first couldn’t make sense of the crowd: “Hand to God, I said, ‘Is someone having a block party right now?’ ” The home, listed for $624,500, got 54 offers. Fifty-four. (As of press time, the sale hadn’t closed.)
Interviews with more than two dozen local agents turn up similar stories from one side of the Beltway to the other, one jaw-dropping scenario after another. They also reveal an explanation for what’s going on—a trend that long preceded the calamitous arrival of Covid.
As anyone who’s tried to buy a house in the last decade knows, Washington has been in the throes of a worsening housing shortage since the Great Recession. The last time the area had a six-month supply of homes for sale—the threshold for a balanced market—was nearly 12 years ago, according to the real-estate site UrbanTurf.
For the past couple of years, the supply has hovered mostly between one and a half and two months, according to Bright MLS, the listing service that local agents use. All the while, prices have risen and regional leaders have fretted about housing costs scaring away the middle class and damaging the region’s ability to compete.
https://www.washingtonian.com/2021/03/29/inside-dcs-pandemic-fueled-real-estate-boom/