Yes – the inferior homes won’t be selling as fast, or for as much, as the superior homes.
There should be a gap – a sizable gap – between inferior and superior homes. But over the last year, it got squeezed and those who were selling inferior homes really made out nicely. Not only did they sell quickly, they didn’t have to discount much, if at all.
Those are the homes that will be sitting around longer as buyers catch their breath.
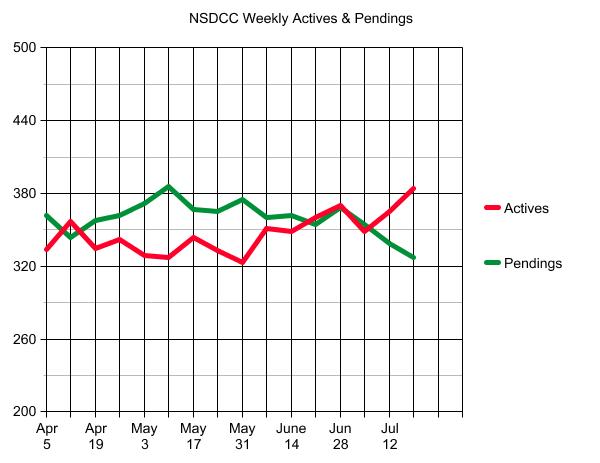
But the counts of active listings are so low that it won’t matter much if they creep up a bit:
It looks like the counts of active and pending listings are on their way back to normal.
The impact depends on the price point though. The low-end market is evaporating, and if we had a surge of 25-50 new listings, they probably wouldn’t last long:
On July 22, 2019, we had 94 active listings and 84 pending listings priced under $1,000,000.
Last year at this time we had 34 active listings and 73 pendings priced under $1,000,000.
Today we have 5 actives, and 16 pendings priced under $1,000,000.
Once a homeowner starts believing that their home is worth a million-something, it would take years to convince them otherwise.
“We’re starting to see what a difference just a slight uptick in inventory and listings can do to help lessen the buying frenzy and create a sense of normalcy,” said C.A.R. President Dave Walsh (California).
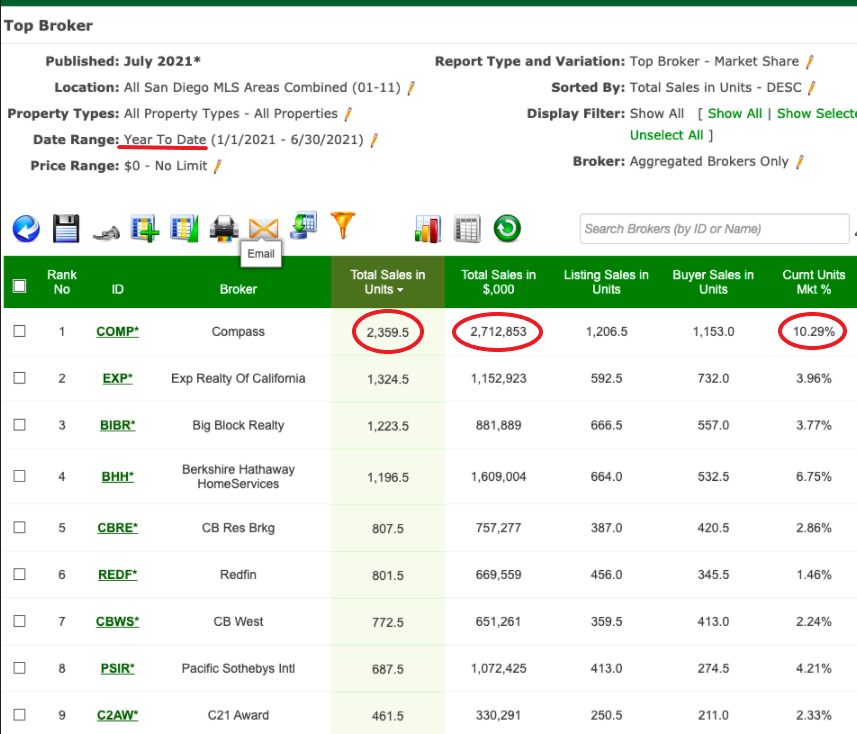
In less than 4 years, Compass has become the dominant residential-resale brokerage in San Diego County, and it’s not close. Even if you added the two CBs together, their market share is less than half of ours.
It’s been the aggressive recruiting of top agents that built the sales force, and the vast majority of those agents came from the other brokerages on this list. It tends to be a zero-sum game too – as we get bigger and better, the others are going to struggle to keep up.
Want to be a part of the Compass juggernaut? The Klinge Realty Group is hiring!
Did you know that 87% of new licensees quit during their first year in the business?
Your training is critical to your success! Whether you have a few years of experience or are just getting your license, we can help you build a solid real estate practice. Contact us today!
This oceanfront 2br/3.5 ba, 2,823sf upper unit in Carlsbad just closed for $4,925,000 cash, which was $75,000 under list. MT was 12 days. Unlike on Neptune in Leucadia, all of the oceanfront homes on this street have direct beach access.
The Zillow press release is dated June 10th, which is work done in May – we’ve had some signs of slowing since:
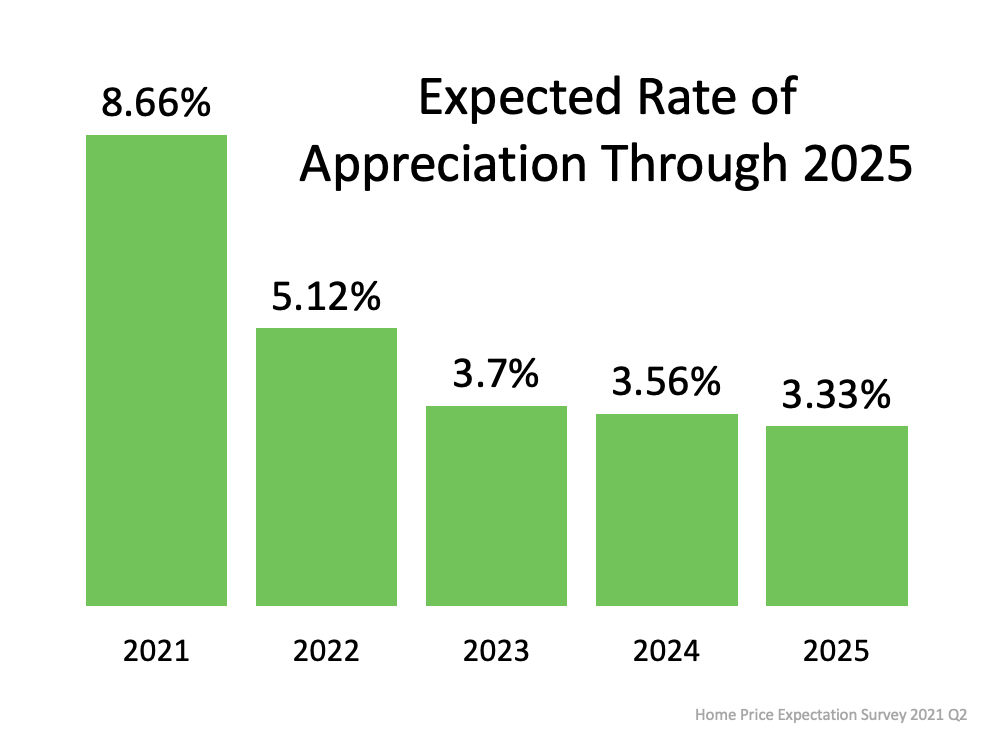
With housing demand showing no signs of slowing from a pandemic-fueled boom in the second half of 2020, the expert panel has once again adjusted their home-price growth expectations upward. The panel’s average home value growth prediction for 2021 is 8.7% — the highest for any year since the inception of the quarterly survey in 2010. That’s up from 6.2% last quarter and more than double the expectation from the Q4 2020 survey (4.2%). Home value growth is expected to moderate down to 5.1% in 2022, according to the panel, which would still be strong growth compared to a historical average of about 4%.
“A profound shift in housing preferences, adoption of remote employment, low mortgage rates, and the recovering economy continue to stoke demand in the single-family market and drive prices higher,” said Terry Loebs, founder of Pulsenomics. “Strict zoning regulations, an acute labor shortage, and record-high materials costs are constraining new construction, compounding disequilibrium, and reinforcing expectations that above-normal rates of home price growth will persist beyond the near-term.”
But isn’t predicting the annual 3% home appreciation just the typical safe bet by economists?
If the actual results end up being 0% to 6%, they can say they were close.
Let’s assume they are right, however, and look at how their predictions could happen on the street.
Sellers typically list their home for more than the last guy got. The environment is optimistic, so sellers tacking on 5% to the last sale nearby to determine their list price has been what’s been happening.
This year, virtually all of them got it, and the national rate of 8.66% above will be about right.
Next year, the 5.12% would be a likely result of many homes selling for more than 5% above the last comp, but the majority selling for 2% to 4% above.
In years 2023-2025, the majority of homes sold will be selling for about the same as the last comp. But with a few of the special homes still closing for 5% or more above the last sale nearby, the overall appreciation rate gets dragged up into the 3s.
So it’s the 3% appreciation rate that will indicate that we’ve pulled into Plateau City.
If it goes that way, it means it will be another year before the frenzy cools off enough that buyers will have some real negotiating power.
Happy Birthday Doug; it’s hard to believe you’ve been gone for four years already – we miss you, and I wish you would have been here for this insanity! Here we are discussing the 2013 frenzy slowdown, and he was right with his prediction:
Another thought by Doug that didn’t make the video:
The number of oceanfront properties doesn’t change, yet how many millionaires are created daily?
Trustindex verifies that the original source of the review is Google.
We sold a home with Jim and Donna and from beginning to end they were consummate professionals. Their initial walk through the property resulted in a list of items to be repaired or updated. They supplied a list of vendors and job quotes to do the repairs and updates. We originally wanted to sell ‘as is’ and just get it over with. They gave us a selling price for ‘as is’ and options for doing a few updates/repairs to doing it all with the selling price for each option. We agreed to do all they suggested and we sold for the exact price they predicted. For every dollar spent we got back more than $2 back in the selling price. And they got that price in a rising interest rate environment! Donna and Jim are extremely detailed and guide you through ever aspect of the sale. There were no surprises thanks to their guidance. We couldn’t be more pleased with their representation.
Thank you Donna and Jim,
Jerry and Mary
Heather Quejada
March 27, 2025
Trustindex verifies that the original source of the review is Google.
We have known Jim & Donna Klinge for over a dozen years, having met them in Carlsbad where our children went to the same school. As long time North County residents, it was a no- brainer for us to have the Klinges be our eyes and ears for San Diego real estate in general and North County in particular. As my military career caused our family to move all over the country and overseas to Asia, Europe and the Pacific, we trusted Jim and Donna to help keep our house in Carlsbad rented with reliable and respectful tenants for over 10 years.
Naturally, when the time came to sell our beloved Carlsbad home to pursue a rural lifestyle in retirement out of California, we could think of no better team to represent us than Jim and Donna. They immediately went to work to update our house built in 2004 to current-day standards and trends — in 2 short months they transformed it into a literal modern-day masterpiece. We trusted their judgement implicitly and followed 100% of their recommended changes. When our house finally came on the market, there was a blizzard of serious interest, we had multiple offers by the third day and it sold in just 5 days after a frenzied bidding war for 20% above our asking price! The investment we made in upgrades recommended by Jim and Donna yielded a 4-fold return, in the process setting a new high water mark for a house sold in our community.
In our view, there are no better real estate professionals in all of San Diego than Jim and Donna Klinge. Buying or selling, you must run and beg Jim and Donna Klinge to represent you! Our family will never forget Jim, Donna, and their whole team at Compass — we are forever grateful to them.
Lou F
March 27, 2025
Trustindex verifies that the original source of the review is Google.
WeI had the pleasure of working with Klinge Realty Group to sell our home in Carmel Valley, and I cannot recommend them highly enough!
Jim and Donna demonstrated exceptional professionalism, offering expert guidance on market conditions and pricing strategy, which resulted in a quick and successful sale.
Communication was prompt and we were well-informed throughout the entire process.
For anyone looking for a dedicated and knowledgeable real estate team, look no further!
---
William Sams
March 25, 2025
Trustindex verifies that the original source of the review is Google.
Donna and Jim Klinge of Klinge Realty Group have our highest possible recommendation. From Donna and Jim’s first visit to our house through closing their advice and counsel was candid and honest in all dealings. They kept us fully informed throughout the process. The house sold less than three days after listing with a two-week closing. My wife and I have sold several houses during our lives. This was by far the best experience. Klinge Reality is a premium service realtor. You can’t make a better choice for someone to sell your home fast and for top dollar.
Emily Hernandez
December 29, 2024
Trustindex verifies that the original source of the review is Google.
Donna and Jim provided exceptional support and professionalism throughout the entire process. We couldn't have been happier with their efforts. They made our house shine, and thanks to their expertise, it sold above the listing price in the very first weekend! Truly a fantastic experience from start to finish.
Jesus Adrian Sahagun
November 11, 2024
Trustindex verifies that the original source of the review is Google.
This year has been difficult on our family, mainly due to having to sell our home. Thankfully we knew God had a plan for us and working with the Klinge team was a key part of it. It was an obvious decision to work with them again after such an amazing experience when purchasing the same home we needed to sell. The challenge was, how will we do this in so little time with so much going on? Jim and Donna held our hand every step of the way. Whenever an unexpected issue arose they found and provided a solution. Never once did we feel pressured to make a decision and the Klinges were always reassuring after providing the information that the decision was ours to make. Despite the curve balls, they never panicked and exemplified the “can do” attitude, making us feel optimistic and taken care of. Their expertise and professionalism was superb. But of all the reasons to work with the Klinges, the most impactful and valuable is their compassion and genuine care for their clients. We pray that we can one day purchase our forever home and you better believe that Jim and Donna will be representing us - as long as they will have us of course. Thank you again Klinge team! Your execution, experience, and care are unmatched.
SABIHA PASHA
July 23, 2024
Trustindex verifies that the original source of the review is Google.
Jim and Donna were fantastic! Jim understanding my needs, recommending potential places, pointing out the pros and cons of each property was invaluable. Then when the offer was accepted Donna’s organized guidance through the inspections, paperwork etc made the whole process seem effortless.
So grateful that I had them on my side!
Anu Koberg
July 13, 2024
Trustindex verifies that the original source of the review is Google.
We first found Jim through his blog at bubbleinfo.com, which really showcased his knowledge of SoCal real estate. Since then we've done three transactions with Jim and Donna, and they are an incredible full service agency, with Jim's deep market insight and Donna's deft contract and project management. We trust them implicitly in their analysis and strategy, which is based on years of experience. They're always available and on top of things, and we strongly recommend them to anyone.
Bjorn Isachsen
July 10, 2024
Trustindex verifies that the original source of the review is Google.
The Good
The Klinge Realty Group operates like a finely tuned machine, with a very personal touch. We contacted them on a Sunday and they were talking to us about our family and our needs on our living room couch the following day. They carefully listened to us and worked with us to identify the best and quickest path to listing within 2 weeks to take advantage of the low inventory conditions in our South Carlsbad neighborhood. They knew our tract specifically and had many previous sales there over the years - they came prepared with a thorough analysis of comparative sales and recommended a pricing strategy that they felt confident would yield offers the first weekend on the market.
The Great
Over the next two weeks Donna coordinated a range of vendors who she knew from experience could get the preparation to list work we needed done on time and with high quality. Our light tune-up involved excellent experiences with their stagers, landscapers, contractors, electricians, and plumbers. Throughout this period Donna's daily communication was clear, concise, and responsive. Any time we had questions Donna picked up the phone or texted immediately - but almost always, she answered our questions before we even knew we had them.
The Outstanding
We had a tricky situation with a shared fence that could have delayed our escrow. Donna used superb mediation skills to negotiate the terms of replacement and was personally on site with the fence contractor to make sure everything went smoothly. The fence looks great and escrow closed on time.
The Truly Exceptional
Our house came on the market on a Wednesday and between then and Monday morning Jim was personally at all three open houses. He was in constant communication explaining potential buyer reaction and strength. As he predicted offers began to come in on Saturday and each one was incrementally higher than the last. At the end we had 5 offers, 4 of which were over list, and the final accepted offer was $100,000 over list. In addition to being over list it included rent back terms that met our needs.
The Recommendation
For all of these reasons we would strongly recommend The Klinge Team to anyone wanting to sell in North County Coastal San Diego. I had been reading Jim's bubbleinfo.com blog for 15 years and knew when the time came to sell that he would be our first call. Jim Klinge is not your standard realtor. He is keenly aware of market conditions and sales strategies. And, works his tail off - though not as hard as Donna . At this point he's gone from realtor to friend and I plan to have him over to grill and chill at our new place to talk real estate, but also just about life and raising kids in San Diego. He's more interested in relationships than his sales numbers - and that's why his sales numbers are so high. We have already recommended the Klinge's to some close friends and another successful sale is on deck right around the corner...
Chris Shea
June 21, 2024
Trustindex verifies that the original source of the review is Google.
We recently had the pleasure of working with Jim and Donna from Klinge Realty Group to sell our house, and we couldn't be more satisfied with the experience. From the initial meeting, they listened attentively to our needs and provided invaluable guidance on specific improvements to get our home market ready.
Their responsiveness throughout the entire process was truly impressive. Anytime we had questions or concerns, they were quick to address them, ensuring we felt comfortable and informed every step of the way. What stood out the most was their team and extensive network of tradespeople, which made addressing any necessary repairs or updates seamless and stress-free.
Thanks to their expertise and dedication, our house sold quickly and at a great price. We highly recommend Jim and Donna to anyone looking to buy or sell a home. They are a fantastic team who truly care about their clients and deliver exceptional results.