This report should be the last dagger for buyer-agents.
Won’t buyers who are empowered by searching for homes on the internet themselves just go direct to the listing agent, rather than paying extra for their own representation? They don’t think they need representation – they can find houses on their own!
Listing agents will encourage this program too – and just charge 4%-5% and keep the whole fee (which this report didn’t see coming). In addition, without buyer-agents there will be no need for the MLS. The search portals will become an option, rather than a requirement, for listing agents to advertise their listings if they feel like it.
Also, realtors will be extremely reluctant to advertise their true rates and services. How do we know that? How many realtor blogs do you see today? Instead, the braggadocious fluff will prevail.
Bold added:
Washington, D.C. – A new report by the Consumer Federation of America (CFA) on residential real estate commissions – The Relationship of Residential Real Estate Commission Rates to Industry Structure and Culture – shows that buyer agent commissions are highly uniform. This rate uniformity is strongly supported by the industry’s compensation system in which home sellers pay the commissions of both the listing agent and the buyer agent. Uncoupling (or untying) seller and buyer agent compensation would spur price competition that would substantially reduce the some $100 billion in commissions paid annually by consumers.
“The current commission system is designed to thwart price competition among agents,” said Stephen Brobeck, a CFA senior fellow and the report’s author. “If home buyers were allowed to negotiate their agent’s commission, agents would be encouraged to compete on price and service,” he added.
CFA’s analysis of more than 10,000 home sales this year, in 21 cities from the eastern half of the U.S., shows that buyer agent rates were highly uniform. As the appended table shows:
In eight of the cities, more than 80 percent of the rates were identical.
In 14 cities, more than 88 percent of the rates ranged between 2.5 and 3.0 percent.
In all cities but Brooklyn NY, at least 72 percent of the rates ranged between 2.5 and 3.0 percent.
The report’s analysis of these buyer agent rates and their relationship to listing agent rates reveals that the typical total commission in these cities ranged between five and six percent. The report also explains why the most widely-quoted estimate of a national average rate – by industry-related Real Trends and now below five percent – is misleading and probably inaccurate.
In a Price-Competitive Market, Commission Rates Would Vary Considerably
In a price-competitive marketplace, rates would vary greatly because of several factors:
The work-related costs of agents can vary greatly. Listing agents can do as little as just listing the house on their local multiple listing service (MLS) or also arranging high-quality photos and videos, developing and distributing marketing materials, and meeting potential buyers. Buyer agents can, for example, show only one house or more than a dozen homes.
When the work does not vary, the compensation usually does. Total agent compensation, at a five percent rate (of the sale price), varies from $5,000 on the sale of a $100,000 home to $50,000 on the sale of a $1,000,000 home.
The quality of agent service often varies but the rate usually does not. Experienced agents typically charge the same rates as agents who have just received their license.
In home sales, some agents are fiduciaries with total loyalty to clients while other agents work as dual agents or transaction brokers, with loyalty to neither seller nor buyer. Fiduciaries, in general, deserve higher compensation.
Industry Structure and Culture Block This Price Competition
The report shows that the above factors, which should result in highly variable commission rates and agent compensation, are minimized by the structure and culture of the industry.
Historic Rate-Setting: It was only through determined efforts of the U.S. Department of Justice, Federal Trade Commission (FTC), and some state attorney-generals that toward the end of the last century, the industry shifted from explicit rate-setting to “covert-price setting,” the term used by a 1983 Federal Trade Commission report.
Industry Rules: The industry requires listing agents (and clients) using local multiple listing services (MLS) to offer fixed compensation to buyer agents selling the properties. Buyers are unable to negotiate this compensation, and buyers are usually told, if they ask their agent, that sellers pay the agent’s commission. Sellers, on the other hand, are informed by their listing agents that lowering this buyer compensation will risk buyer agents “steering” their clients to higher-commission properties.
Industry Norms: The industry promotes a “cooperative” culture in which agents are expected to be “team players,” according to the FTC’s 1983 report. Company policy manuals often constrain rates charged, and agent scripts explain how agents can avoid negotiating lower rates. A core norm of the industry culture is not talking or writing about commission rates, which helps explain why very few firms, except discounters, advertise commission rates, disclose them on websites, provide them to inquiring consumers who call firms, or typically discuss them at all with home buyers.
Agent Surplus: The high ratio of agents – over 1.5 million realtors – to number of home sales – about six million annually – forces agents to spend much time and money seeking clients. It also provides a strong incentive for agents and firms to support high, uniform rates.
The report notes that there appears to have been some recent erosion of rates and their uniformity. Over several decades, typical rates in urban areas have declined from six to seven percent to five to six percent (with no loss of agent incomes because of rising housing prices). In some cities, there are now a large number of sales at both 2.5 percent and at 3.0 percent. And in Brooklyn, where expensive homes generate substantial fees, typical buyer agent rates are well below 2.5 percent.
Uncoupling Buyer and Listing Agent Commissions Would Spur Rate Competition
The report suggests that the one measure which could spur rate competition is uncoupling buyer and listing agent commissions so that buyers can negotiate compensation with their agents. Buyer agent commissions, now baked into listed prices, would instead be negotiated by buyers. That would lower home sale prices, and both the mortgage and real estate industries would ensure that these commissions could be included in mortgages whose amount financed would not need to increase.
The uncoupling of rates would also free listing agent discounters from the shackles of current industry rules that force them to charge typical buyer agent rates. Over time, there would be a much wider variation in rates (and service options) reflecting agent experience, work, effort, representation, and willingness to compete on rates.
There is a broad and increasing consensus that commission rates should be uncoupled.
Studies published on both the Right (Cato Institute) and Left (Brookings Institute) argue strongly for this untying. Lawsuits filed by major class action firms seek to uncouple commissions. The U.S. Department of Justice is pursuing antitrust issues beyond improved disclosures. The Biden administration’s antitrust agenda targets tied commissions. Even some voices from the industry have suggested the consideration of changes in current rate compensation practices.
A week ago, the National Association of Realtors (NAR) announced changes that would allow agents, firms, and portals to publish buyer agent rates. In an analysis of these changes, CFA noted that they would discourage agents from steering consumers to higher-commission properties, but would not permit significant rate competition because buyers would still not pay, or be able to effectively negotiate, compensation of their agents.
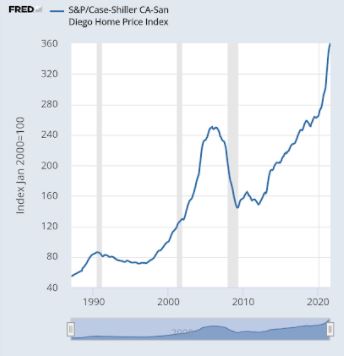
‘Deceleration’ at +24.9% YoY compared to when our market was just ramping up for the year-end frenzy of 2020? I’ll take it!
San Diego Non-Seasonally-Adjusted CSI changes
Observation Month
SD CSI
M-o-M chg
Y-o-Y chg
Jan ’20
264.04
+0.2%
+5.1%
Feb
265.34
+0.5%
+4.6%
Mar
269.63
+1.6%
+5.2%
Apr
272.48
+1.1%
+5.8%
May
273.51
+0.4%
+5.2%
Jun
274.91
+0.5%
+5.0%
Jul
278.00
+1.1%
+5.4%
Aug
283.06
+1.8%
+7.6%
Sep
288.11
+1.8%
+9.4%
Oct
292.85
+1.6%
+11.5%
Nov
295.64
+1.0%
+12.3%
Dec
297.52
+0.6%
+13.0%
Jan ’21
301.72
+1.4%
+14.3%
Feb
310.62
+2.9%
+17.1%
Mar
320.81
+3.3%
+19.1%
Apr
331.47
+3.3%
+21.6%
May
341.05
+2.9%
+24.7%
Jun
349.78
+2.6%
+27.2%
Jul
355.33
+1.6%
+27.8%
Aug
357.11
+0.5%
+26.2%
Sep
359.88
+0.8%
+24.9%
“If I had to choose only one word to describe September 2021?s housing price data, the word would be ‘deceleration,’ says Craig Lazzara, managing director at S&P Dow Jones Indices. “Housing prices continued to show remarkable strength in September, though the pace of price increases declined slightly.”
Extremely tight inventory, as well as heavy investor activity in the housing market, is keeping prices elevated. While the gains are falling, it is unlikely that prices will drop dramatically as they did during the housing crash. The fundamentals of supply and demand still favor an expensive market.
“The market has cooled since the beginning of the year, when dozens of competing bids, contingency waivers and price escalation clauses made home shopping a struggle, especially for first-time buyers. A growing number of homeowners are preparing to list in the next six months, hinting at an uncharacteristically active winter season,” said George Ratiu, manager of economic research at Realtor.com.
Before buying a second home, it’s smart to know how owning a second property could impact your taxes. There are many second home tax benefits to consider, but they’ll vary based on how the IRS classifies the property — as a second home, an investment property, or a little of both. Here are the main differences:
A second home:
Is occupied by the owner at least 14 days out of the year
Is rented to others 14 days or fewer out of the year
An investment property:
Is occupied by the owner fewer than 14 days out of the year
Is rented to others more than 14 days out of the year
A mixed-use property:
Is occupied by the owner more than 14 days out of the year
Is rented to others more than 14 days out of the year
Second home tax benefits
As long as you occupy your second home for more than 14 days a year, you may qualify for these second home tax breaks:
Mortgage interest deduction
Single filers and married couples filing jointly can deduct mortgage interest up to a total of $750,000 from all properties they own, including a principal residence and their second homes. This is subject to change in 2025, when the Tax Cuts and Jobs Act is scheduled to expire. At that time it is expected that the $1 million limit will return.
Property tax deduction
You can deduct property taxes on all the properties you own, with a maximum deduction of up to $10,000 per tax return, or $5,000 if married filing separately. Keep in mind that this is included in the deduction for state and local income taxes (SALT), so you might reach that $10,000 quickly with your principal residence and be unable to deduct property taxes from a second home.
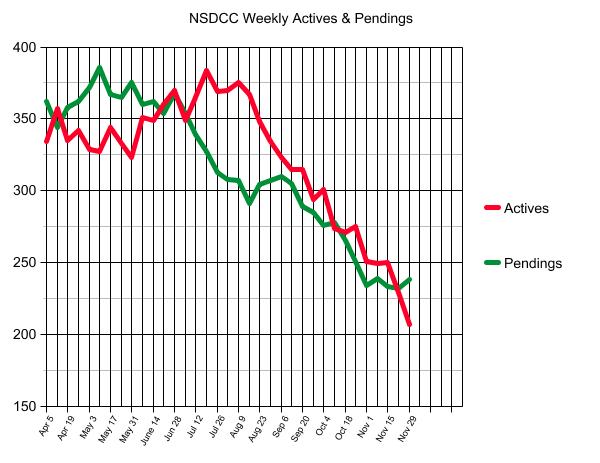
The active listings are plummeting, but the pendings will not be deterred!
We are setting up for an very active spring selling season, whether we have inventory or not. I actually hope we don’t get a surge of new listings, and it forces the industry to adopt the auction format sooner.
Excerpts from this article about real estate soliciting – it’s going to get crazier! Hat tip to just some guy:
Jennifer Folden-Nissen’s three-bedroom, Victorian-style house in Duluth, Ga., isn’t for sale. But that hasn’t stopped a guy calling himself Henry from phoning her at least once a week. She says the pitch is always the same: “I want to buy your house. I’m willing to pay cash. Today.”
She says it’s sort of like having to deal with an insistent car salesman. “I just let him leave voicemails,” she says. But even those are pushy. “Call me back, call me back, call me back, call me right now — I’m out front of your house.”
Folden-Nissen works at the local fire department, and she’d call home and ask her husband to see if the guy was outside. But nobody ever was. Then she started to get postcards from the same guy — with no stamp, so apparently hand-delivered — with photos of her own home on them.
“It was a little freaky because some of it was just like, OK, is the guy really outside?” she says. “And why is he taking pictures of my house if I haven’t given him the time of day?”
“They have just gotten increasingly worse in the past six months, six or seven calls every day,” says Lauren Barber, who lives in Columbus, Ohio.
“If you know anything about Columbus, it’s growing and it’s hot,” she says. “People want to live here.” Barber bought her house about 10 years ago for $155,000. She says now it’s worth more than twice that.
Investors can go on the internet and buy lists of phone numbers for people whose homes have risen in value, maybe more than the owners’ realize.
Barber works in human resources, so she says she has to answer her phone. “It could be one of our employees calling me with a question.” She says she tries to block the homebuyer calls, but they always seem to somehow call from a different local-looking number.
She says one of them even called her mother’s house, on purpose, to ask if Barber would sell.
“Like, really, you’re going to call my mom and ask her if I’m going to sell my house to you? It was just the most absurd and amazing thing,” she says. “But I told you no. Stop calling me. Don’t bother my mom.”
During the inspection of the fixer in Olde Carlsbad, it was determined that further investigation was warranted due to the slope in the floor.
A geologic engineer came out with his fancy altimeter and found that there was a 5-inch difference between the foundation height from one side of the house to the other.
Here’s how it looked. When you have seen me do this, I have set the ball down and let it go where it goes. In this case, the buyer rolled the ball in one direction, only to have it make a U-turn and go the other way…..and it picked up speed:
In the course of the discussion, I asked, “What is the worst you have seen?”
The engineer said, “A nine-inch differential.”
I said, “Ok, so this is kinda in the middle”.
To which I added a solution. Install the popular wood-tile, and have the installer add some extra mortar to help make up the difference. It doesn’t have to get to zero – if it was down to 2-3 inches it wouldn’t be as noticeable.
The buyers asked for a $50,000 reduction in price, and the seller agreed. It could have been worse – cancelling this sale and finding a new buyer who would pay more than $1,050,000 seemed unlikely.
Our sale closed on Tuesday, a couple of days after this closed nearby:
Going into Thanksgiving. let’s summarize the current market conditions…….
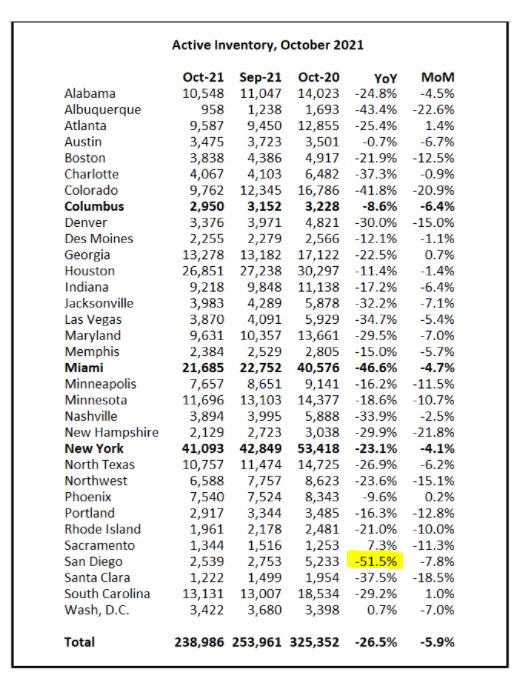
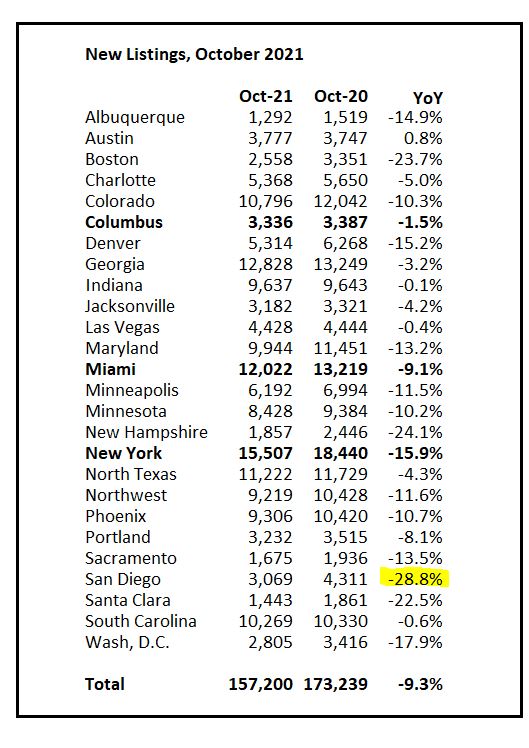
San Diego’s -51.5% (above) is still #1 on Bill’s list of local housing markets for the largest decline in active inventory in October. The active inventory reflects the velocity of new listings coming to market to replace those going pending every month.
When the active inventory is in decline, it means the supply isn’t keeping up with demand!
How do the raw number of October listings compare to last year?
San Diego’s decline is #1 again:
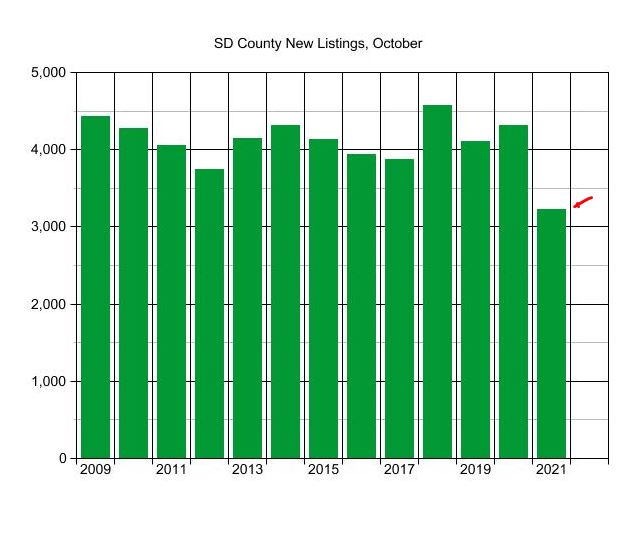
But how do those October listings compare to previous years? Wasn’t the end of 2020 the hottest market of all-time? It turns out that new-listings count last October looked a lot like the previous ones, and this year is the most unusual in recent memory:
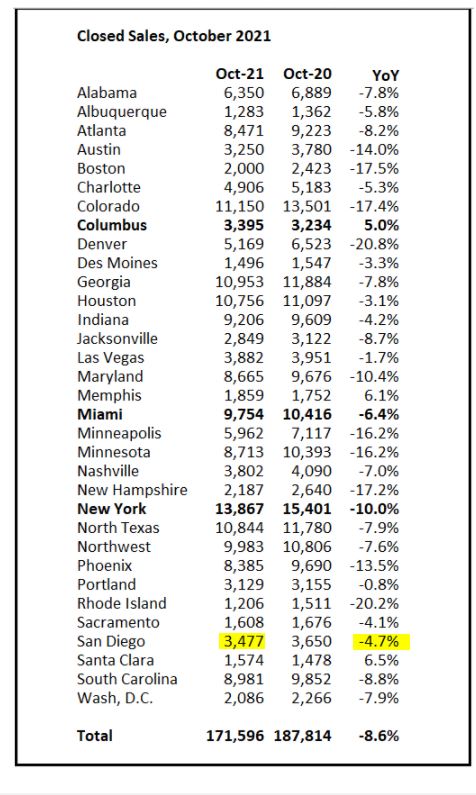
Yet sales have barely felt the dropoff of supply. The -4.7% YoY drop in sales is a flesh wound, relatively, when you consider that we had more sales than new listings:
Where do people go who have the money to live anywhere? San Diego!
Everybody wants to live here, and nobody wants to leave!
Our market should thrive for years, and could end up being the most expensive real estate in the country.
Because I wanted to make the competitive bidding all about price, I was willing to live with the other terms in each buyer’s offer.
The winners included a $50,000 good-faith deposit in their full-price offer – which was a little light. Typically, the deposit is 3%, which would have been $101,850. But every buyer can blow out of escrow during their contingency period, regardless of their deposit amount, and once they do release all contingencies, they must be satisfied enough that they intend to close.
I’m not going to give them a reason to walk away from $50,000, so it would take a catastrophic event for them to cancel after releasing all contingencies. Would they walk away from $50,000, but not $101,850? It’s possible, but if it’s a catastrophic event, then the extra $50,000 probably wouldn’t matter.
When you treat people right, they don’t cancel.
~~~~~~~~~~~~~~~~~~~~~~~~~~~~~~~~~~
We spent the six weeks preparing the home to be spectacular, which included repairing the water leak that happened right as we got started. The master shower faucet leaked inside the wall, and it went straight down to the family room fireplace and TV niche. We had our mold remediation guy handle the re-construction, plus did a mold test that came back clear. Everything gets disclosed to the buyers, so you might as well do it right the first time.
The buyers reviewed the information, and were satisfied.
When you treat people right, they don’t cancel.
~~~~~~~~~~~~~~~~~~~~~~~~~~~~~~~~~~~~~
The house is 18 years old. When the seller bought it, the home inspection noted that the HVAC was nearing the end of its useful life, and that there were several fogged windows. We expected that the home inspection by these buyers would reveal the same.
Buyer’s remorse is real, and it gets magnified in a bidding war. When paying above the list price, it is natural for buyers to want to claw back some of it. We expect it, and are prepared for it.
The previous seller gave us a credit for the fogged windows, so it was just a matter of getting them done, and we knew the approximate cost of a new furnace and air conditioner.
We discussed whether we should replace the HVAC and windows in advance, but decided against it – and left them for the buyers to claw-back instead. Once requested, we were happy to oblige – unlike most agents who want to start World War 3 over every repair request.
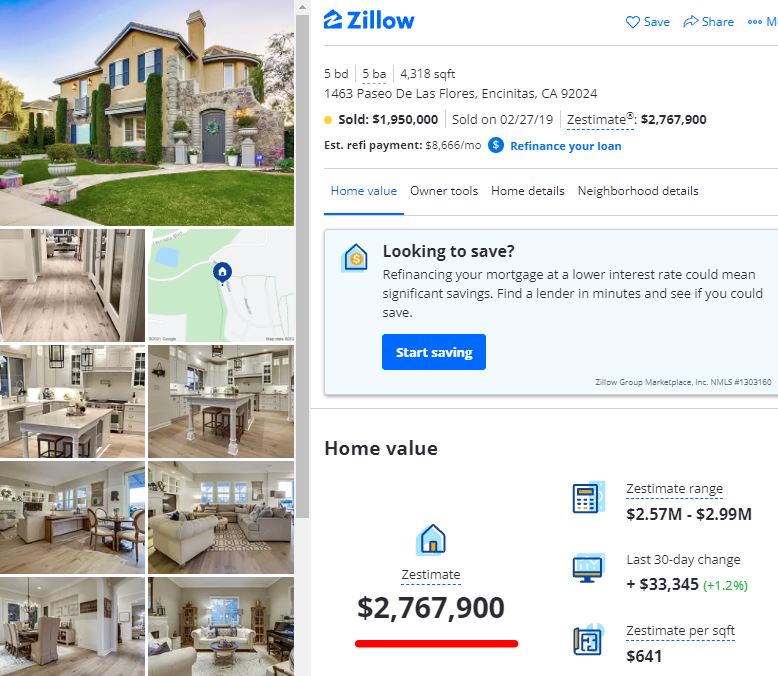
On February 27, 2019, our seller purchased 1463 Paseo de las Flores for $1,950,000. At the time, it was one of the top four highest-priced sales EVER in Encinitas Ranch, with two of the higher sales being $1,970,000 and $1,975,000 (plus a $2,100,000 back in 2005).
I have always kept an eye on a house further down the fairway because its first owner was Jill Kammerude, a close friend and fellow realtor. We had shared her Padres season tickets from 1998 to 2009 when she unfortunately passed away.
Her 4,612sf house on the golf course had sold again on April 8th of this year for $2,405,000:
I had been to this house a few times, and though it had more of the older look, it was comparable to the home we sold on Paseo de las Flores. I sent the link to my client, and congratulated him on picking up a cool $500,000 in appreciation in just two years.
I asked if he would consider moving, to which he said, ‘Maybe’.
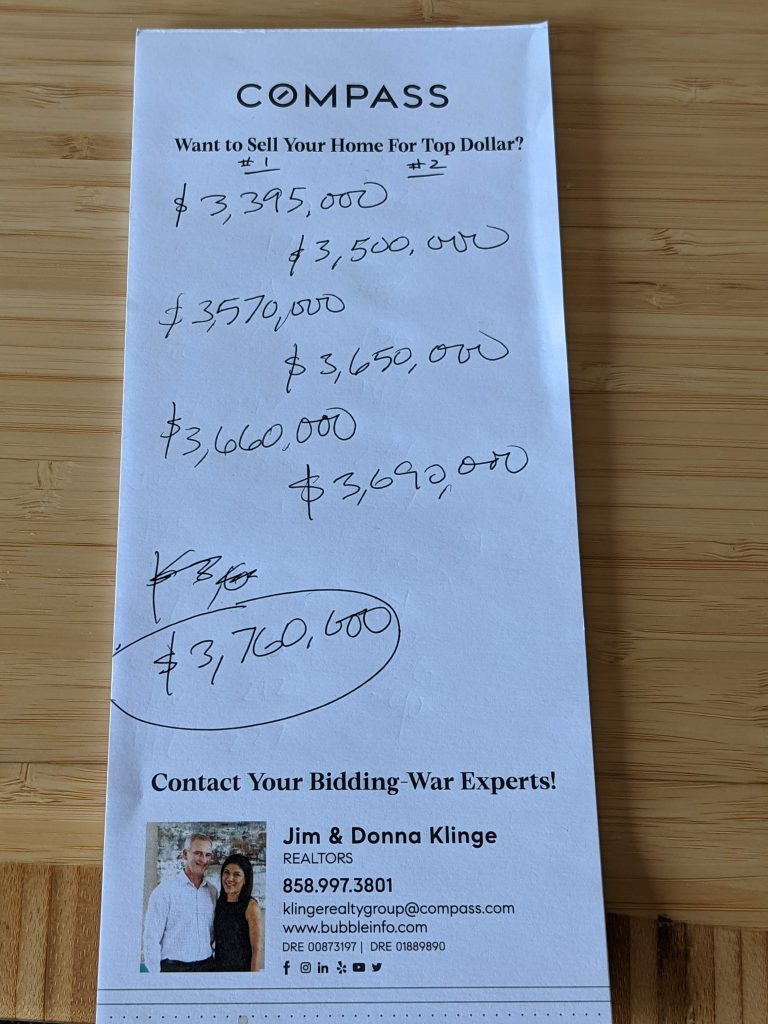
We began talking regularly about where to move, taxes, repairs, etc., and in mid-September he committed to selling. We began our 6-week tune-up, and on October 21st, we hit the open market listed for $3,395,000, because there had been a flurry of $3,000,000+ sales nearby.
I told the story previously……that I had received two solid cash offers during the open house, and was telling attendees that I was going to sell it that day. Both buyers were anxious, so once I left the open house, it was time to determine the winner.
I do take pride in utilizing sophisticated high-tech tools, and this day was no exception.
I pulled out my Super-Duper Bidding-War Bonanza sheet, and went to work:
I went back and forth between the agents on the phone, telling them the price to beat – and they filed the bids above. Buyer #1 delivered the knockout blow with their $3,760,000, and we had a winner – and Buyer #2 went right over to Lynwood and bought it instead.
How I handled the communication was critical – it takes more than a fancy notepad.
In particular, because we did the bidding verbally on the phone, I had to get the buyers to commit to their price in writing before they cooled off – which I did, and it closed today for $3,760,000.
Keeping the buyers happy for a month, helping the seller move, and delivering the house in excellent condition was all part of the process too. Thank you Donna!
It would have been easy to discard the first cash offer of $3,395,000 because the buyers saw the house via FaceTime, and instead taken the $3,500,000 cash offer from the buyer who saw it in person. Almost all other agents would have done so. But with me at the helm, my seller made an extra $260,000.
It sold for $700,000 more than the model-match that sold on October 25th, one block over.
It sold for $992,100 more than the zestimate!
It sold for $1,360,000 more than its approximate value in April, which is a 56% pop in six months!
It sold for $1,810,000 more than the seller paid, which is a 93% return in 32 months!
Trustindex verifies that the original source of the review is Google.
Jim & Donna Klinge helped us sell our home of 30 years in Ocean Hills. We were very happy with their service and would HIGHLY recommend them to anyone looking for an Honest, Knowledgeable, Skilled, Informed Efficient realty team. Both Jim & Donna were so helpful in different ways and complemented each others skills. Please refer to a more detailed review that we wrote on YELP. Thank You Both for all your help!!!
Jesse O'Hara
June 12, 2025
Trustindex verifies that the original source of the review is Google.
A+ thank you
Lisa Tuomi
June 11, 2025
Trustindex verifies that the original source of the review is Google.
Many years ago, we purchased a home in Carlsbad, using a realtor that was recommended to us - Jim Klinge. Fast forward to 2025, we recently had the privilege of selling 2 homes in Carlsbad, CA and didn't hesitate to reach out to Jim and Donna Klinge of Klinge Realty Group to guide us through the sales. The transactions were very different, each with its own unique situation, opportunities and challenges. From start to finish, Donna and Jim helped navigate the pre-sale preparation, the listing, showing of the house, buyer negotiations, the final close and all of the paperwork and decisions in between. What stands out with both transactions is the professionalism of Jim and Donna (and their team), wonderful communication (timely, relevant, concise), their deep understanding of market dynamics (setting realistic expectations), their access to top-notch contractors, and last, their ability to guide us across the finish line successfully. We wouldn't hesitate to use Jim and Donna in the future and highly recommend them for anyone looking to buy or sell a property in North San Diego County.
Jerry Meyer
March 28, 2025
Trustindex verifies that the original source of the review is Google.
We sold a home with Jim and Donna and from beginning to end they were consummate professionals. Their initial walk through the property resulted in a list of items to be repaired or updated. They supplied a list of vendors and job quotes to do the repairs and updates. We originally wanted to sell ‘as is’ and just get it over with. They gave us a selling price for ‘as is’ and options for doing a few updates/repairs to doing it all with the selling price for each option. We agreed to do all they suggested and we sold for the exact price they predicted. For every dollar spent we got back more than $2 back in the selling price. And they got that price in a rising interest rate environment! Donna and Jim are extremely detailed and guide you through ever aspect of the sale. There were no surprises thanks to their guidance. We couldn’t be more pleased with their representation.
Thank you Donna and Jim,
Jerry and Mary
Heather Quejada
March 27, 2025
Trustindex verifies that the original source of the review is Google.
We have known Jim & Donna Klinge for over a dozen years, having met them in Carlsbad where our children went to the same school. As long time North County residents, it was a no- brainer for us to have the Klinges be our eyes and ears for San Diego real estate in general and North County in particular. As my military career caused our family to move all over the country and overseas to Asia, Europe and the Pacific, we trusted Jim and Donna to help keep our house in Carlsbad rented with reliable and respectful tenants for over 10 years.
Naturally, when the time came to sell our beloved Carlsbad home to pursue a rural lifestyle in retirement out of California, we could think of no better team to represent us than Jim and Donna. They immediately went to work to update our house built in 2004 to current-day standards and trends — in 2 short months they transformed it into a literal modern-day masterpiece. We trusted their judgement implicitly and followed 100% of their recommended changes. When our house finally came on the market, there was a blizzard of serious interest, we had multiple offers by the third day and it sold in just 5 days after a frenzied bidding war for 20% above our asking price! The investment we made in upgrades recommended by Jim and Donna yielded a 4-fold return, in the process setting a new high water mark for a house sold in our community.
In our view, there are no better real estate professionals in all of San Diego than Jim and Donna Klinge. Buying or selling, you must run and beg Jim and Donna Klinge to represent you! Our family will never forget Jim, Donna, and their whole team at Compass — we are forever grateful to them.
Lou F
March 27, 2025
Trustindex verifies that the original source of the review is Google.
WeI had the pleasure of working with Klinge Realty Group to sell our home in Carmel Valley, and I cannot recommend them highly enough!
Jim and Donna demonstrated exceptional professionalism, offering expert guidance on market conditions and pricing strategy, which resulted in a quick and successful sale.
Communication was prompt and we were well-informed throughout the entire process.
For anyone looking for a dedicated and knowledgeable real estate team, look no further!
---
William Sams
March 25, 2025
Trustindex verifies that the original source of the review is Google.
Donna and Jim Klinge of Klinge Realty Group have our highest possible recommendation. From Donna and Jim’s first visit to our house through closing their advice and counsel was candid and honest in all dealings. They kept us fully informed throughout the process. The house sold less than three days after listing with a two-week closing. My wife and I have sold several houses during our lives. This was by far the best experience. Klinge Reality is a premium service realtor. You can’t make a better choice for someone to sell your home fast and for top dollar.
Emily Hernandez
December 29, 2024
Trustindex verifies that the original source of the review is Google.
Donna and Jim provided exceptional support and professionalism throughout the entire process. We couldn't have been happier with their efforts. They made our house shine, and thanks to their expertise, it sold above the listing price in the very first weekend! Truly a fantastic experience from start to finish.
Jesus Adrian Sahagun
November 11, 2024
Trustindex verifies that the original source of the review is Google.
This year has been difficult on our family, mainly due to having to sell our home. Thankfully we knew God had a plan for us and working with the Klinge team was a key part of it. It was an obvious decision to work with them again after such an amazing experience when purchasing the same home we needed to sell. The challenge was, how will we do this in so little time with so much going on? Jim and Donna held our hand every step of the way. Whenever an unexpected issue arose they found and provided a solution. Never once did we feel pressured to make a decision and the Klinges were always reassuring after providing the information that the decision was ours to make. Despite the curve balls, they never panicked and exemplified the “can do” attitude, making us feel optimistic and taken care of. Their expertise and professionalism was superb. But of all the reasons to work with the Klinges, the most impactful and valuable is their compassion and genuine care for their clients. We pray that we can one day purchase our forever home and you better believe that Jim and Donna will be representing us - as long as they will have us of course. Thank you again Klinge team! Your execution, experience, and care are unmatched.
SABIHA PASHA
July 23, 2024
Trustindex verifies that the original source of the review is Google.
Jim and Donna were fantastic! Jim understanding my needs, recommending potential places, pointing out the pros and cons of each property was invaluable. Then when the offer was accepted Donna’s organized guidance through the inspections, paperwork etc made the whole process seem effortless.
So grateful that I had them on my side!