
Going into Thanksgiving. let’s summarize the current market conditions…….
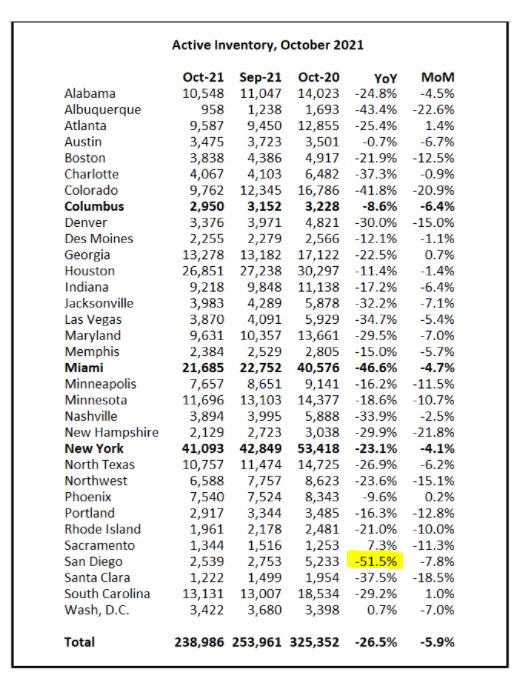
San Diego’s -51.5% (above) is still #1 on Bill’s list of local housing markets for the largest decline in active inventory in October. The active inventory reflects the velocity of new listings coming to market to replace those going pending every month.
When the active inventory is in decline, it means the supply isn’t keeping up with demand!
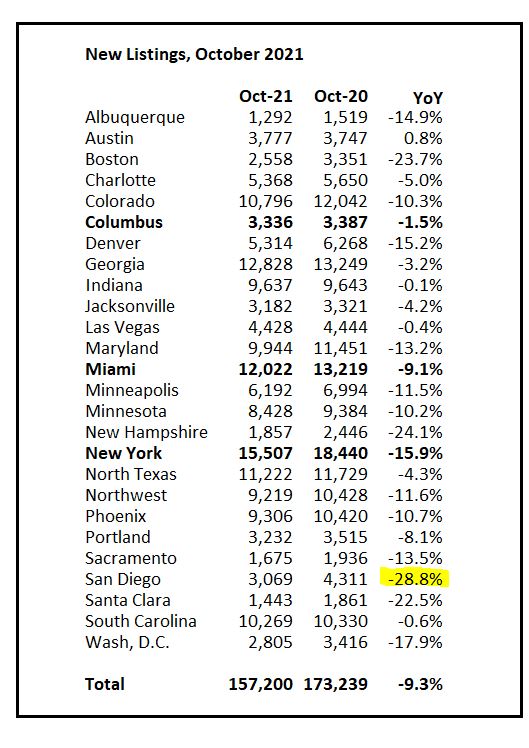
How do the raw number of October listings compare to last year?
San Diego’s decline is #1 again:
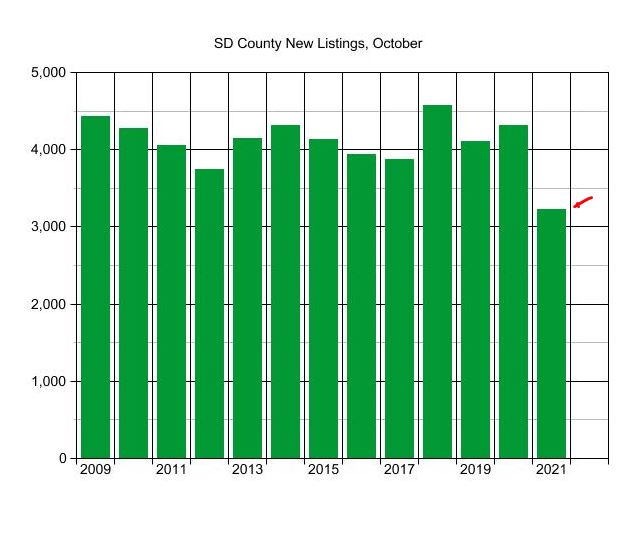
But how do those October listings compare to previous years? Wasn’t the end of 2020 the hottest market of all-time? It turns out that new-listings count last October looked a lot like the previous ones, and this year is the most unusual in recent memory:
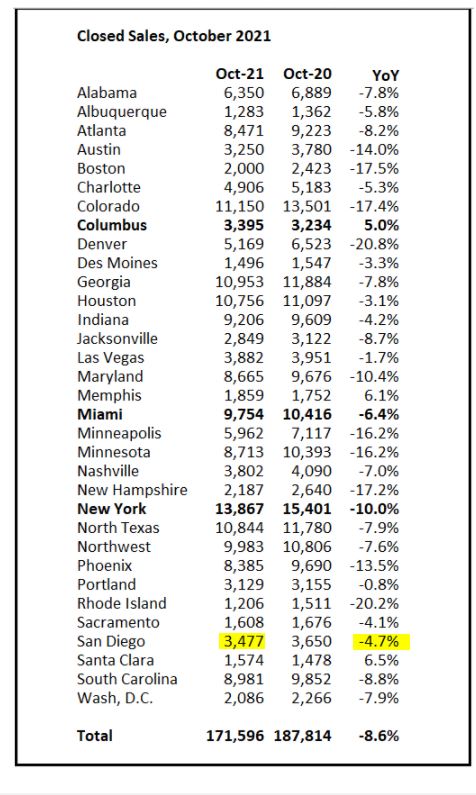
Yet sales have barely felt the dropoff of supply. The -4.7% YoY drop in sales is a flesh wound, relatively, when you consider that we had more sales than new listings:
Where do people go who have the money to live anywhere? San Diego!
Everybody wants to live here, and nobody wants to leave!
Our market should thrive for years, and could end up being the most expensive real estate in the country.


