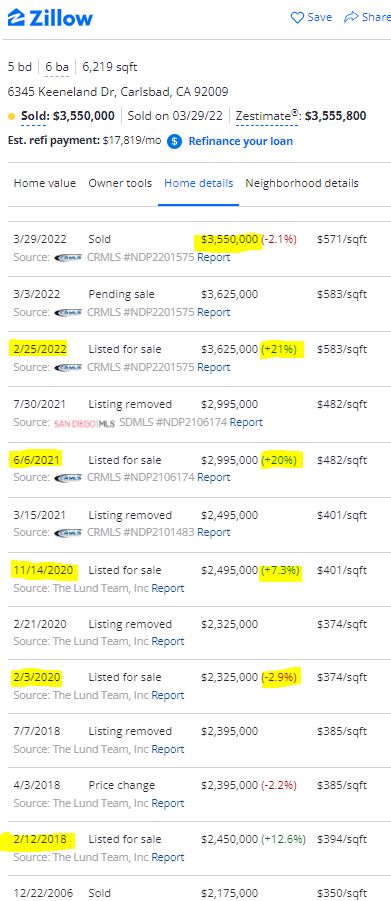
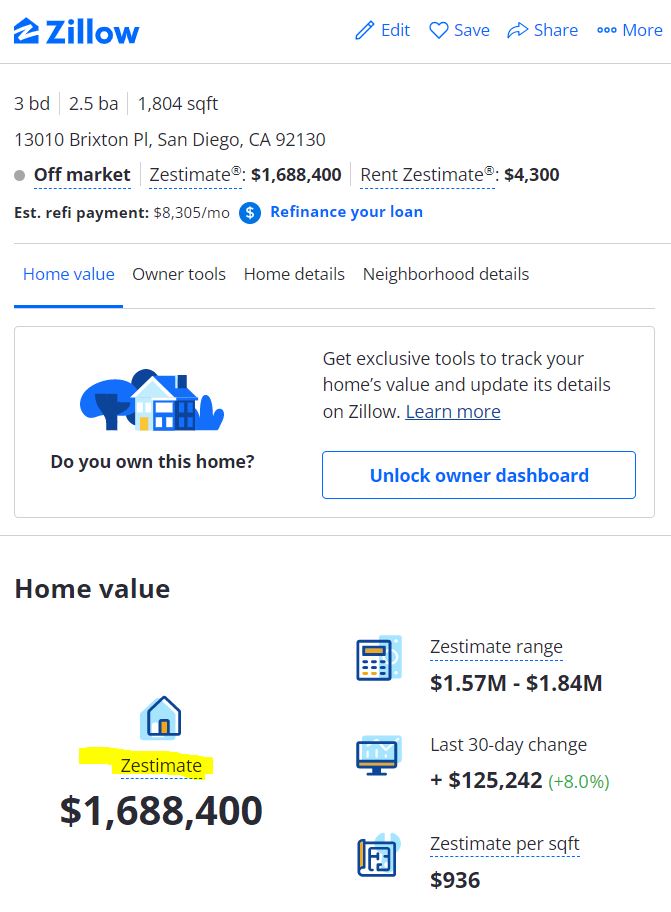
We joke about how sellers are reluctant about lowering their price, but it has been a solid strategy over the last 10-12 years. Here is a prime example (see above).
P.S. They had no showings last year, and decided the timing wasn’t right. Boy, howdy!
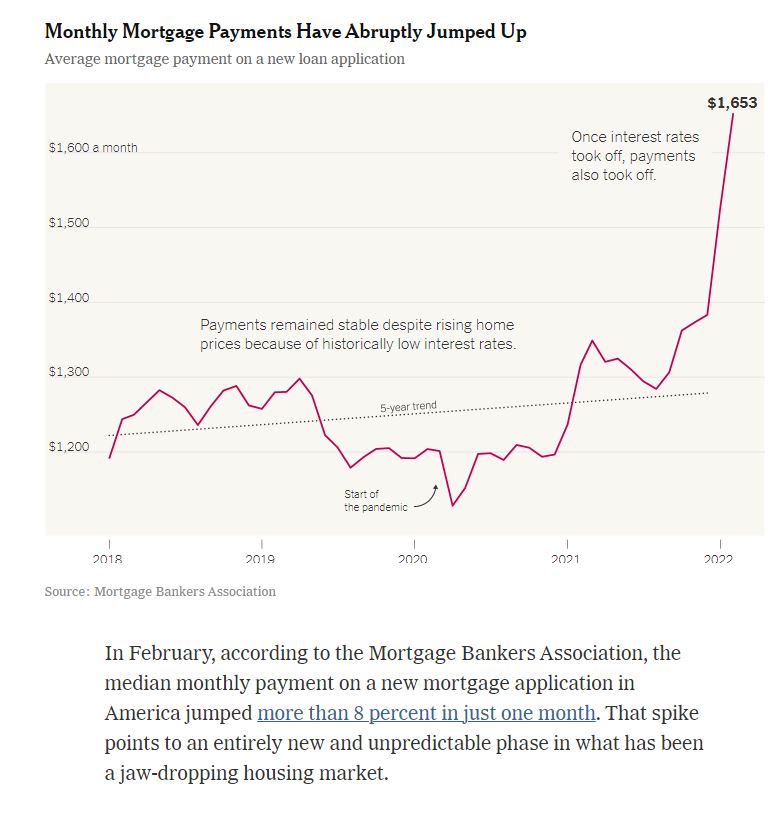
From yesterday’s article, which also ran in the SDUT today:
“There are so many strange things going on right now,” said Edward Seiler, the associate vice president for housing economics at the Mortgage Bankers Association.
It has been 40 years since rates have risen like this alongside similar home price growth and high inflation. This time around, the United States also has a severe housing shortage. And then there’s a new and uncertain dynamic — the sudden rise of working from home, which has the potential to change what home buyers want and where they live.
“Nobody really knows what’s going to happen over the next year,” Mr. Seiler said. That makes it hard to predict when rates might start to act as a brake on rising prices.
Nobody?
I have to take a swing at that one!
There are many variables that could slow the increases in home prices, and higher rates are just the latest excuse. Prognosticators said that last year’s velocity was the reason the home prices would cool in 2022 – no one could imagine that they could go up as fast as they did in 2021 – yet NSDCC the median sales price has INCREASED 21% BETWEEN DECEMBER AND MARCH!
But will rising rates be the final blow, and home prices start to decelerate?
Let’s try to predict the path of mortgage rates in 2022. How much worse could it get?
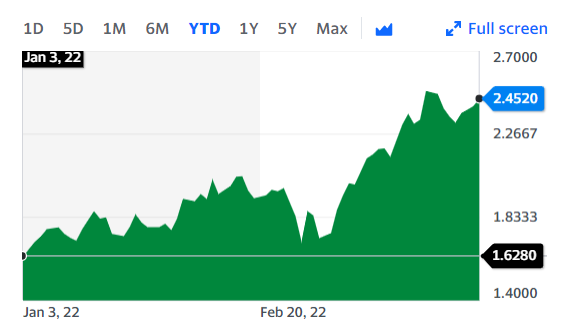
Mortgage rates are loosely tied to the 10-year T-bill, which has risen 0.824% this year:
The Fed is expected to raise their benchmark rate 1.5% this year (6 x 0.25%), so the 10-year yield has another 0.676% to go to reflect the anticipated 1.5% increase in 2022.
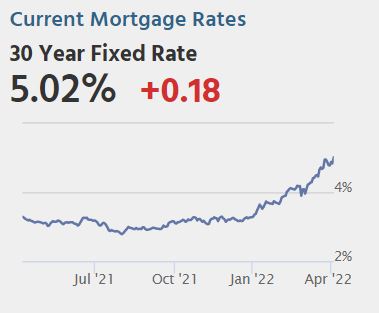
Mortgage rates have mirrored the 10-year, plus 1.75%, for decades.
Today’s 30-year fixed mortgage rate is 4.84% so let’s add the additional 0.676% = 5.516%. Because mortgage lenders are like gas stations – quick to overshoot rates on the way up, and sluggish on the way down – we will probably see 6% mortgages this summer as lenders continue to get out in front.
Let’s note that today’s 10-yr yield is 2.452% plus 1.75% = 4.202% which means today’s mortgage rate is about 0.6% overshot too high.
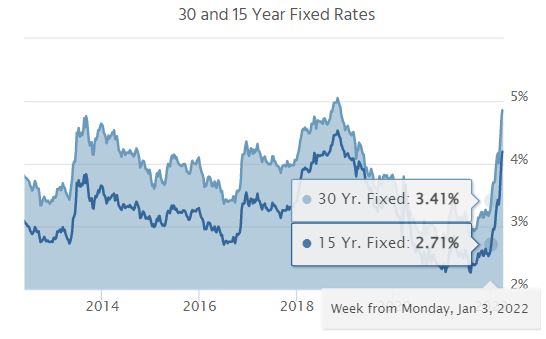
To further demonstrate the current mortgage-rate overshoot, here was the rate on January 3rd:
The 10-year has gone up 0.824% YTD, and mortgage rates have risen 1.43% YTD.
We are due for pullback, but the mortgage lenders will more likely just let it ride, knowing that more Fed increases are coming. They will panic (again) and mortgage rates will probably be touching 6% in a couple of months, but we should settle into a range of 4.75% to 5.5% by the end of the year – which isn’t much different than it is today. It coincides with the January’s 3.41% plus 1.5% = 4.91%.
Will higher rates than today affect home prices? It depends on the sellers – they get a vote.
If relatively nobody wants to sell at these prices, they sure won’t want to sell at lower prices! Rather than lowering the price, they will blame their realtor for their home not selling, and try again next year.
They’re not going to give it away!
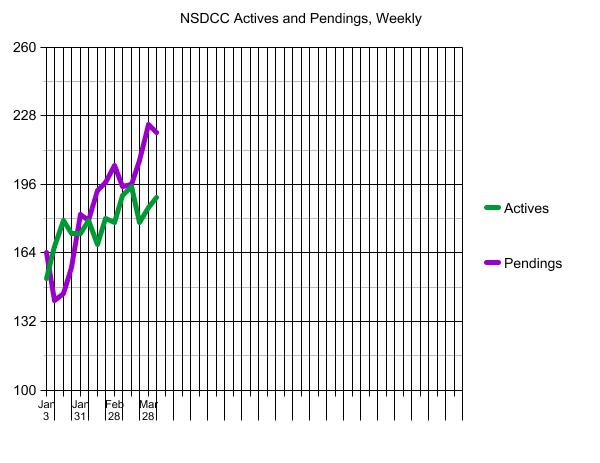
There isn’t going to be a surge on inventory, because it would have happened by now. But I’m sure there are buyers running to the sidelines in droves, wanting to believe it’s going to be different, later. There will be fewer offers on homes for sale, and some may not get any! All we have to do is monitor the two metrics, the days-on-market, and the actives vs pendings, to know the trend.
But there are additional variables that will keep prices in this range:
The affluent buyers who aren’t as affected by rates. As long as we don’t run out of them, home prices will stay right where they are, or keep trending upward.
All buyers, affluent or otherwise, will buy the dips. There will be an occasional home priced under the comps (usually the dated estate sales) and buyers will jump to pay less. But they will get bid up to within 5% of retail and create the floor.
Buyers who are affected by higher rates can get a 2.375% ARM, fixed for ten years.
Realtors will keep pumping the seller’s market because it’s all they know.
We are pulling into Plateau City.
Even if the buyer psychology crashes, and only the desperate buyers stay in the game for the next few months, we can easily predict what will happen in the second half of 2022. Because both sellers and buyers who didn’t transact in the first half of 2022 will pack it in for the rest of the year, sales will plummet in the last half of 2022. It’s what happens in the early stage of a market shift, because sellers can’t believe they missed the peak and would rather wait, then lower. It will takes several failures before sellers re-consider their price accuracy – and some never will.
The NSDCC median sales price in December was $2,165,000. In March, it was $2,625,000.
I expect that the December, 2022 median sales price will be within 5% of $2,625,000 (plus or minus).
Then in 2023, the market will be flooded with lookers, who will be hoping for lower prices than what they remember from summer. But sellers will be packing a little extra on their price, just in case.
What do you think?
Before commenting, spend 15 seconds to watch this response to a ~$3 million off-market listing:
It is natural to have more closings during the last week of the month, and the dip in the pendings count wasn’t as bad this month as it was last month. This is where you will see the first signs of any concern on behalf of buyers about interest rates, etc.
Everyone was talking about them at open house over the weekend. But we’re still going to sell my listing for well over the list price today!
The 2022 inventory is off to a slow start – and I don’t expect it to improve much, in spite of record pricing:
Year
# of 1Q Listings
Median List Price
2018
1,230
$1,592,500
2019
1,277
$1,575,000
2020
1,082
$1,712,500
2021
985
$1,899,000
2022
682
$2,575,000
The 682 listings this year was 31% lower than in the first quarter of last year, and about half of what we had prior to the pandemic. No wonder that the median list price was 36% higher, year-over-year!
Well, the way it’s been going, it was bound to happen!
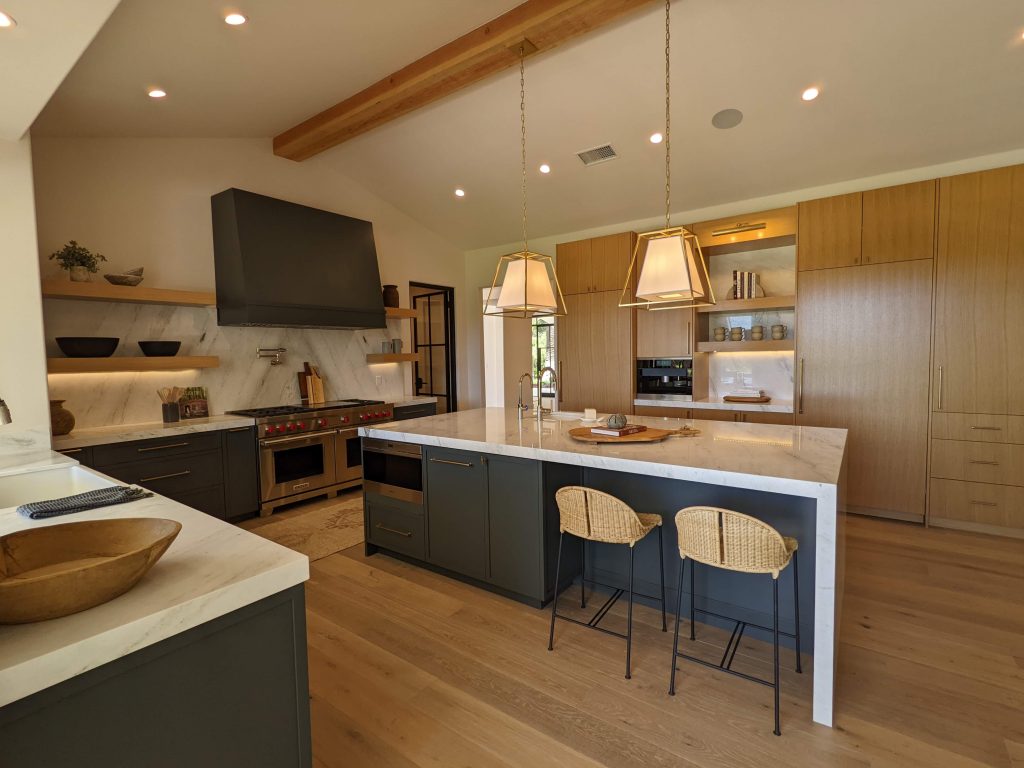
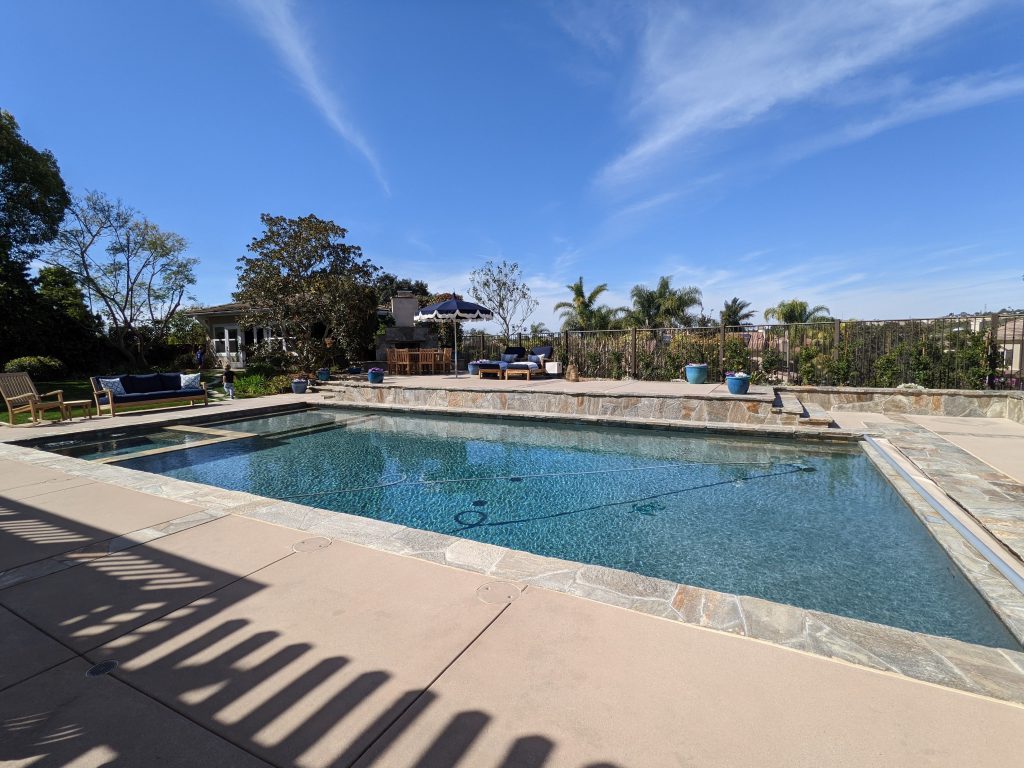
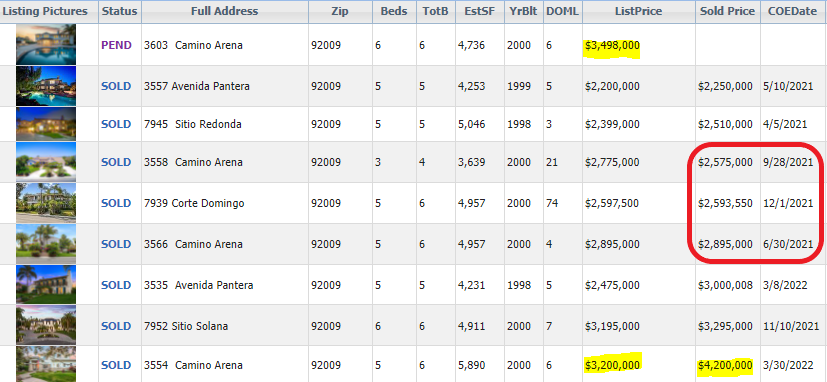
At least this house was fully remodeled, had a guest house (with double-tap kegerator!) and large pool all laid out nicely on a half-acre lot in the Ranch. This is the one I featured previously with the dozens of attendees at the open houses.
Here are the comps for the neighborhood – what was a trend in the upper-$2,000,000s in the second half of 2021 sure popped up in a hurry to $4 million+. The pending sale had “several offers and is way over list”, according to the listing agent:
It can’t be said strongly enough how important the visual impact is to selling houses in the Frenzy of 2022.
The action is so fast, and with major life-changing decisions being made in minutes, that it is smart for sellers to take advantage and maximize the appeal before going on the open market. You have to sell the buyers online, then again when they arrive in person, and then clinch it when they go home and look at it again online. Photos AND videos are the ideal answer!
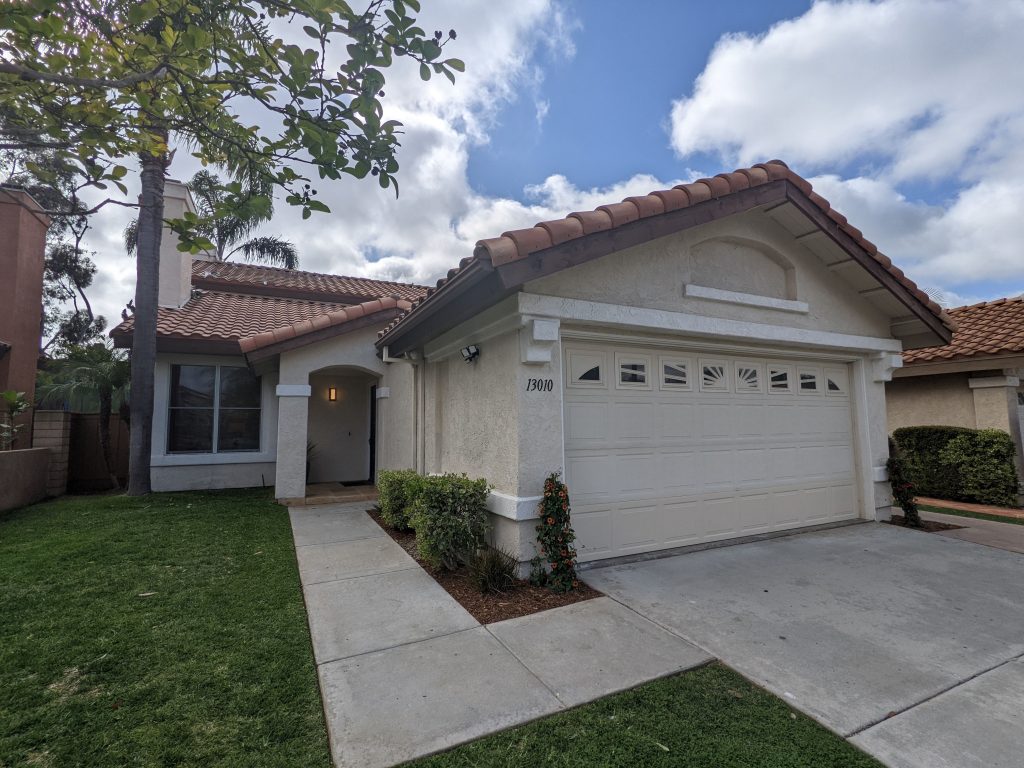
Here are the before-and-after photos of our latest listing:
If you are thinking of selling, consider that the combining our tune-ups with my open-bidding process is the best way to ensure a top-dollar sale! Let’s discuss it! Call or text me today at 858-997-3801.
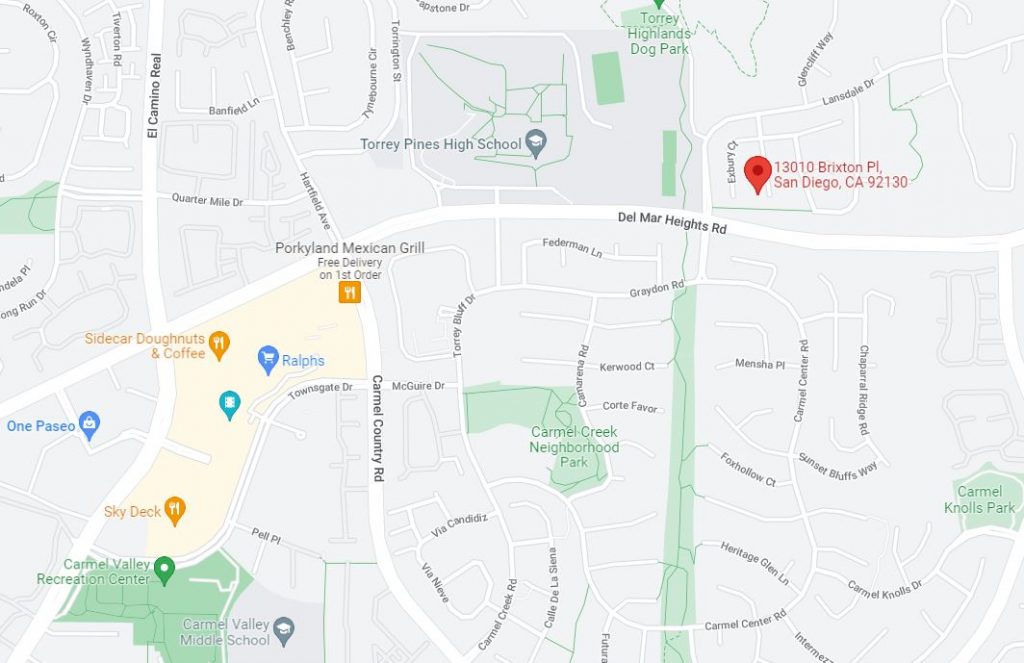
Location is everything! Enjoy this end-of-culdesac gem that is just steps from Torrey Pines High School (so close you won’t need to buy your kid a car!) and an easy stroll to Del Mar Highlands & One Paseo! Totally renovated with newer kitchen & baths, Pella Pro-line designer wood windows, new paint & carpet, new light fixtures, and new landscaping! No rentback needed at closing either – just bring your toothbrush and move right in! Wow!
I’ll be there 12-3pm this weekend for open house – stop on by!
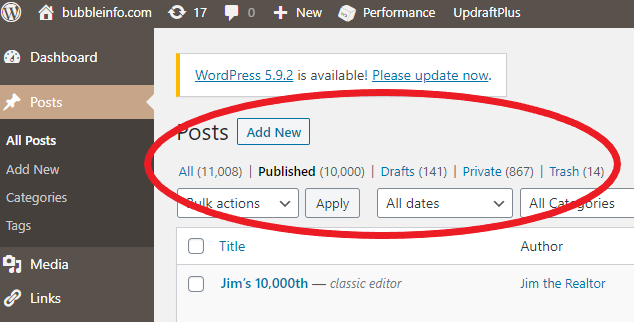
P.S. This is my 10,000th blog post!
The consumers’ fascination with the zestimates has never been greater! With home prices detached from comps, the zestimate is the only other measuring stick for both buyers or sellers – right or wrong!
Trustindex verifies that the original source of the review is Google.
Jim & Donna Klinge helped us sell our home of 30 years in Ocean Hills. We were very happy with their service and would HIGHLY recommend them to anyone looking for an Honest, Knowledgeable, Skilled, Informed Efficient realty team. Both Jim & Donna were so helpful in different ways and complemented each others skills. Please refer to a more detailed review that we wrote on YELP. Thank You Both for all your help!!!
Jesse O'Hara
June 12, 2025
Trustindex verifies that the original source of the review is Google.
A+ thank you
Lisa Tuomi
June 11, 2025
Trustindex verifies that the original source of the review is Google.
Many years ago, we purchased a home in Carlsbad, using a realtor that was recommended to us - Jim Klinge. Fast forward to 2025, we recently had the privilege of selling 2 homes in Carlsbad, CA and didn't hesitate to reach out to Jim and Donna Klinge of Klinge Realty Group to guide us through the sales. The transactions were very different, each with its own unique situation, opportunities and challenges. From start to finish, Donna and Jim helped navigate the pre-sale preparation, the listing, showing of the house, buyer negotiations, the final close and all of the paperwork and decisions in between. What stands out with both transactions is the professionalism of Jim and Donna (and their team), wonderful communication (timely, relevant, concise), their deep understanding of market dynamics (setting realistic expectations), their access to top-notch contractors, and last, their ability to guide us across the finish line successfully. We wouldn't hesitate to use Jim and Donna in the future and highly recommend them for anyone looking to buy or sell a property in North San Diego County.
Jerry Meyer
March 28, 2025
Trustindex verifies that the original source of the review is Google.
We sold a home with Jim and Donna and from beginning to end they were consummate professionals. Their initial walk through the property resulted in a list of items to be repaired or updated. They supplied a list of vendors and job quotes to do the repairs and updates. We originally wanted to sell ‘as is’ and just get it over with. They gave us a selling price for ‘as is’ and options for doing a few updates/repairs to doing it all with the selling price for each option. We agreed to do all they suggested and we sold for the exact price they predicted. For every dollar spent we got back more than $2 back in the selling price. And they got that price in a rising interest rate environment! Donna and Jim are extremely detailed and guide you through ever aspect of the sale. There were no surprises thanks to their guidance. We couldn’t be more pleased with their representation.
Thank you Donna and Jim,
Jerry and Mary
Heather Quejada
March 27, 2025
Trustindex verifies that the original source of the review is Google.
We have known Jim & Donna Klinge for over a dozen years, having met them in Carlsbad where our children went to the same school. As long time North County residents, it was a no- brainer for us to have the Klinges be our eyes and ears for San Diego real estate in general and North County in particular. As my military career caused our family to move all over the country and overseas to Asia, Europe and the Pacific, we trusted Jim and Donna to help keep our house in Carlsbad rented with reliable and respectful tenants for over 10 years.
Naturally, when the time came to sell our beloved Carlsbad home to pursue a rural lifestyle in retirement out of California, we could think of no better team to represent us than Jim and Donna. They immediately went to work to update our house built in 2004 to current-day standards and trends — in 2 short months they transformed it into a literal modern-day masterpiece. We trusted their judgement implicitly and followed 100% of their recommended changes. When our house finally came on the market, there was a blizzard of serious interest, we had multiple offers by the third day and it sold in just 5 days after a frenzied bidding war for 20% above our asking price! The investment we made in upgrades recommended by Jim and Donna yielded a 4-fold return, in the process setting a new high water mark for a house sold in our community.
In our view, there are no better real estate professionals in all of San Diego than Jim and Donna Klinge. Buying or selling, you must run and beg Jim and Donna Klinge to represent you! Our family will never forget Jim, Donna, and their whole team at Compass — we are forever grateful to them.
Lou F
March 27, 2025
Trustindex verifies that the original source of the review is Google.
WeI had the pleasure of working with Klinge Realty Group to sell our home in Carmel Valley, and I cannot recommend them highly enough!
Jim and Donna demonstrated exceptional professionalism, offering expert guidance on market conditions and pricing strategy, which resulted in a quick and successful sale.
Communication was prompt and we were well-informed throughout the entire process.
For anyone looking for a dedicated and knowledgeable real estate team, look no further!
---
William Sams
March 25, 2025
Trustindex verifies that the original source of the review is Google.
Donna and Jim Klinge of Klinge Realty Group have our highest possible recommendation. From Donna and Jim’s first visit to our house through closing their advice and counsel was candid and honest in all dealings. They kept us fully informed throughout the process. The house sold less than three days after listing with a two-week closing. My wife and I have sold several houses during our lives. This was by far the best experience. Klinge Reality is a premium service realtor. You can’t make a better choice for someone to sell your home fast and for top dollar.
Emily Hernandez
December 29, 2024
Trustindex verifies that the original source of the review is Google.
Donna and Jim provided exceptional support and professionalism throughout the entire process. We couldn't have been happier with their efforts. They made our house shine, and thanks to their expertise, it sold above the listing price in the very first weekend! Truly a fantastic experience from start to finish.
Jesus Adrian Sahagun
November 11, 2024
Trustindex verifies that the original source of the review is Google.
This year has been difficult on our family, mainly due to having to sell our home. Thankfully we knew God had a plan for us and working with the Klinge team was a key part of it. It was an obvious decision to work with them again after such an amazing experience when purchasing the same home we needed to sell. The challenge was, how will we do this in so little time with so much going on? Jim and Donna held our hand every step of the way. Whenever an unexpected issue arose they found and provided a solution. Never once did we feel pressured to make a decision and the Klinges were always reassuring after providing the information that the decision was ours to make. Despite the curve balls, they never panicked and exemplified the “can do” attitude, making us feel optimistic and taken care of. Their expertise and professionalism was superb. But of all the reasons to work with the Klinges, the most impactful and valuable is their compassion and genuine care for their clients. We pray that we can one day purchase our forever home and you better believe that Jim and Donna will be representing us - as long as they will have us of course. Thank you again Klinge team! Your execution, experience, and care are unmatched.
SABIHA PASHA
July 23, 2024
Trustindex verifies that the original source of the review is Google.
Jim and Donna were fantastic! Jim understanding my needs, recommending potential places, pointing out the pros and cons of each property was invaluable. Then when the offer was accepted Donna’s organized guidance through the inspections, paperwork etc made the whole process seem effortless.
So grateful that I had them on my side!