Second Time Over $4,000,000
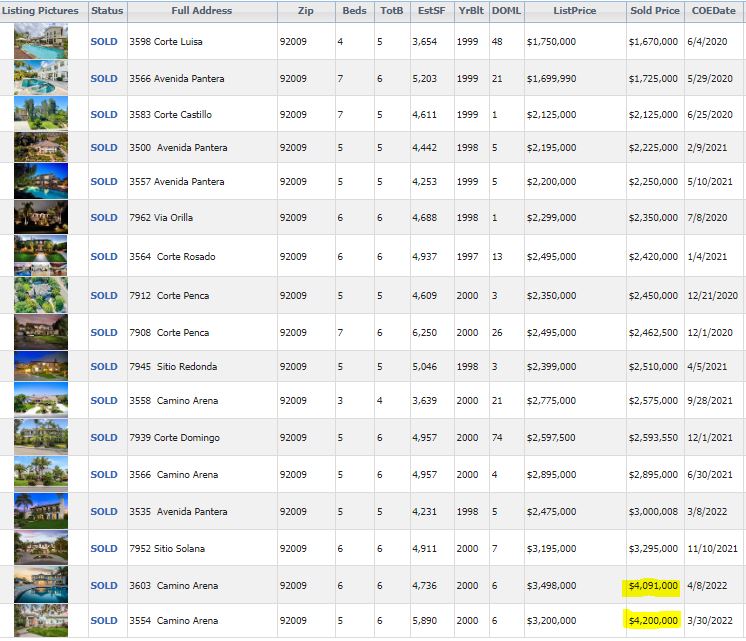
In the last 24 months, there were two sales of $1,670,000 and $1,725,000 in the Ranch of Carlsbad. In the last 12 months, there have been three sales in the $2,500,000s.
Now there are two sales closed over $4,000,000!

In the last 24 months, there were two sales of $1,670,000 and $1,725,000 in the Ranch of Carlsbad. In the last 12 months, there have been three sales in the $2,500,000s.
Now there are two sales closed over $4,000,000!
I think we can say that the statistics are starting to reflect the current environment, which is being muddled by a few factors:
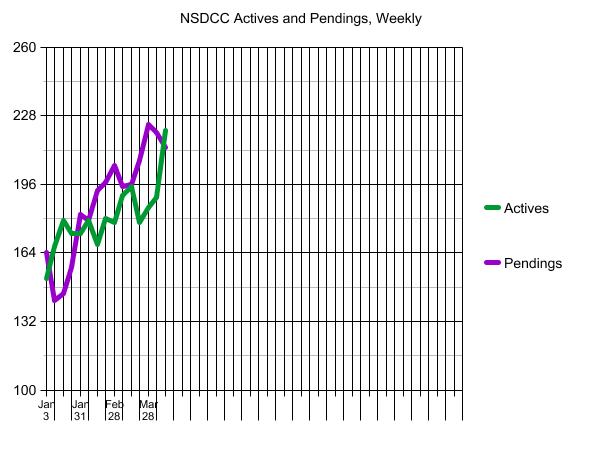
This is the first time during the selling season that there are more actives than pendings (221 vs 213). If it ever gets back to the normal 2:1 ratio, it’s going to feel like the sky is falling!
It is rare that a seller decides to sell and then lists their home for sale the same day. Usually, it’s a plan that has been in the works for months, and any last-minute adjustments – especially on price – are also rare. Don’t be surprised if the pricing over the next two months reflects the pricing of the last two months.
~~~~~~~~~~~~~~~~~~~~~~~~~~~~~~~~~~~
A fantastic spin on higher mortgage rates by two economists – an excerpt:
Mark Fleming – That’s a great question, Odeta. And when we subtract the core CPI inflation rate from the 30-year, fixed mortgage rate, we find that, with air quotes here, mortgage rates are actually negative.
Odeta Kushi – Say what now? Here we’re talking about rates as high as 5%. And now you’re telling me rates are negative?
Mark Fleming – Yep, over the last half century, there have only been two other times when core inflation was higher than the 30-year, fixed mortgage rate. Both of those were in the 1970s.
Today, we’re experiencing the extremely rare phenomenon of real, negative mortgage rates. So, while we may expect rising mortgage rates to cool the market, real estate still looks cheap, given the high inflation, not to mention the appreciation benefits that people get from the stellar asset returns that we’ve experienced recently.
Okay, thinking like a finance guy for a hot minute here. If the price of everything is rising faster than the price of borrowing at a fixed rate, aka the negative real rate of mortgages, to own an asset that’s appreciating in value. Hmmm.
Odeta Kushi – Yeah, so a significant slowdown in purchase demand due to rising mortgage rates is not necessarily a foregone conclusion, not to mention that house prices, and even sales to a lesser extent, have shown to be pretty resilient in the face of rising mortgage rates. You can refer to our podcast episode 15, if you want to know more about this.
But the SparkNotes version is in four of the last six rising mortgage rate eras, the existing-home sales increased or only declined after prolonged resistance. Home prices show even more resiliency.
Apart from the 1994 rising-rate period when house prices declined slightly and briefly, house prices have always continued to rise, albeit more slowly, when rates have increased. That’s because home sellers would rather withdraw from the market, rather than sell at lower prices, a phenomenon we refer to as ‘downside sticky.’
Of course, relative rates matter and mortgage rates have been in the 2-to-3% range during most of the pandemic. So, rising to about 4% may have a larger impact than in the earlier periods. So, it’s unclear how much rising rates will cool the purchase market. But, how would rising rates cool the housing market anyway? By reducing affordability, of course, and causing buyers to pull back from the market. In other words, by cooling demand.
Read/listen to the entire podcast here:
~~~~~~~~~~~~~~~~~~~~~~~~~~~~~~~~~~~~~~~~
JtR: Let’s note that the highly-financed buyers don’t get much of a vote because in the bidding wars over quality properties, they are sent to the back of the line. The ‘cooling demand’ from financed buyers pulling back only means fewer offers. The market’s direction will be determined by the cash buyers, and/or the big-down-payment buyers who will shrug off higher payments when they hear a catchy buzz word like ‘negative mortgage rates’. The location/condition of the home will matter more to the sales price than rates.
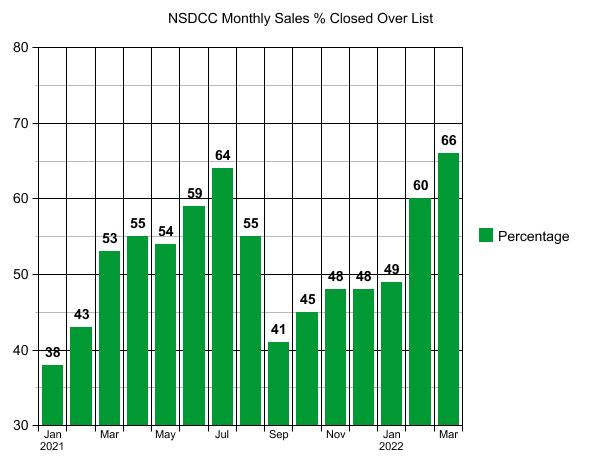
The percentages of sales closed over the list price are higher than in 2021, but will it continue?
NSDCC Monthly Detached-Home Sales, % Closed Over List Price
~~~~~~~~~~~~~~~~~~~~~~~~~~~~~~~~~~~~~~~~~~~~~~~
 ~~~~~~~~~~~~~~~~~~~~~~~~~~~~~~~~~~~~~~~~~~~~~~~
NSDCC Average and Median Prices
| Month | |||||
| Feb | |||||
| March | |||||
| April | |||||
| May | |||||
| June | |||||
| July | |||||
| Aug | |||||
| Sept | |||||
| Oct | |||||
| Nov | |||||
| Dec | |||||
| Jan | |||||
| Feb | |||||
| Mar |
The average sales price went up 7% MoM in January, 9% in February, and 8% in March!
The median sales price went up 4% MoM in January, 7% in February, and 10% in March!
THE MEDIAN SALES PRICE IN MARCH WAS 25% HIGHER THAN IT WAS IN NOVEMBER!
This is the craziest real estate market ever!!
~~~~~~~~~~~~~~~~~~~~~~~~~~~~~~~~~~~~~~
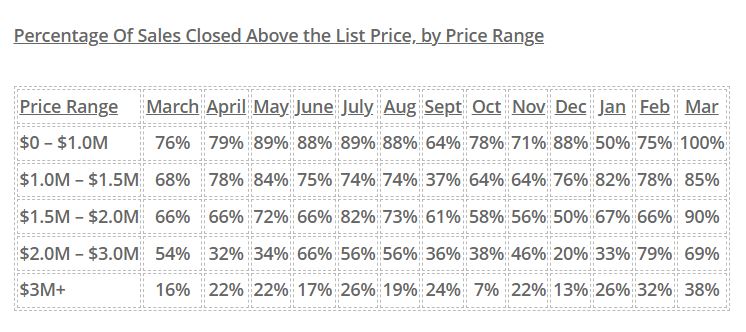
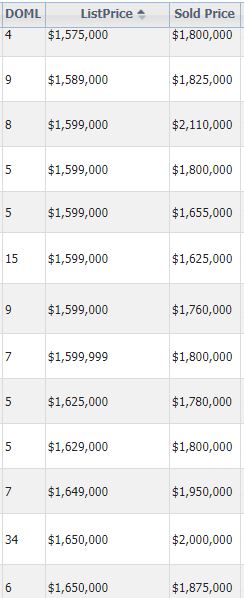
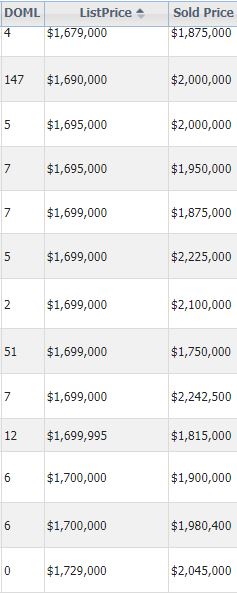
The $1,500,000 – $2,000,000 was the hottest range in March, with 90% of sales closing over the list price.
Here are examples – the average here was 12% over the list price:
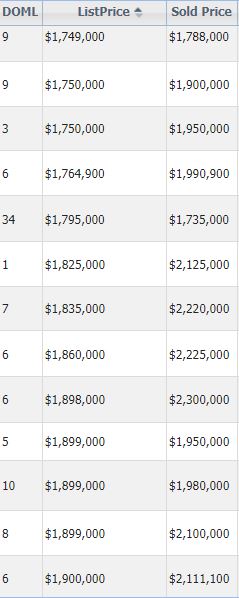
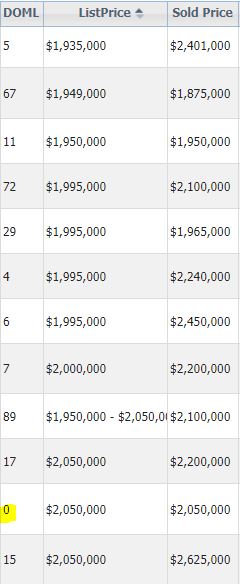
There were foundation repairs here too:
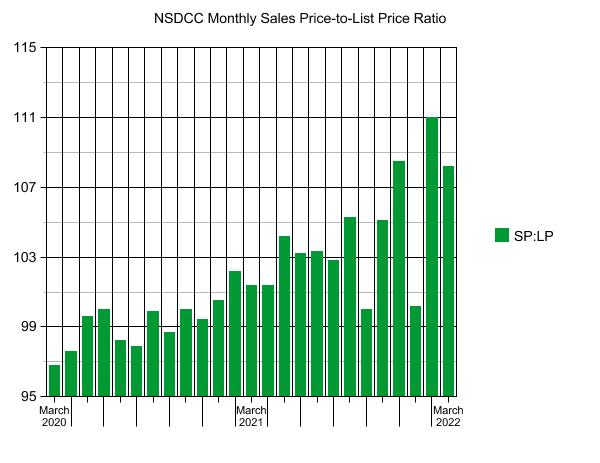
Let’s take a look at the covid history of one of our frenzy measuring sticks:
NSDCC Sales-Price-to-List-Price Ratio:
| Month | ||||
| March 2020 | ||||
| Apr | ||||
| May | ||||
| Jun | ||||
| Jul | ||||
| Aug | ||||
| Sep | ||||
| Oct | ||||
| Nov | ||||
| Dec | ||||
| Jan | ||||
| Feb | ||||
| March 2021 | ||||
| Apr | ||||
| May | ||||
| Jun | ||||
| Jul | ||||
| Aug | ||||
| Sep | ||||
| Oct | ||||
| Nov | ||||
| Dec | ||||
| Jan | ||||
| Feb | ||||
| March 2022 |
The chatter increases with the lower volume, plus there are going to be months when the offerings just aren’t that tasty. But in 2022, when buyers see a home they like, they over bid substantially!
All we have to do is watch the trend over the next few months to know the direction of the market.
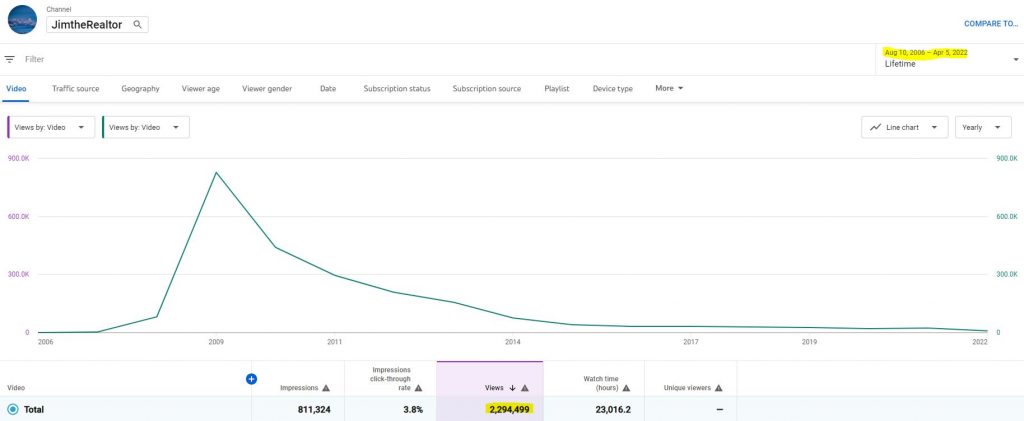
I’ve been fortunate to get almost 2.3 million YouTube views (1/3 of them in 2009!) over the last 15+ years.
Our daughter Natalie’s video got over 8 million views in less than a week!
She is the one in white with a blue streak in her hair – right in front between the 3:00 and 3:22-min mark:
A good value in a sweet spot next to Fairbanks Ranch:
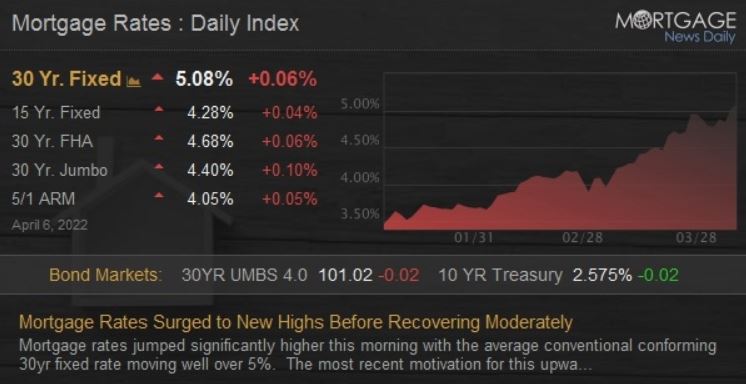
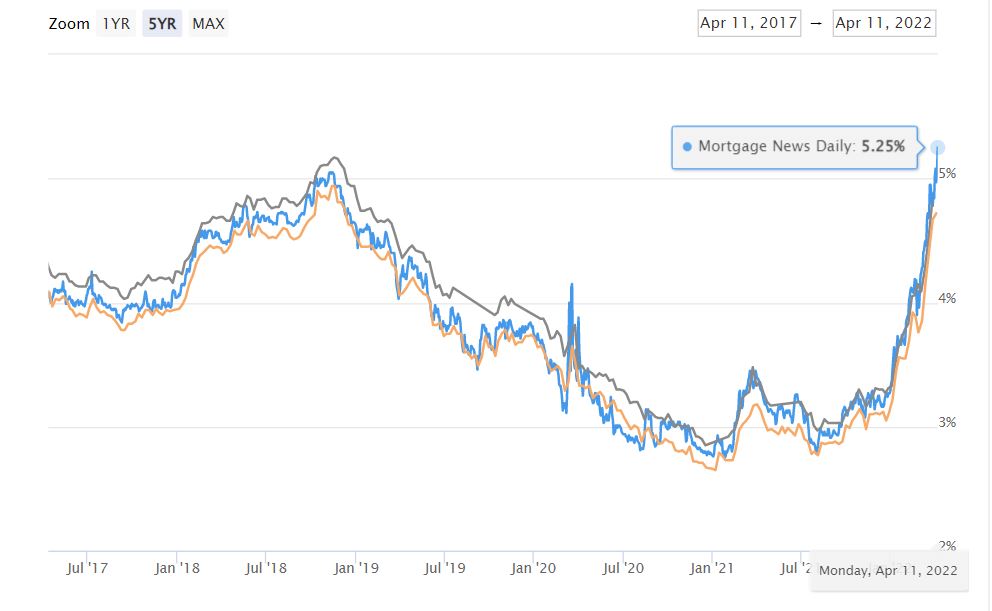
You can’t spend too much time reading/watching the news recently without being well aware of the relatively unprecedented surge in mortgage rates seen so far in 2022. In particular, the month of March was one the worst on record with one individual week in March tying a week in June 2013 as the worst in more than 25 years. All that to say, rates are much higher!
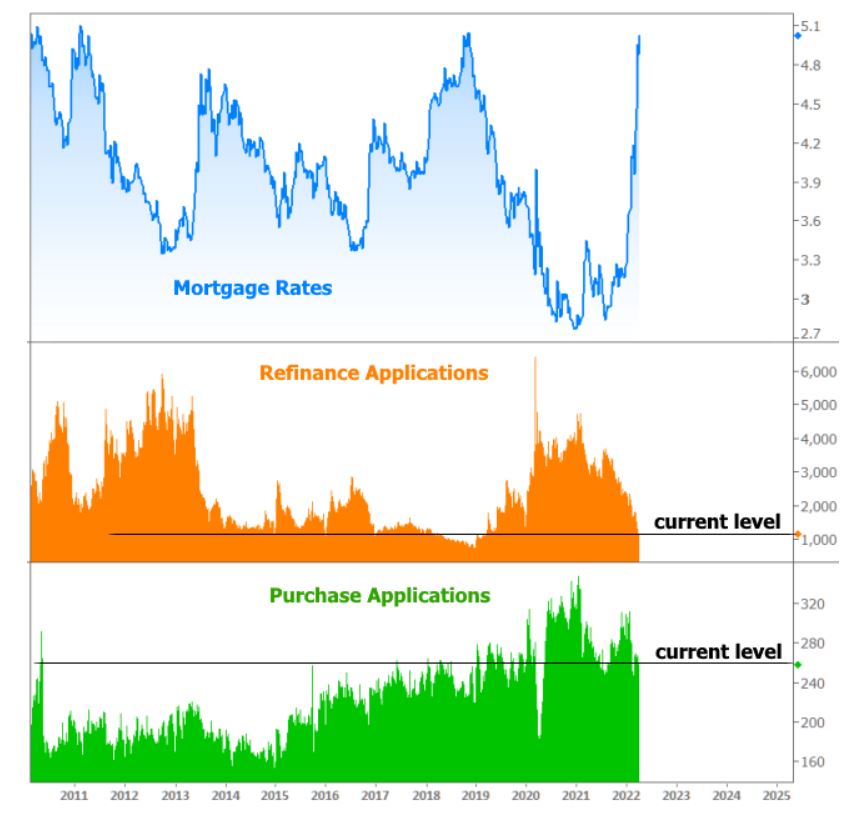
The higher borrowing costs have had the same impact they always have when it comes to refinance applications. In this week’s Mortgage Application Survey from the Mortgage Bankers Association (MBA), refis dropped another 10 percent, and are now 62 percent lower than the same week last year.
The purchase market remains a different story.
While purchase applications also declined last week, they are only 9 percent below the same week last year and still higher than most of the past decade before the Covid. Keep in mind that the survey only tracks applications, so by the time all-cash demand is factored into the purchase market, housing demand has yet to show any major panic over the rising rate environment.
https://www.mortgagenewsdaily.com/news/04062022-mba-applications-purchase-refi-refinance
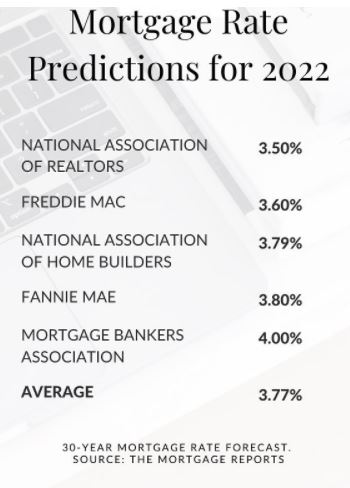
Now that we are grappling with 5% mortgage rates, people are wondering how it will affect the market.
The common perception is that there will be pullback.
What that means isn’t defined – it’s just a vague concept that the logical mind wants to believe. But logic flew out the window long ago, so I’m not sure how useful it is today. Prices went up 30% in 2021 and it didn’t stop, or even slow the market in the first quarter of 2022.
Does it matter what the opinion is today?
Not really, and you can refer to the chart above to see how much opinions matter.
All that matters is that we track the trends over the next few months to see what actually happens!
Yesterday I said all we have to do is monitor the days-on-market, and the actives vs pendings to get advance notice on how the market is behaving. Let’s add a third metric, the SP:LP ratio.
Who are the home buyers that will determine our fate? When out-of-towners from more affluent areas come here to see our prices, they think we are giving them away. There have been estimates that as many as 70% of the coastal sales here have been bought by people from the Bay Area.
We should keep an eye on their market!
I’m watching one sale in progress there. My uncle has been a lifelong resident, and my mom, brother and sister all live there so I have opportunity to check in on their real estate market from time to time.
In December, we went to pay our respects to Sally, my uncle’s long-time girlfriend. They met later in life and had separate houses, and unfortunately Sally passed away from cancer just before Christmas.
We had a brief conversation with her sisters who were from outside California, and they expected that they would sell her home in early 2022. The zestimate was in the mid-$2,000,000s, and they said they would be happy with a price in that range.
After painting and staging the relatively modest 1,763sf house built in 1953, they listed it for $3,195,000. It went pending within ten days – and since then the zestimate has zoomed to $3,800,000!
https://www.zillow.com/homedetails/1200-Brucito-Ave-Los-Altos-CA-94024/19620416_zpid/
The house is five doors away from the Foothill Expressway, which isn’t a freeway but there is some road noise. The 9,975sf lot size is attractive, and the house is one-story. But low-to-mid $3,000,000s?
Even more interesting was the house at 1051 Peninsular Ct. When we were there, I saw the sign and drove by to confirm that it was literally right next to the Foothill Expressway. It closed for $3,100,000!
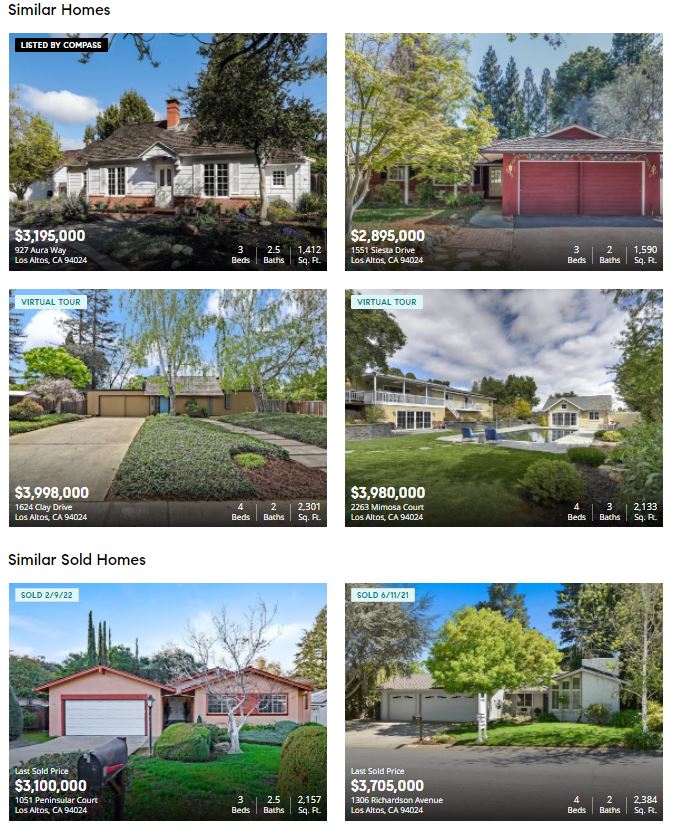
The pricing in the Bay Area is subject to change, just like it is here – but it should be somewhat relative, and we will likely ride the same elevator. The 1Q22 pricing spiked in Los Altos, and the sisters – who only expected a sales price in the mid-$2,000,000s – will pick up a lucky windfall.
The 2022 Lucky Windfall of the First Quarter doesn’t have to continue throughout the year for our market to thrive. If pricing “crashes” downward 10% to 20% from today’s lofty heights, it means we’re only back to November pricing, which you would think wouldn’t bother sellers much.
But it will.
Do not underestimate the home seller’s ego.
It doesn’t mean you should, or shouldn’t, go buy a house today. If you are a home buyer in the hunt, just be picky (or pickier) about what you will tolerate. The list prices will feel like TodayComps+5%, the sellers are doing less to condition them for sale, and the listing agents act like you owe them money.
There is one guarantee. The inventory later in the year will be worse than it is today. It could feel like pricing is loosening up (it’s not yet), especially in the 4th quarter of 2022, but it won’t matter if there aren’t any homes for sale that you would buy. Be in the hunt for the right house!
I will keep track of the winners and losers. Help me if you can!
Here is today’s winner, who had 11 showings and three offers. Tanya raised the list price to a range, which makes it look like it probably went over $3,000,000:
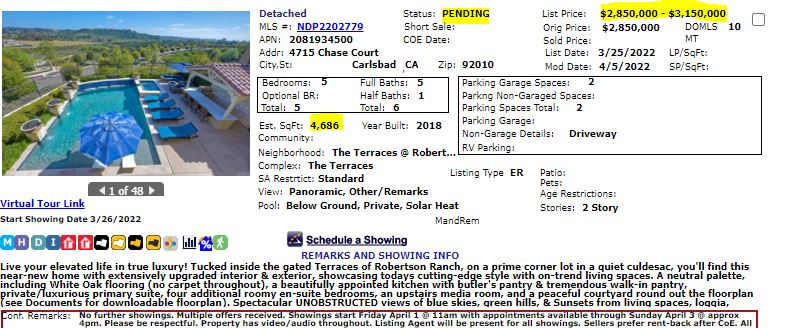
It may seem crazy to you, but those coming from Los Altos will think it looks like a steal!


