
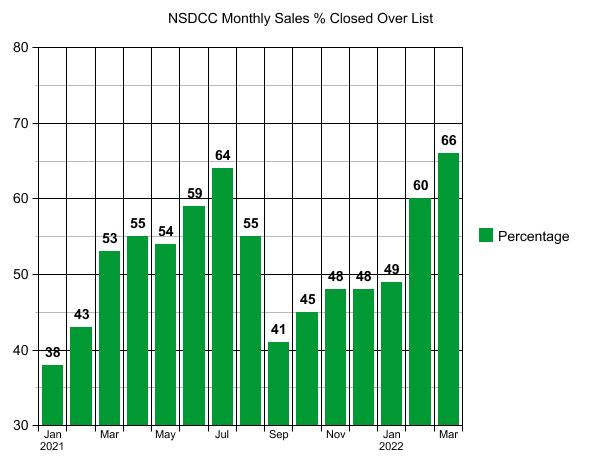
The percentages of sales closed over the list price are higher than in 2021, but will it continue?
NSDCC Monthly Detached-Home Sales, % Closed Over List Price
~~~~~~~~~~~~~~~~~~~~~~~~~~~~~~~~~~~~~~~~~~~~~~~
 ~~~~~~~~~~~~~~~~~~~~~~~~~~~~~~~~~~~~~~~~~~~~~~~
NSDCC Average and Median Prices
| Month | |||||
| Feb | |||||
| March | |||||
| April | |||||
| May | |||||
| June | |||||
| July | |||||
| Aug | |||||
| Sept | |||||
| Oct | |||||
| Nov | |||||
| Dec | |||||
| Jan | |||||
| Feb | |||||
| Mar |
The average sales price went up 7% MoM in January, 9% in February, and 8% in March!
The median sales price went up 4% MoM in January, 7% in February, and 10% in March!
THE MEDIAN SALES PRICE IN MARCH WAS 25% HIGHER THAN IT WAS IN NOVEMBER!
This is the craziest real estate market ever!!
~~~~~~~~~~~~~~~~~~~~~~~~~~~~~~~~~~~~~~
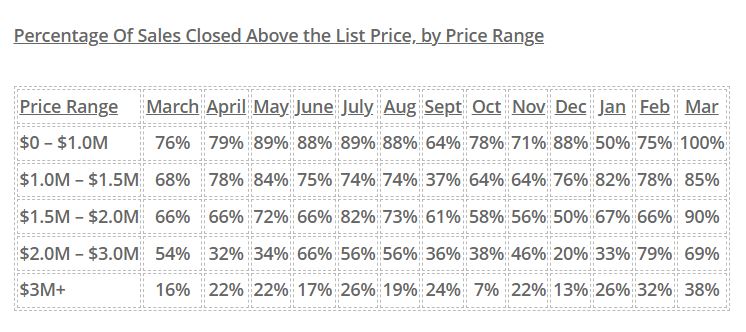
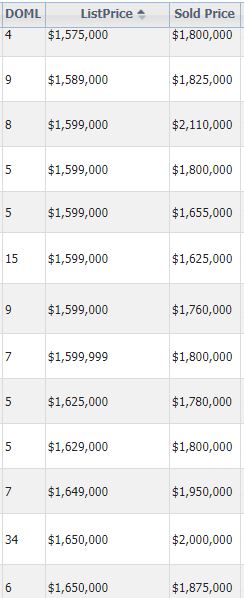
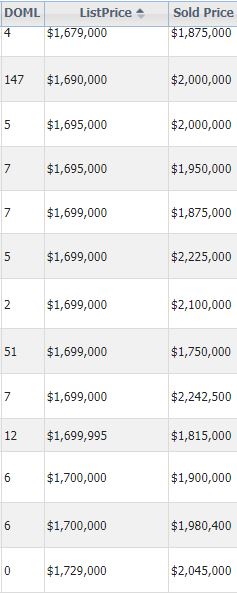
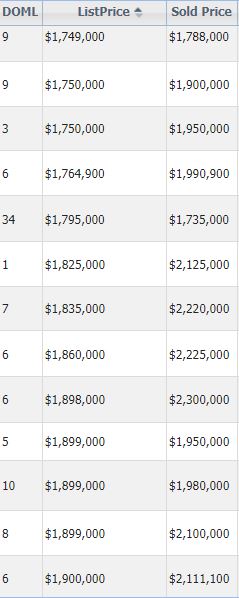
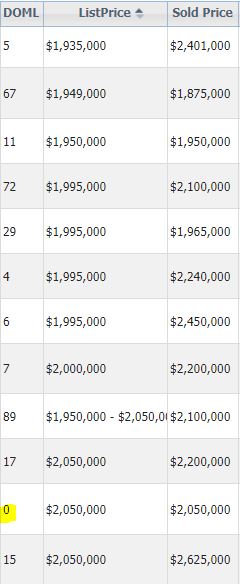
The $1,500,000 – $2,000,000 was the hottest range in March, with 90% of sales closing over the list price.
Here are examples – the average here was 12% over the list price:


Marky Mark put his shack up for sale – with photos:
https://www.dirt.com/gallery/entertainers/actors/mark-wahlberg-asks-87-million-for-grand-beverly-park-mega-mansion-1203478300/wahl14/
In both Los Angeles and Orange County, the number of homebuyers who applied for a mortgage dropped 18% year over year in February, and in both San Francisco and San Diego the drop was 13%.
Boston (-7%) Seattle (-5%), and Washington, D.C. (-3%) were among the other pricey coastal metros with year-over-year declines in mortgage applications.
(it’s ok, we have enough buyers already)