The 3,743sf active listing across the street has been listed for sale at $2,350,000 since June 10th – but still unsold. Next door to it was a 4,398sf sale that closed on June 21st for $2,385,000 (it was a rental and needed work). It was on the market for 28 days before they found their buyer.
We are at the end of summer and while my 4,000sf listing is spectacular, we didn’t want to risk joining the other 17 houses for sale between $2 million and $3 million in this zip code that have an average market time of 34 days – they are starting to stack up! This is my logical reasoning to predict a price that will work. I’d like to help you too – my phone is 858-997-3801.
~~~~~~~~~~~~~~~~~~~~~~~~~~~~~~~~~~~~~~~~~~
To demonstrate the quirkiness in the marketplace, there was also a guy who came by the open house said, “I’d buy this house if it weren’t for the power lines”:
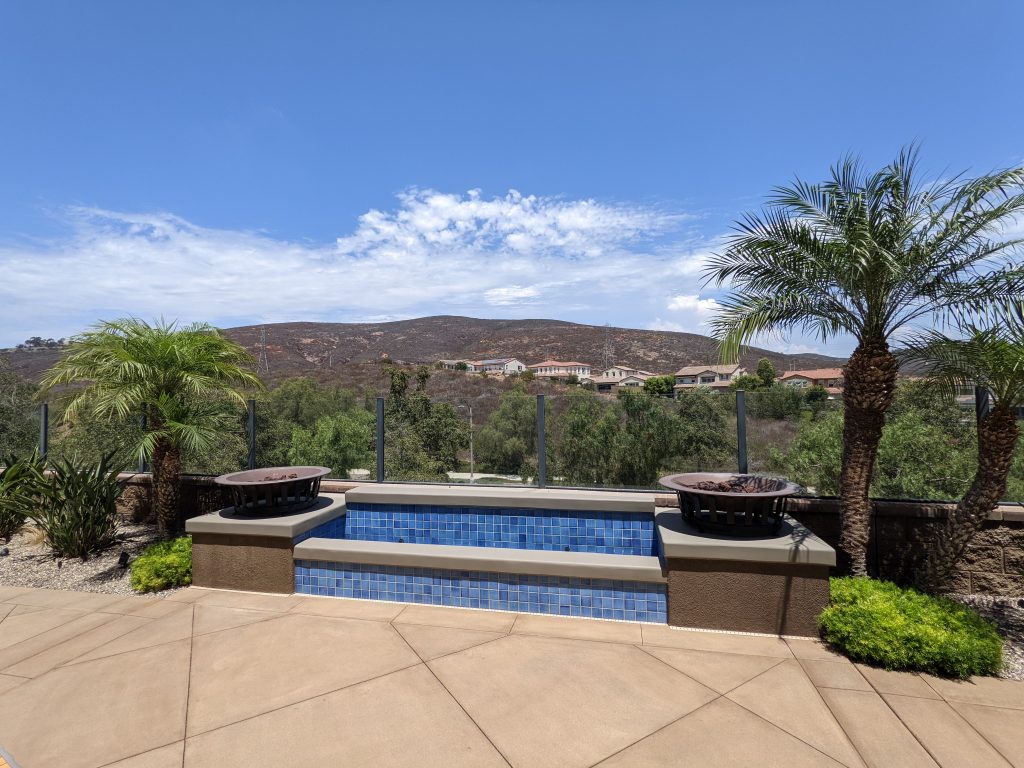
They are at least a 1/4 mile away and beyond the houses in this photo. To me, they blend into the landscape, but if any power lines are a deal-killer or you’re just looking for any reason NOT to buy, then…..
Now that buyers are being more cautious, we’ve seen how important it is now for sellers to spruce up their home and list for an attractive price. A third component is to not think that there are two in the bush that are going to offer hundreds of thousands over the list price – it’s already been priced in.
We received an offer on our new listing on Friday, and went ahead with open house to give any motivated buyers a chance to check it out. If you’re motivated (i.e., willing to pay at least full price), you’ll come to the first open house.
Here’s what happened:
When your ship comes in, don’t be at the train station!
Thank you Natalie for correcting me on yesterday’s blog post – the second half of 2022 is well under way! Sales won’t drop to zero over the next five months because people need to buy and sell, and hopefully all will be more diligent about the process and who they hire.
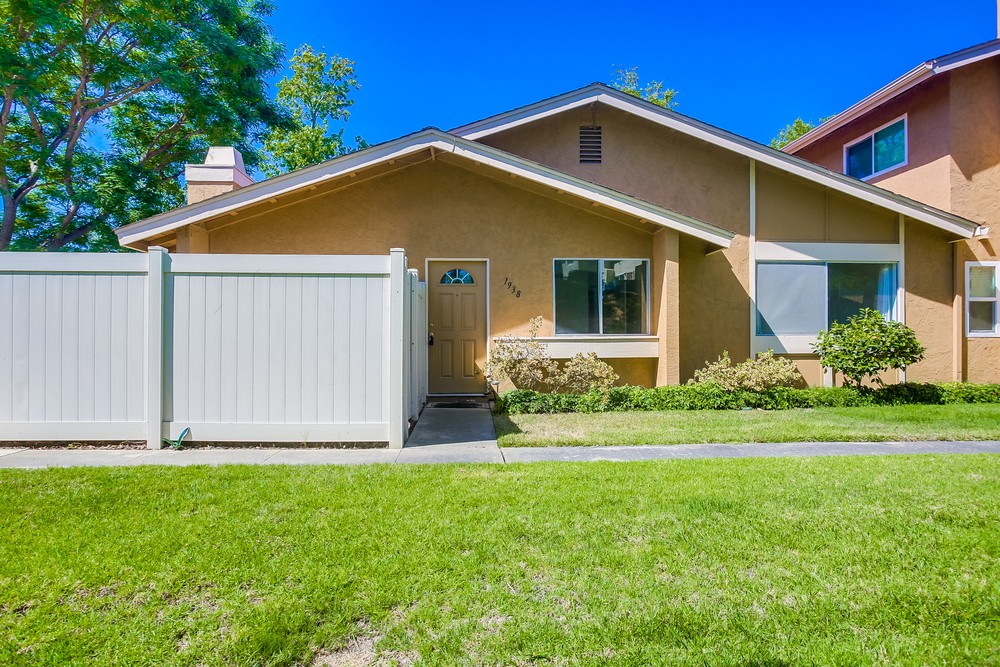
Here’s the story/ad-copy about our listing on Park Dale in Encinitas:
There haven’t been many Village Park condos on the market this year, so when our clients thought about selling theirs, they talked to a few agents to get quotes. One was $675,000!
So when they heard Jim say ‘mid-$800,000s’, it piqued their interest – why so much higher? Because we knew that a minor tune-up (cost of $15,000) would elevate the property into the preferred category of Move-In Ready and maximize the number of buyers.
We listed for $849,000, and sold it for $841,000 with a 21-day escrow!
The seller did not know us previously – here’s what he said about the experience:
You performed pure magic in selling our Encinitas condo near list price as we are potentially on the verge of severe economic times. Throughout the selling experience, we have appreciated your professionalism, considerable knowledge and experience in selling real property. It was a smooth and largely stress-free experience. We will certainly refer any friends to you who are considering selling their property.
Are you thinking of moving? We’d love to help you too!
The media, especially social media, is a negative influence.
There is game-changing commotion within the industry.
Let’s tackle these and other topics as we get closer to 2023 – I’ve created a new blog-post category today conveniently entitled, ‘2023’ at the top of this page.
~~~~~~~~~~~~~~~~~~~~~~~~~~~~~~~~~~~~~~~~~~
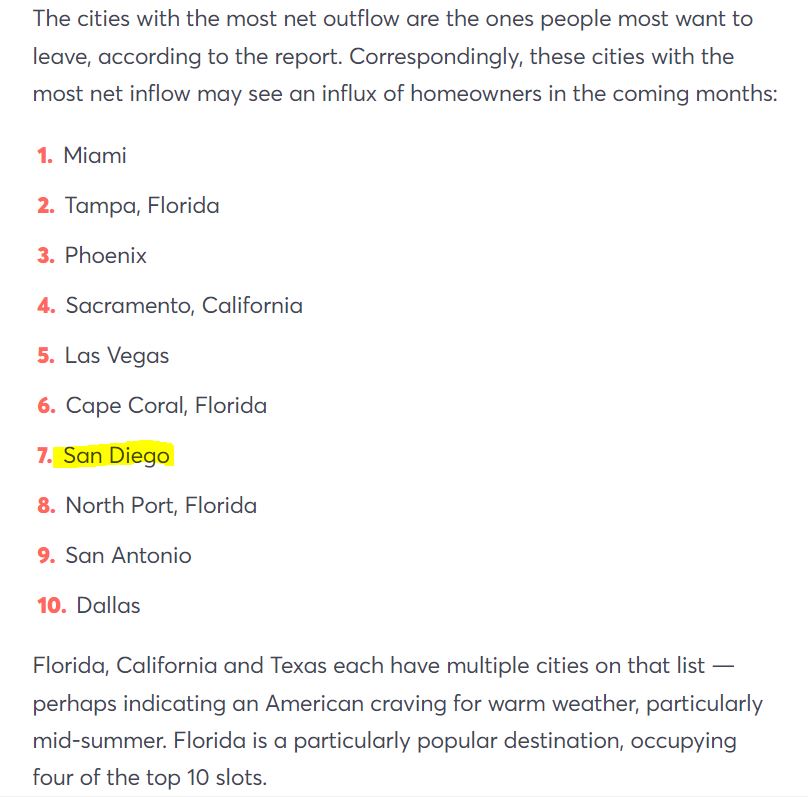
The article below confirms that:
San Diego is NOT in the Top 10 places that people want to leave,
Half of the places people are leaving are more expensive than here, and
We ARE in the Top 10 destinations of where people want to move:
If you were an affluent downsizer looking at those ten choices, which would you select? It also means that the North San Diego County coastal market will probably be dependent upon those buyers coming from more-expensive areas – and that those markets continue to hold up there.
We will find a way to survive the next six months, and by the 2023 Selling Season we should see a healthy increase in supply and demand. The worst thing that will happen is that pricing might be lower, which buyers won’t mind.
Get Good Help!
~~~~~~~~~~~~~~~~~~~~~~~~~~~~~~~~~~~~~~~~~~
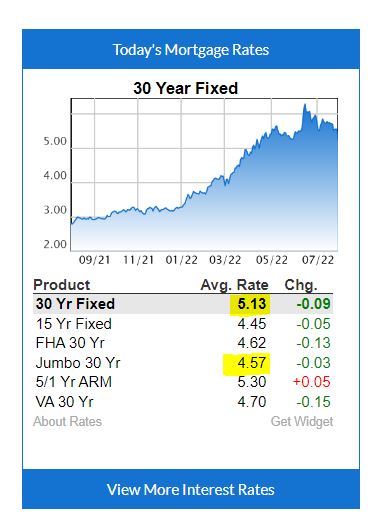
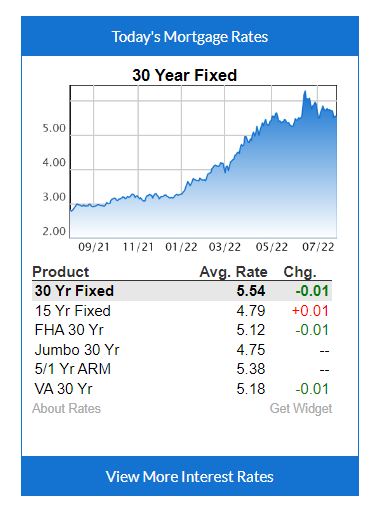
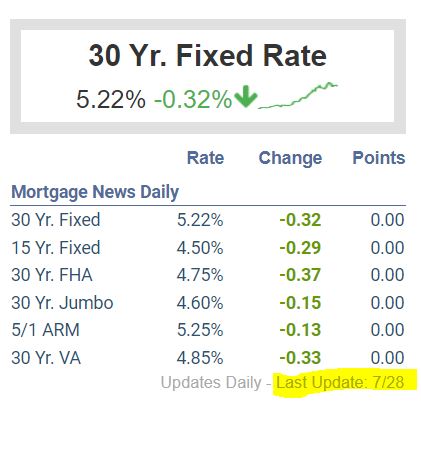
Another good day for rates – from midday Friday, July 29th:
Yes the -0.01% isn’t much, but didn’t every casual observer think mortgage rates were going to rise again? That we were heading for 6% or 7% or 8%?
Everyone is going to get used to mortgage rates in the 5s, and by springtime this will all settle down and we’ll get back to a relatively normal market again.
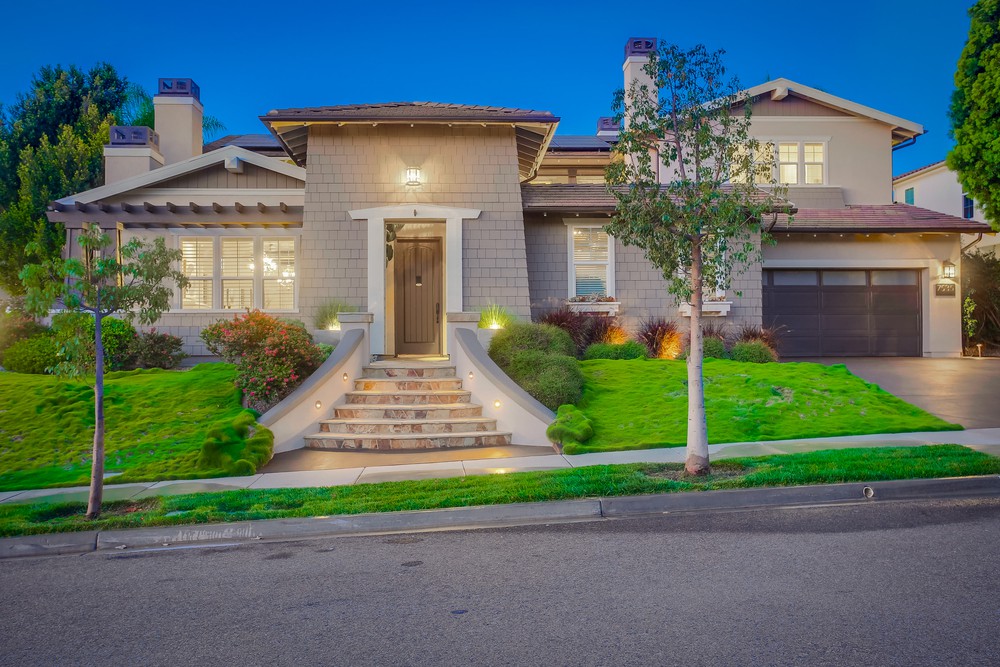
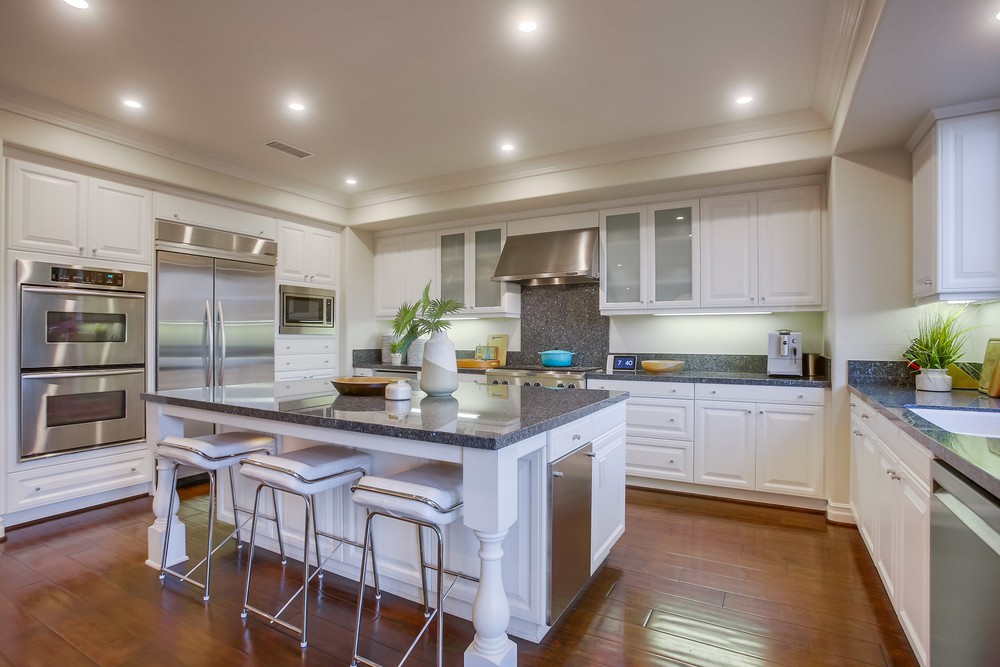
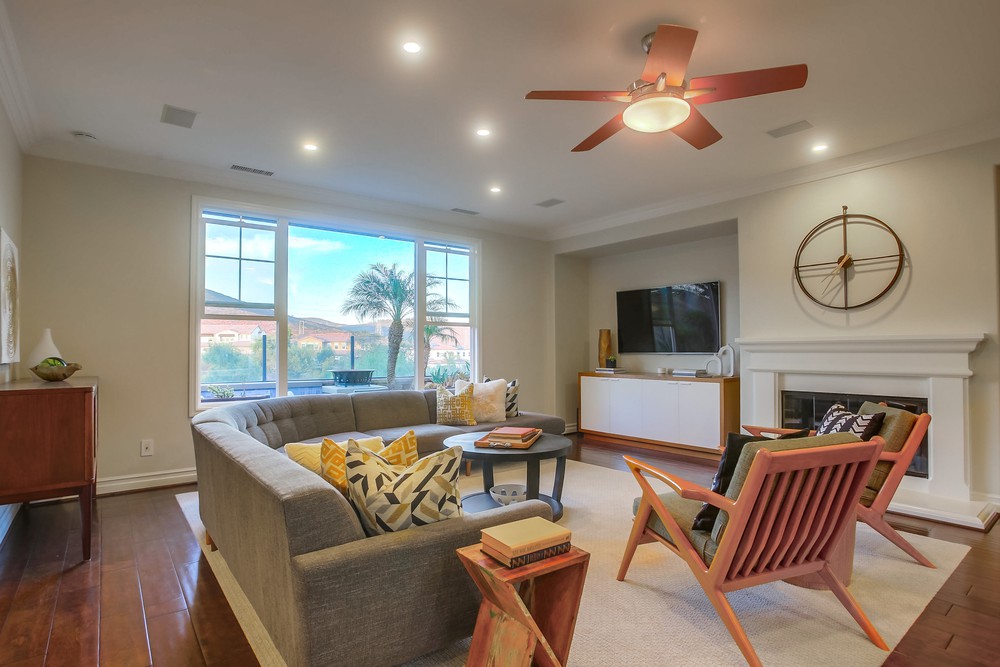
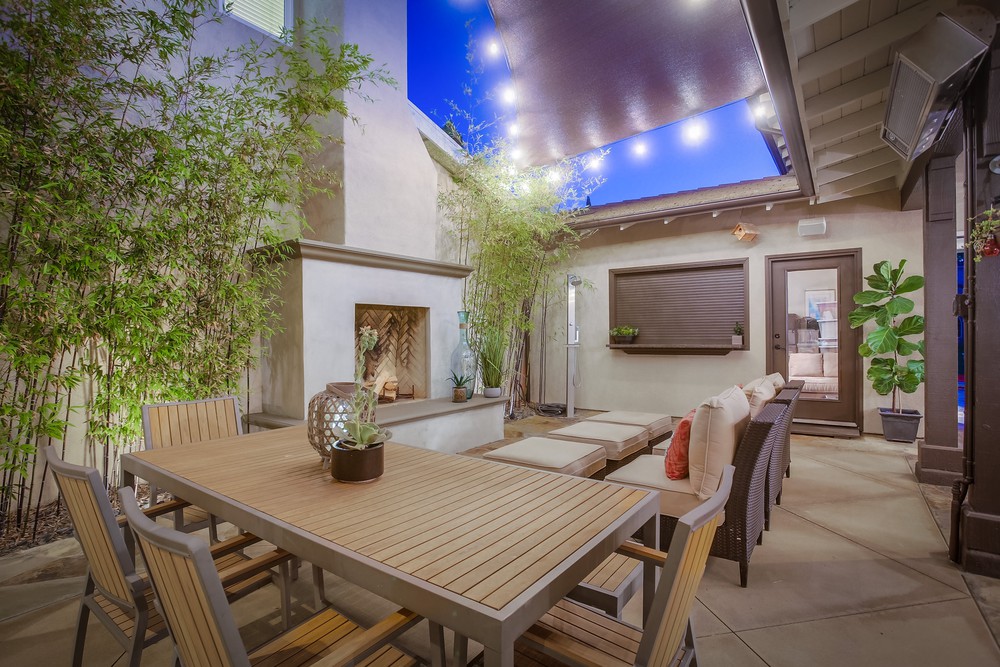
We just sold our listing in Davidson’s Starboard neighborhood of La Costa Oaks!
7535 Circulo Sequoia, Carlsbad
5 br/3.5 ba, 4,0000sf
YB: 2005
SP = $2,250,000 – we represented the sellers.
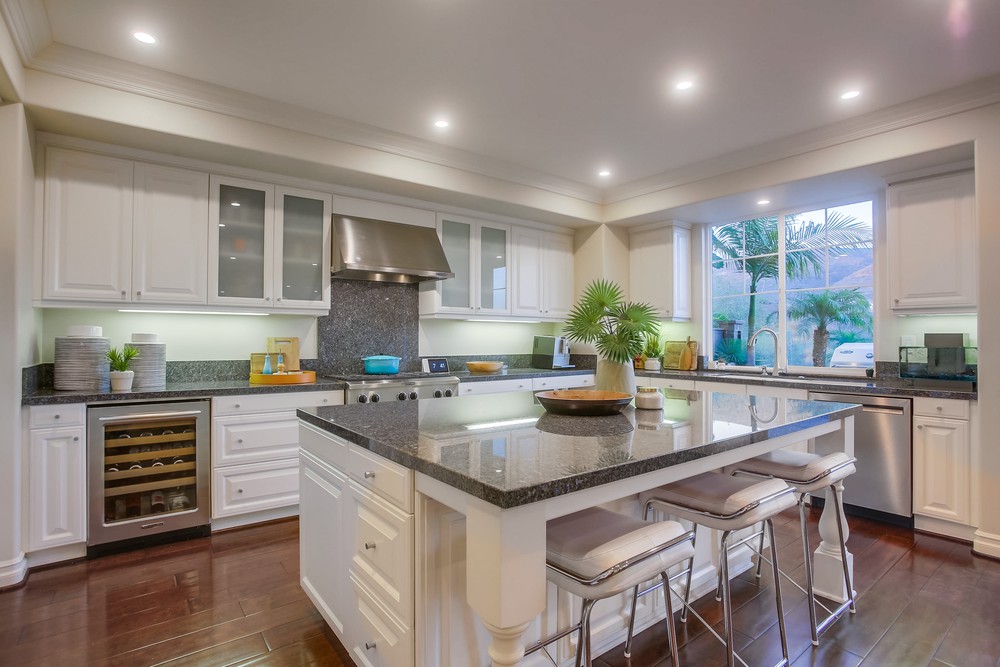
This newer Davidson Plan 2 has over $100,000 in custom upgrades! The smooth-finish mission-style wall texture throughout, ‘rainforest’ marble counters in primary bath, customized white kitchen with stainless & walk-in pantry, hardwood floors, plus a fantastic courtyard that creates a terrific indoor/outdoor lifestyle! Private bedroom/full bath downstairs too! Owned solar, central A/C, and 75-gallon water-heater. This is a trophy property! Hike or bike the 6 miles of local preserve trails nearby and enjoy the pool/clubhouse/fitness center at the Oaks Club!
The last six sales in La Costa Oaks in the last 90 days are: $3,160,000, $2,650,000, $2,625,000, $2,385,000, $2,415,000, and $2,800,000 – we are under ALL of them (see documents). Encinitas schools too! The 33 panel Solar System produces 17,000MWh/year and powers two wall chargers for EVs. Four motorized sunshades were added (very effective), and recently replaced appliances include: Hot Water Heater, Microwave, Dishwasher, Kitchen and Laundry Faucets. Recessed lighting was added to ALL bedrooms, downstairs office, living room, kitchen/dining. Many of the wall switches were upgraded to vacancy sensors (or timers) and/or dimmers. Five-inch baseboards, window casings, and extensive crown molding. The upstairs ceiling fans were upgraded and built-in wall remotes added. All can lights have been switched to LEDs. Built-in surround sound in the Living Room, Family Room, Courtyard and Backyard, with built-in Air-Bus wall Amps that operate and control 3 zones. The 1/2 bath was recently remodeled, the garage floors were ungraded and storage cabinets added – holy cow! An extensive trail system in the 1,400-acre Rancho La Costa Preserve nearby enables hikers and mountain bikers to go for miles! Additionally, you will be a member of the Oaks Club which has activities like Movie Night, Poker Night, and the Annual BBQ!
The original owner of this premier Plan 2 was the CFO of Davidson Communities, and added over $100,000 in custom upgrades you probably won’t find anywhere else. The smooth-finish mission-style wall texture throughout, a custom door and window in the third-car garage that face the courtyard, ‘rainforest’ marble counters in primary bath, plus one of the best easterly views in the tract! The sleek white kitchen is adorned with Blue Pearl granite, stainless appliances, and walk-in pantry. En-suite bedroom downstairs too! Owned solar, central A/C, and 75-gallon water-heater. Between the backyard and courtyard, there is ample private outdoor space, plus you can hike or bike the miles of local preserve trails!
Encinitas schools too – wow! An extensive trail system in the 1,400-acre Rancho La Costa Preserve nearby enables hikers and mountain bikers to go for miles! Additionally, you will be a member of the Oaks Club which has activities like Movie Night, Poker Night, and the Annual BBQ!
The 33 panel Solar System produces 17,000MWh/year and powers two wall chargers for EVs. Four motorized sunshades were added (very effective), and recently replaced appliances include: Hot Water Heater, Microwave, Dishwasher, Kitchen and Laundry Faucets. Recessed lighting was added to ALL bedrooms, downstairs office, living room, kitchen/dining. Many of the wall switches were upgraded to vacancy sensors (or timers) and/or dimmers. Five-inch baseboards, window casings, and extensive crown molding. The upstairs ceiling fans were upgraded and built-in wall remotes added. All can lights have been switched to LEDs. Built-in surround sound in the Living Room, Family Room, Courtyard and Backyard, with built-in Air-Bus wall Amps that operate and control 3 zones. The 1/2 bath was recently remodeled, the garage floors were ungraded and storage cabinets added – holy cow!
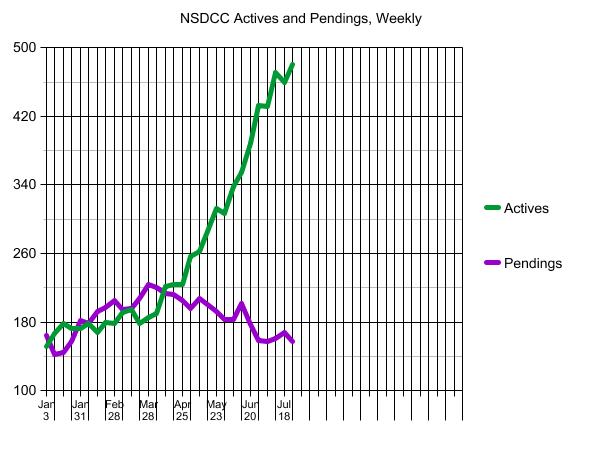
Last week, we saw here how the number of July sales has been plummeting, and with three days to go in the month, we are now at 119 NSDCC sales – which means we will end up with around 40% to 50% of last year’s July sales.
We also hear about how inventory is rapidly rising in other areas of the country. How are we doing here?
Here are the recent monthly counts of NSDCC July listings:
2017: 412
2018: 433
2019: 445
2020: 468
2021: 349
2022: 215 so far.
The NSDCC sales really aren’t bad, considering how few new listings are coming to market.
There is a bit of a backlog of sellers hoping to get lucky, but they will likely cancel their listing in the next month or two and try again next year, rather than give it away.
Between now and February, there will probably be months when we don’t reach 100 NSDCC sales, and it will be because there won’t be enough homes available to sell!
Last month I guessed we’ll be 400+ at the end of the year, or about the same as February. If our local Case-Shiller Index drops 0.5% per month for the next seven readings, we’d still be in positive territory for 2022. We haven’t had a negative MoM reading since December, 2018.
San Diego Non-Seasonally-Adjusted CSI changes
Observation Month
SD CSI
M-o-M chg
Y-o-Y chg
Jan ’20
264.04
+0.2%
+5.1%
Feb
265.34
+0.5%
+4.6%
Mar
269.63
+1.6%
+5.2%
Apr
272.48
+1.1%
+5.8%
May
273.51
+0.4%
+5.2%
Jun
274.91
+0.5%
+5.0%
Jul
278.00
+1.1%
+5.4%
Aug
283.06
+1.8%
+7.6%
Sep
288.11
+1.8%
+9.4%
Oct
292.85
+1.6%
+11.5%
Nov
295.64
+1.0%
+12.3%
Dec
297.52
+0.6%
+13.0%
Jan ’21
301.72
+1.4%
+14.3%
Feb
310.62
+2.9%
+17.1%
Mar
320.81
+3.3%
+19.1%
Apr
331.47
+3.3%
+21.6%
May
341.05
+2.9%
+24.7%
Jun
349.78
+2.6%
+27.2%
Jul
355.33
+1.6%
+27.8%
Aug
357.11
+0.5%
+26.2%
Sep
359.88
+0.8%
+24.9%
Oct
363.80
+1.1%
+24.2%
Nov
367.62
+1.1%
+24.3%
Dec
374.48
+1.8%
+25.9%
Jan ’22
383.92
+2.5%
+27.2%
Feb
401.45
+4.6%
+29.2%
Mar
416.64
+3.8%
+29.9%
Apr
426.08
+2.3%
+28.5%
May
428.32
+0.5%
+25.6%
Housing data for May 2022 continued strong, as price gains decelerated slightly from very high levels,” says Craig J. Lazzara, Managing Director at S&P DJI. “The National Composite Index rose by 19.7% for the 12 months ended May, down from April’s 20.6% year-over-year gain. We see a similar pattern in the 10-City Composite (up 19.0% in May vs. 19.6% in April) and in the 20-City Composite (+20.5% vs. +21.2%). Despite this deceleration, growth rates are still extremely robust, with all three composites at or above the 98th percentile historically.
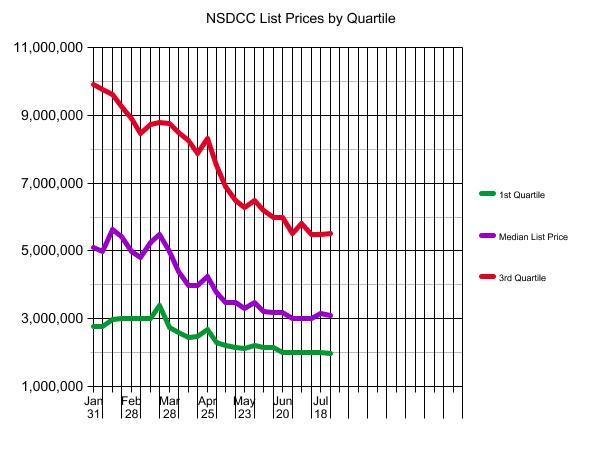
Here’s a look at the difference between the average price per square foot of the active and pending listings.
Of those priced under $3,000,000, it shows how the more-expensive superior properties are the ones going into escrow – and the inferior properties aren’t, even when priced less. Apparently, the gap between them isn’t big enough yet!
NSDCC Actives & Pendings Average List Price per SF
Price Range
NSDCC Active Listings
Avg. LP/sf
NSDCC Pending Listings
Avg. LP/sf
$0-$1.5M
53
$755/sf
22
$824/sf
$1.5M – $2.0M
83
$787/sf
29
$1,030/sf
$2.0M – $3.0M
108
$883/sf
63
$1,044/sf
$3.0M – $4.0M
65
$1,200/sf
26
$1,093/sf
$4.0M+
178
$1,701/sf
27
$1,528/sf
Click ‘more…’ below to see the trends of the average LP/sf in each price range.
Trustindex verifies that the original source of the review is Google.
Jim & Donna Klinge helped us sell our home of 30 years in Ocean Hills. We were very happy with their service and would HIGHLY recommend them to anyone looking for an Honest, Knowledgeable, Skilled, Informed Efficient realty team. Both Jim & Donna were so helpful in different ways and complemented each others skills. Please refer to a more detailed review that we wrote on YELP. Thank You Both for all your help!!!
Jesse O'Hara
June 12, 2025
Trustindex verifies that the original source of the review is Google.
A+ thank you
Lisa Tuomi
June 11, 2025
Trustindex verifies that the original source of the review is Google.
Many years ago, we purchased a home in Carlsbad, using a realtor that was recommended to us - Jim Klinge. Fast forward to 2025, we recently had the privilege of selling 2 homes in Carlsbad, CA and didn't hesitate to reach out to Jim and Donna Klinge of Klinge Realty Group to guide us through the sales. The transactions were very different, each with its own unique situation, opportunities and challenges. From start to finish, Donna and Jim helped navigate the pre-sale preparation, the listing, showing of the house, buyer negotiations, the final close and all of the paperwork and decisions in between. What stands out with both transactions is the professionalism of Jim and Donna (and their team), wonderful communication (timely, relevant, concise), their deep understanding of market dynamics (setting realistic expectations), their access to top-notch contractors, and last, their ability to guide us across the finish line successfully. We wouldn't hesitate to use Jim and Donna in the future and highly recommend them for anyone looking to buy or sell a property in North San Diego County.
Jerry Meyer
March 28, 2025
Trustindex verifies that the original source of the review is Google.
We sold a home with Jim and Donna and from beginning to end they were consummate professionals. Their initial walk through the property resulted in a list of items to be repaired or updated. They supplied a list of vendors and job quotes to do the repairs and updates. We originally wanted to sell ‘as is’ and just get it over with. They gave us a selling price for ‘as is’ and options for doing a few updates/repairs to doing it all with the selling price for each option. We agreed to do all they suggested and we sold for the exact price they predicted. For every dollar spent we got back more than $2 back in the selling price. And they got that price in a rising interest rate environment! Donna and Jim are extremely detailed and guide you through ever aspect of the sale. There were no surprises thanks to their guidance. We couldn’t be more pleased with their representation.
Thank you Donna and Jim,
Jerry and Mary
Heather Quejada
March 27, 2025
Trustindex verifies that the original source of the review is Google.
We have known Jim & Donna Klinge for over a dozen years, having met them in Carlsbad where our children went to the same school. As long time North County residents, it was a no- brainer for us to have the Klinges be our eyes and ears for San Diego real estate in general and North County in particular. As my military career caused our family to move all over the country and overseas to Asia, Europe and the Pacific, we trusted Jim and Donna to help keep our house in Carlsbad rented with reliable and respectful tenants for over 10 years.
Naturally, when the time came to sell our beloved Carlsbad home to pursue a rural lifestyle in retirement out of California, we could think of no better team to represent us than Jim and Donna. They immediately went to work to update our house built in 2004 to current-day standards and trends — in 2 short months they transformed it into a literal modern-day masterpiece. We trusted their judgement implicitly and followed 100% of their recommended changes. When our house finally came on the market, there was a blizzard of serious interest, we had multiple offers by the third day and it sold in just 5 days after a frenzied bidding war for 20% above our asking price! The investment we made in upgrades recommended by Jim and Donna yielded a 4-fold return, in the process setting a new high water mark for a house sold in our community.
In our view, there are no better real estate professionals in all of San Diego than Jim and Donna Klinge. Buying or selling, you must run and beg Jim and Donna Klinge to represent you! Our family will never forget Jim, Donna, and their whole team at Compass — we are forever grateful to them.
Lou F
March 27, 2025
Trustindex verifies that the original source of the review is Google.
WeI had the pleasure of working with Klinge Realty Group to sell our home in Carmel Valley, and I cannot recommend them highly enough!
Jim and Donna demonstrated exceptional professionalism, offering expert guidance on market conditions and pricing strategy, which resulted in a quick and successful sale.
Communication was prompt and we were well-informed throughout the entire process.
For anyone looking for a dedicated and knowledgeable real estate team, look no further!
---
William Sams
March 25, 2025
Trustindex verifies that the original source of the review is Google.
Donna and Jim Klinge of Klinge Realty Group have our highest possible recommendation. From Donna and Jim’s first visit to our house through closing their advice and counsel was candid and honest in all dealings. They kept us fully informed throughout the process. The house sold less than three days after listing with a two-week closing. My wife and I have sold several houses during our lives. This was by far the best experience. Klinge Reality is a premium service realtor. You can’t make a better choice for someone to sell your home fast and for top dollar.
Emily Hernandez
December 29, 2024
Trustindex verifies that the original source of the review is Google.
Donna and Jim provided exceptional support and professionalism throughout the entire process. We couldn't have been happier with their efforts. They made our house shine, and thanks to their expertise, it sold above the listing price in the very first weekend! Truly a fantastic experience from start to finish.
Jesus Adrian Sahagun
November 11, 2024
Trustindex verifies that the original source of the review is Google.
This year has been difficult on our family, mainly due to having to sell our home. Thankfully we knew God had a plan for us and working with the Klinge team was a key part of it. It was an obvious decision to work with them again after such an amazing experience when purchasing the same home we needed to sell. The challenge was, how will we do this in so little time with so much going on? Jim and Donna held our hand every step of the way. Whenever an unexpected issue arose they found and provided a solution. Never once did we feel pressured to make a decision and the Klinges were always reassuring after providing the information that the decision was ours to make. Despite the curve balls, they never panicked and exemplified the “can do” attitude, making us feel optimistic and taken care of. Their expertise and professionalism was superb. But of all the reasons to work with the Klinges, the most impactful and valuable is their compassion and genuine care for their clients. We pray that we can one day purchase our forever home and you better believe that Jim and Donna will be representing us - as long as they will have us of course. Thank you again Klinge team! Your execution, experience, and care are unmatched.
SABIHA PASHA
July 23, 2024
Trustindex verifies that the original source of the review is Google.
Jim and Donna were fantastic! Jim understanding my needs, recommending potential places, pointing out the pros and cons of each property was invaluable. Then when the offer was accepted Donna’s organized guidance through the inspections, paperwork etc made the whole process seem effortless.
So grateful that I had them on my side!