Dog Races This Side of Town
The husband-and-wife national anthem – it’s John’s birthday today:

The husband-and-wife national anthem – it’s John’s birthday today:
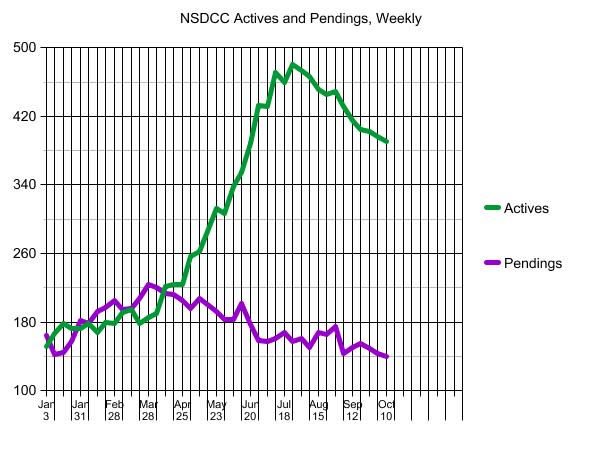
We are at the point where the inventory should continue its gradual descent and wind up around 235 active listings at the end of the year (if the percentage drop goes the same way it did last year).
Though the Padres will be having an unusual impact on the local market…..hopefully for the next month!
~~~~~~~~~~~~~~~~~~~~~~~~~~~~~~~~~~~

In another installment of what listing agents can do to improve their chances, let’s mention one of the habits that were made worse by the frenzy – responding to an offer.
Over the last two years, it became part of the business that buyers had to wait around for days while waiting for the listing agent to decide the winner. There weren’t many other homes for sale, and every new listing was priced higher than the last so buyers would tolerate a long delay.
Not any more.
Today, listing agents who are lucky enough to receive an offer should jump on it and respond the same day – and if possible, within an hour or two. Buyer’s remorse has never set in so fast, and in this environment, it is more than just an emotional bummer, it is a deal-killer.
Specifically, what can listing agents do better?
Buyers are looking for ANY reason NOT to buy, and stay on the fence longer where it is comfortable. And you want to take a chance on countering over which title or escrow company? Or try to get the sellers a couple of months of free rent – heck, at least offer to pay for it!
The journey over the next couple of years will be a long arduous slog through the bad habits developed by realtors during the frenzy. It made agents lazier than ever, and gave them the impression that once they had a listing, it meant they were a real estate god and could boss people around.
It will be a hard habit to break.

Let’s face it, at least 90% of the current listings aren’t coming off their price much. To get a deal, you have to make offers! Here are some good tips:
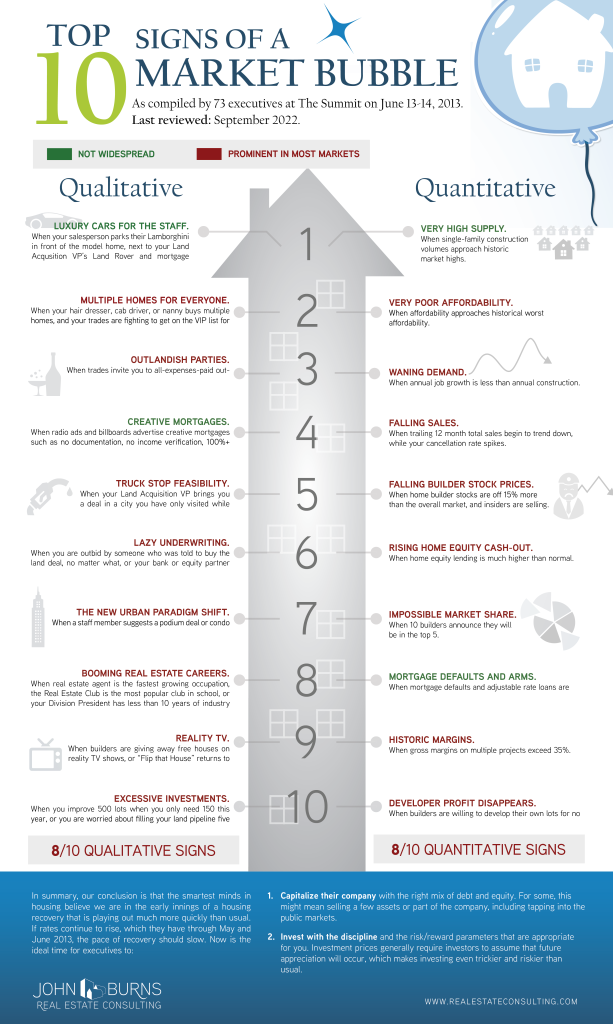
By John Burns
In 2013, fresh off the biggest housing downturn in their lifetimes, 73 housing industry executives compiled the Top 10 Signs of a Housing Market Bubble at our Summit Conference in Laguna Beach, CA. Assessing the criteria that we set almost a decade ago (10 quantitative and 10 qualitative), we have found that 16 of the 20 housing bubble signs are now flashing red.
In last month’s client-exclusive housing outlook webinar, we called out some signs we are seeing:
There will always be an occasional low sale here and there.
What would cause home prices to really slide?
There would need to be a series of low sales in the same area to create downward momentum. The next seller would have to be convinced that lower prices are a fact, and without an obvious trend, they will be reluctant to believe it.
Here’s an example. Even though this lowball listing (in red) undermined the two comps over $2 million, the next seller wasn’t convinced, and they listed their home for $1,975,000. They have lowered it since, but you can bet they are digging in now – and the market is in their hands:
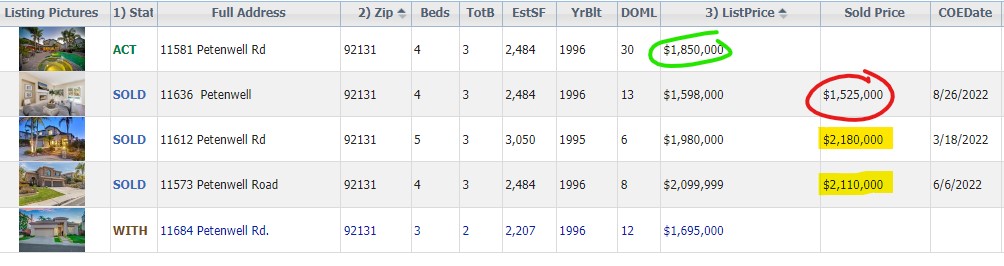
If they hold out and get close to their price, then the lowball sale will be dismissed as one-off, and other sellers in the future will ignore it….and hope the buyers do too.
These are the standoffs happening everywhere now. ALL sellers have plenty of equity and could go down in price if they really wanted – or needed – to make the sale.
But will they?
Generally speaking, the agents might go along for 30 days or so, but they aren’t used to sitting on unsold listings for months. They are going to nudge the sellers to lower their price, but those drops need to be in 5% increments to cause a meaningful reaction from the buyers.
Will some sellers surrender? Yes, but only when confronted with a lower offer. Currently we are in the Buyer-Vacation stage where few are in the game and making offers, and without solid proof, the sellers are more likely to wait, than dump.
The 2023 Selling Season will be the most anticipated market in the history of the world!
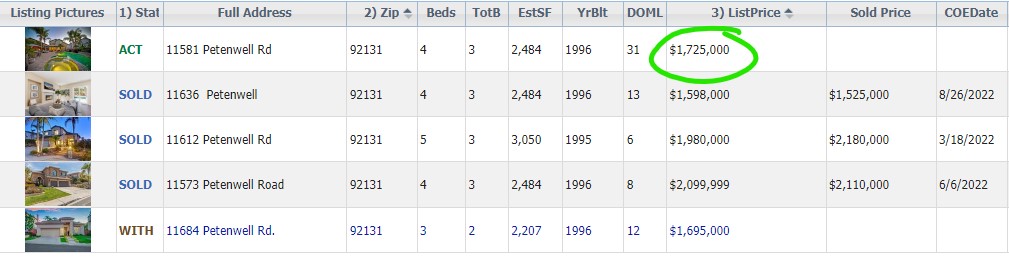
New update – another price reduction. Buyers are on vacation now, we’ll see about 2023:
For those who are willing to investigate the sales data in our local areas, here are the detached-home sales from the last 90 days. Poke around a little, and I doubt you’ll believe that we’re getting ‘creamed’.
NW Carlsbad 92008 sales – last 90 days
SE Carlsbad 92009 sales – last 90 days
NE Carlsbad 92010 sales – last 90 days
SW Carlsbad 92011 sales – last 90 days
Encinitas 92024 sales – last 90 days
La Jolla 92037 sales – last 90 days
Rancho Santa Fe 92067 sales – last 90 days
Del Mar 92014 sales – last 90 days
Solana Beach 92075 sales – last 90 days
Carmel Valley 92130 sales – last 90 days
The highlights: three RSF sales over $10 million in the last 90 days; nine sales above $5,000,000 in La Jolla (and 60 sales overall!), 81 sales in Encinitas – more than one every business day; and of the 182 sales in Carlsbad, 46 of them were $2,000,000 and higher.
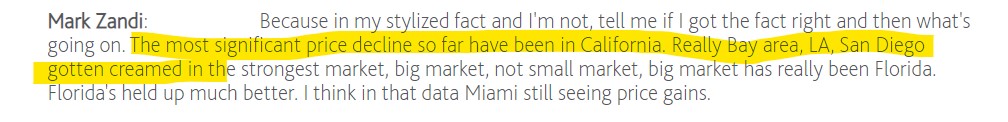
Dr. Doom said in his podcast here that the California markets have had the most significant price declines, and the Bay Area, LA, and San Diego have ‘gotten creamed’.
He didn’t provide any data to back it up, so let’s look at what we have from the MLS which includes September data so we’re including the most relevant information.
San Diego County, All Property Types:
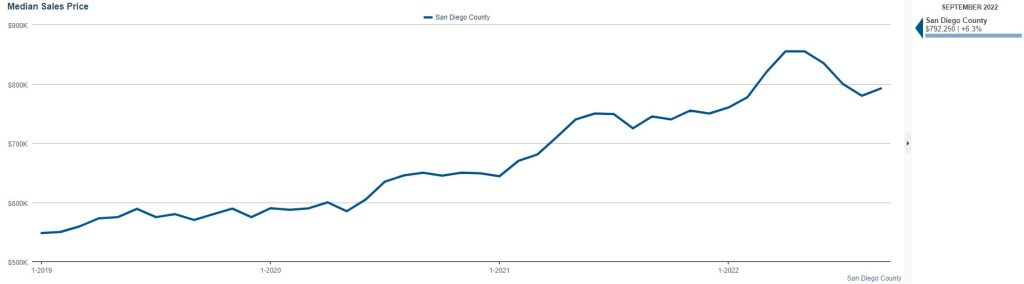
The San Diego County median sales price was $855,000 in June and July, and last month it was $792,500 – which was a 7% decline from the peak this summer. It was also 2% higher than in August. Is that creamed?
We’re coming off the greatest real estate frenzy of all-time, and now the Fed has caused mortgage rates to double in less than six months. All considered, I think we’re doing great, and better than expected.
These guys who just fling it around on their national platforms are doing undue harm to our market. Don’t listen to them until they get out of their mom’s basement and actually investigate what’s really happening!
The The Will Of The People World Tour by Muse is underway, and will be in San Diego on April 10th.
Donna said,”Oh that’s the Twilight band”. Huh? Oh, they were included on all three Twilight films:
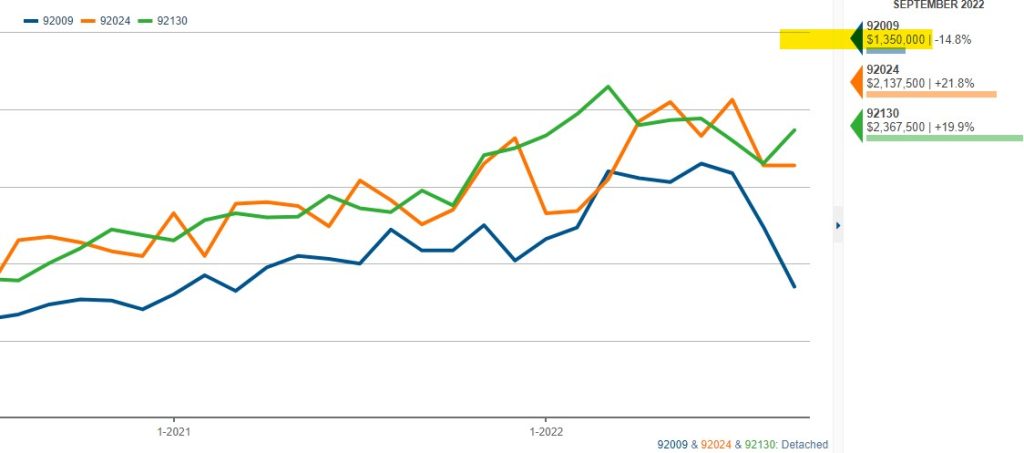
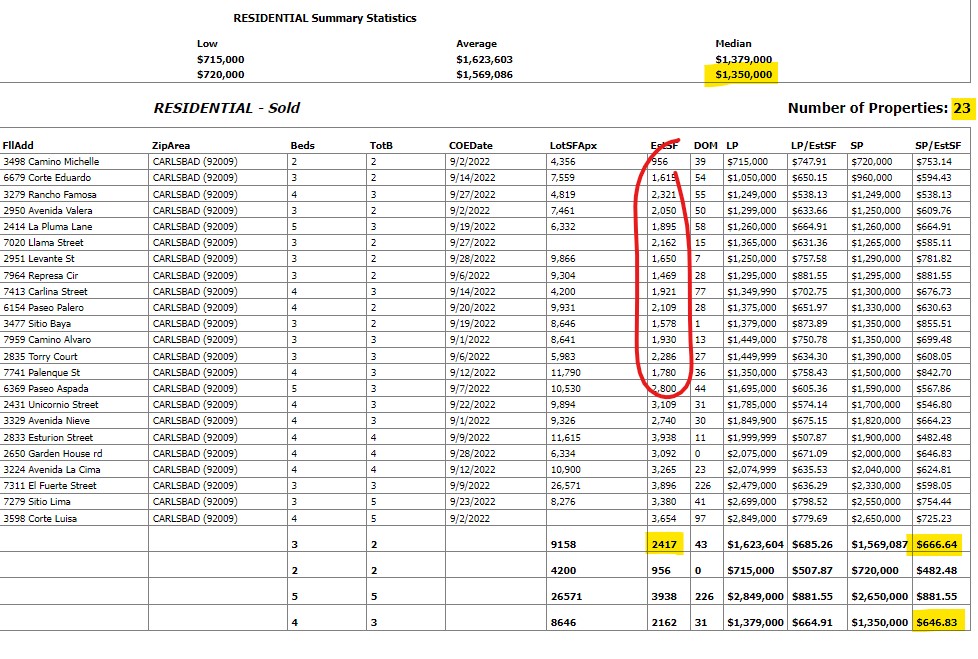
Last month, the 92009 median sales price declined 14.8% YoY, and was -22% MONTH-OVER-MONTH.
Keyboard warriors everywhere will be jumping all over news like this.
What really happened?
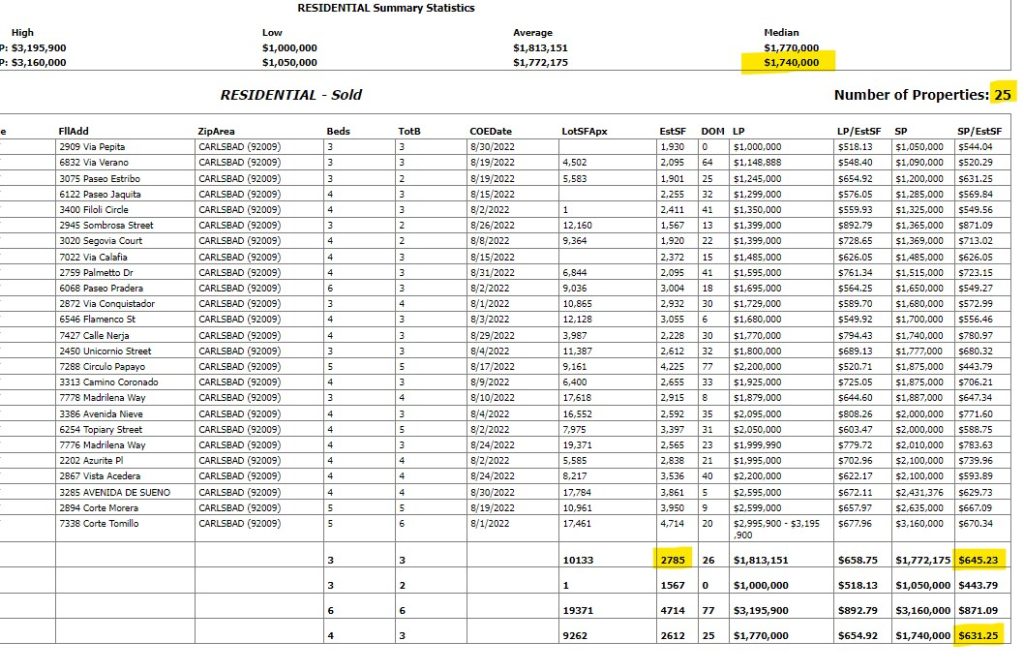
The facts:
There were only 23 sales last month. Fewer sales means more volatility in the data, and the numbers will be bouncing all over the place. The average SP:LP was 97%, so nobody was giving it away, and when you look at sales like the last one on the list on Corte Luisa, know that it was an agent selling his own house for a $980,000 profit above what he paid in 2020.
You have to look deeper into the data to get the full picture of what’s really happening!
~~~~~~~~~~~~~~~~~~~~~~~~~~~~~~~~~~~~~~~~~~
Here are the August and September stats:
~~~~~~~~~~~~~~~~~~~~~~~~~~~~~~~~~~~~~~~~~~~~
Let’s revisit a previous blog post for an update, and more detail.
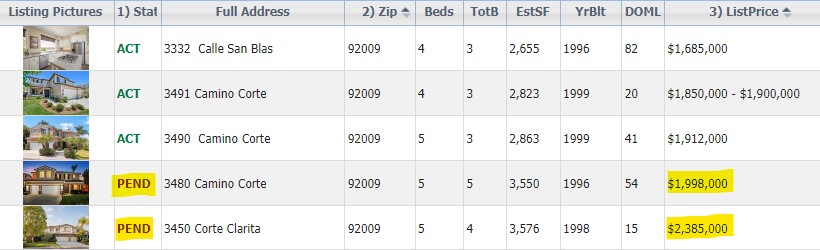
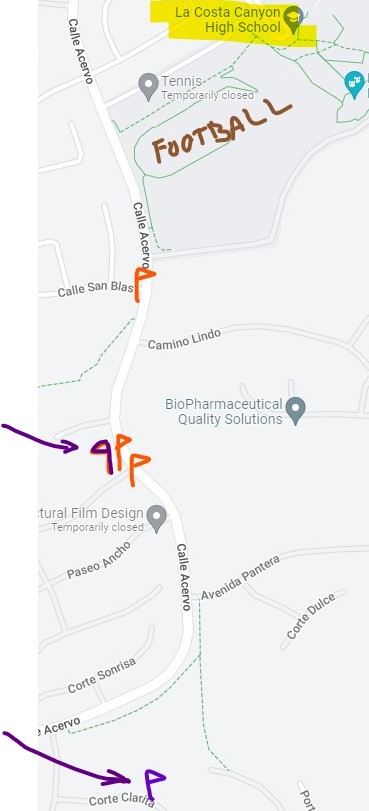
I featured a group of listings near La Costa Canyon HS a couple of weeks ago. The day the blog post ran, the most-expensive listing was pending, but it fell out of escrow that day. It’s back in escrow this week, and judging by how the listing agent ran my rather-sizable nose in it, they must have gotten pretty close to their list price. Tracey sold hers too, and together the two highest-priced listings are the ones that are pending, which demonstrate that buyers want quality and are willing to pay for it.
Pendings = purple:
Realtors who have no game will be reading juicy headlines on social media and be telling their sellers to dump on price, rather than dig for the truth and get to work.
GET GOOD HELP!
And just wait until I tell you the story about this one!