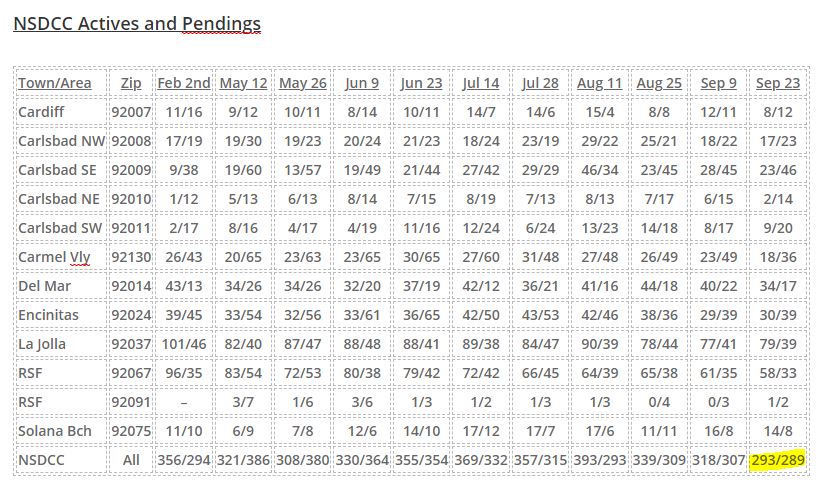
by Jim the Realtor | Sep 23, 2021 | 2021, Actives/Pendings, Frenzy, Frenzy Monitor
The reason for breaking down the active and pending listings by zip code is to give the readers a closer look at their neighborhood stats.
It’s interesting to see that the total number of actives and pendings are so similar – as close as they were in late-June as the max frenzy was unwinding. The big split in the counts on August 11th made it look like the frenzy was coming apart, but they’ve gotten back in line nicely since:
But with fewer homes for sale combined with the time of year, we probably won’t see much change. Let’s call it low-grade frenzy conditions for now.
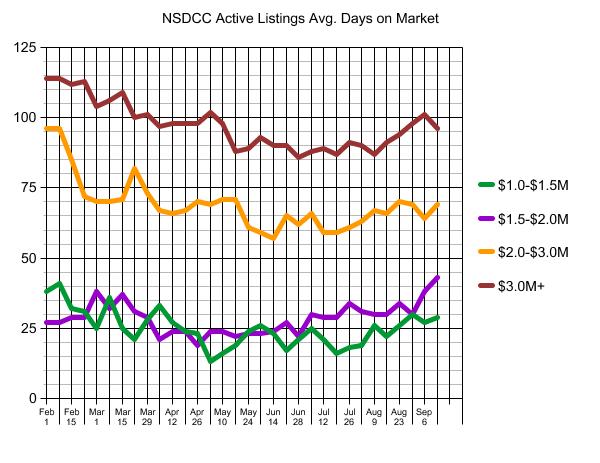
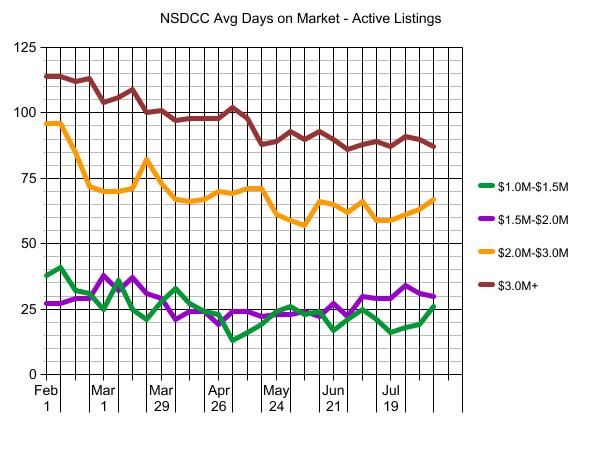
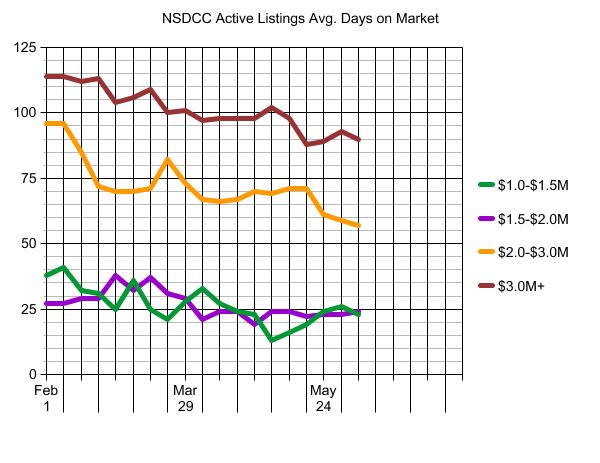
The average days on market is creeping upward, but still no big concerns. There will always be sellers who would rather wait for the lucky sale, than adjust their price – and longer average market times indicate more sellers doing the former. Though we should note that the hottest range ($1.5 – $2.0) must have a lot of dogs lying around:
San Diego County has experienced the worst YoY change of active listings IN THE NATION. Three thousand houses for sale in a county of 3.3 million people? Yikes!!
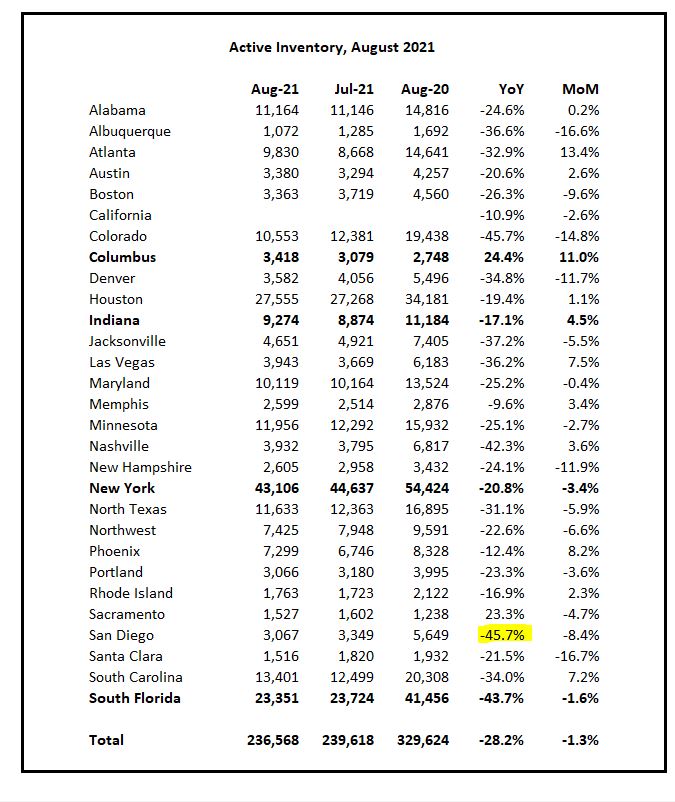
And that was the August report. Today in San Diego County:
ACTIVES: 1,760
PENDINGS: 2,600
Wow!
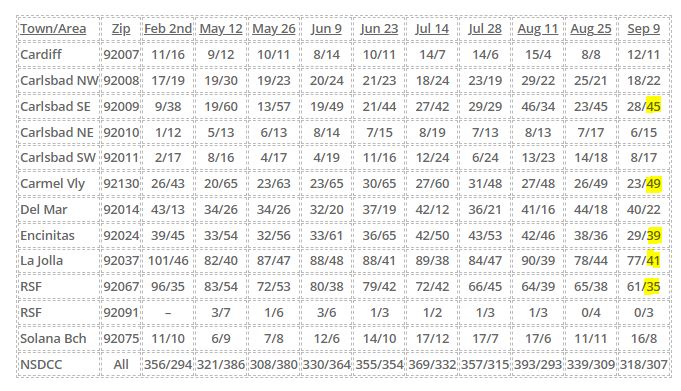
by Jim the Realtor | Sep 10, 2021 | Actives/Pendings, Frenzy Monitor, North County Coastal
The reason for breaking down the active and pending listings by zip code is to give the readers a closer look at their neighborhood stats.
Our Big Three – Carmel Valley, Encinitas, and SE Carlsbad – continue to carry substantially more pendings than active listings, but both La Jolla and Rancho Santa Fe have similar pending counts, which is incredible given their much-higher price points:
NSDCC Actives and Pendings
The average days on market is creeping upward, but still no big concerns. There will always be sellers who would rather wait for the lucky sale, than adjust their price – and longer average market times indicate more sellers doing the former:
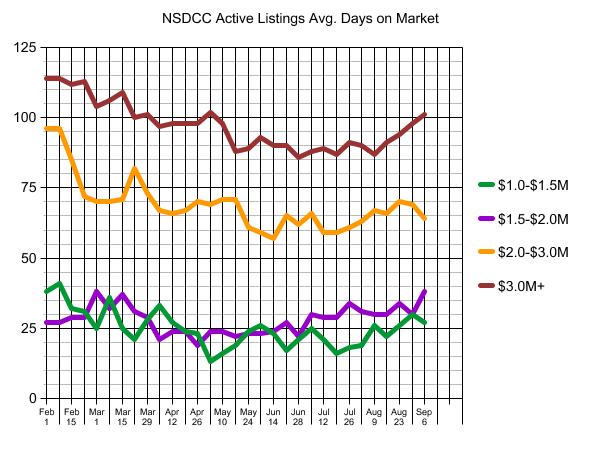
The $1,500,000 – $2,000,000 range has been the hottest all year, but their average DOM is at its high – while the rest are well below theirs!
by Jim the Realtor | Aug 26, 2021 | Frenzy Monitor
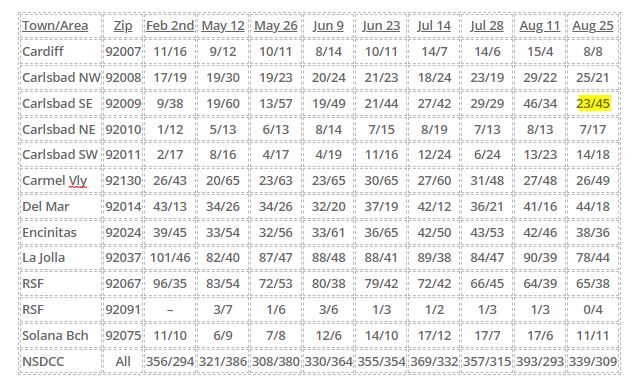
The reason for breaking down the active and pending listings by zip code is to give the readers a closer look at their neighborhood stats.
The total number of active listings has dropped 14% over the last two weeks, with Carlsbad SE taking the brunt of it as the actives got cut in half (46 to 23) while the 92009 pendings shot up by 32% (34 to 45). Don’t sleep on this market – there is still plenty of interest in buying quality homes.
Look how steady each area has been:
NSDCC Active and Pending Detached-Home Listings
In the previous FM, I said that the March-May period had to be the hottest of all-time, but we had 400+ pendings from June 22nd to November 30th last year – with a peak of 491 pendings on September 7th.
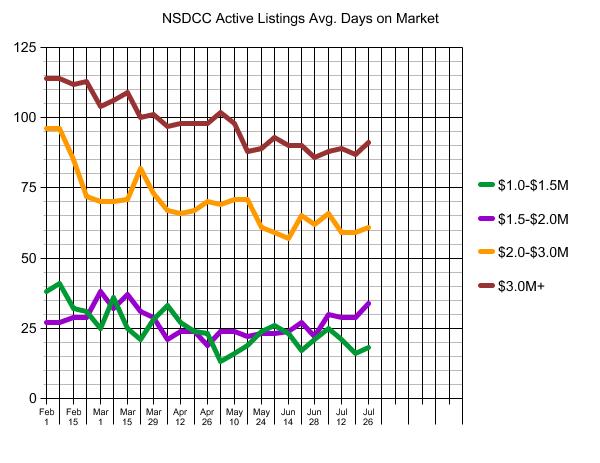
We can also track the average market times too. Any upward trends here would indicate market slowing, but there could be several reasons, like the listing agents letting a few more days to elapse before concluding the biding war(?). Or buyers being more deliberate (which is more likely):
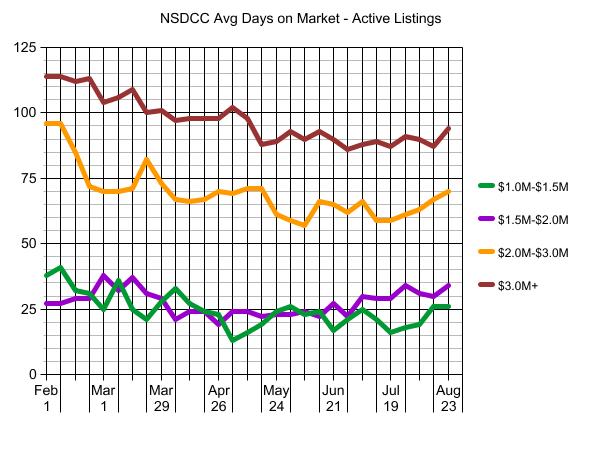
While the market was once speeding along at 125 MPH, now it’s a steady cruise around 80 MPH. Everything settling down little by little, with an occasional hot new listing that really stands out.
by Jim the Realtor | Aug 11, 2021 | Frenzy Monitor |
The reason for breaking down the active and pending listings by zip code is to give the readers a closer look at the health of the market in their neighborhood.
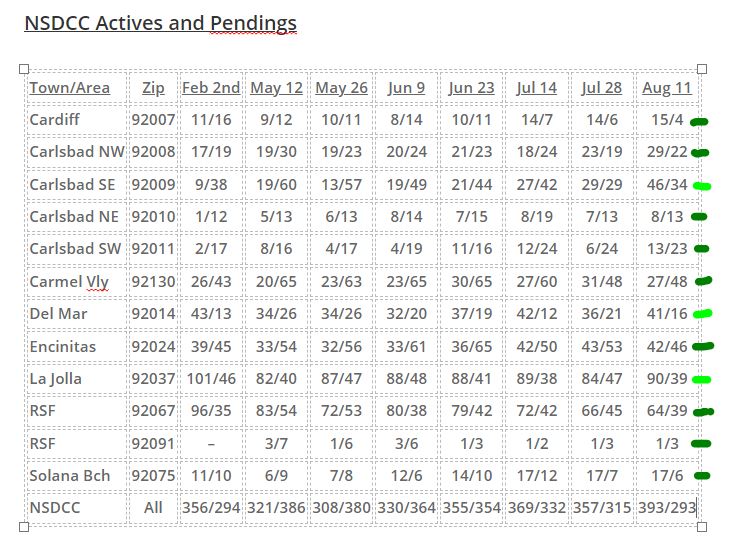
We’ve considered the market as healthy when there has been a 2:1 ratio of actives to pendings.
All areas are in good shape, with only three being less than full-green because the number of actives have creeped up slightly but whose pendings count is still strong.
Prior to the pandemic, Rancho Santa Fe was regularly a 10:1 ratio – now look at it!
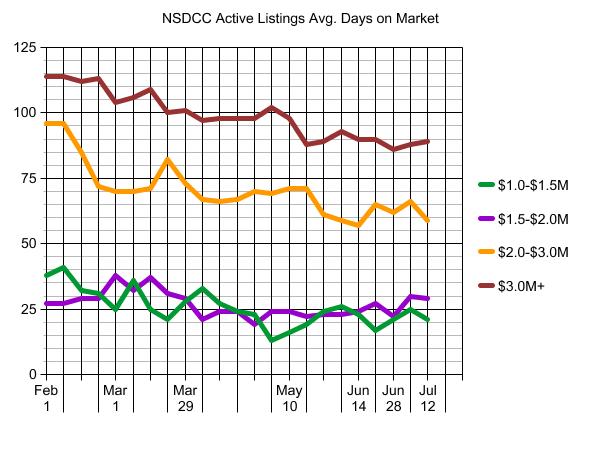
We are tracking the average market times too. Any upward trends here would indicate market slowing:
No big concerns here either. While we were flying at 130 MPH in spring, we’re down to around 85MPH now, which is still a very nice cruising speed – and faster than normal!
by Jim the Realtor | Jul 29, 2021 | Frenzy Monitor
The total number of pendings have been rapidly descending with frenzy-escrows closing out. But new listings should taper off from now on, so we’ll see which drops faster:
NSDCC Actives and Pendings
| Town/Area |
Zip |
Feb 2nd |
May 12 |
May 26 |
Jun 9 |
Jun 23 |
Jul 14 |
Jul 28 |
| Cardiff |
92007 |
11/16 |
9/12 |
10/11 |
8/14 |
10/11 |
14/7 |
14/6 |
| Carlsbad NW |
92008 |
17/19 |
19/30 |
19/23 |
20/24 |
21/23 |
18/24 |
23/19 |
| Carlsbad SE |
92009 |
9/38 |
19/60 |
13/57 |
19/49 |
21/44 |
27/42 |
29/29 |
| Carlsbad NE |
92010 |
1/12 |
5/13 |
6/13 |
8/14 |
7/15 |
8/19 |
7/13 |
| Carlsbad SW |
92011 |
2/17 |
8/16 |
4/17 |
4/19 |
11/16 |
12/24 |
6/24 |
| Carmel Vly |
92130 |
26/43 |
20/65 |
23/63 |
23/65 |
30/65 |
27/60 |
31/48 |
| Del Mar |
92014 |
43/13 |
34/26 |
34/26 |
32/20 |
37/19 |
42/12 |
36/21 |
| Encinitas |
92024 |
39/45 |
33/54 |
32/56 |
33/61 |
36/65 |
42/50 |
43/53 |
| La Jolla |
92037 |
101/46 |
82/40 |
87/47 |
88/48 |
88/41 |
89/38 |
84/47 |
| RSF |
92067 |
96/35 |
83/54 |
72/53 |
80/38 |
79/42 |
72/42 |
66/45 |
| RSF |
92091 |
– |
3/7 |
1/6 |
3/6 |
1/3 |
1/2 |
1/3 |
| Solana Bch |
92075 |
11/10 |
6/9 |
7/8 |
12/6 |
14/10 |
17/12 |
17/7 |
| NSDCC |
All |
356/294 |
321/386 |
308/380 |
330/364 |
355/354 |
369/332 |
357/315 |
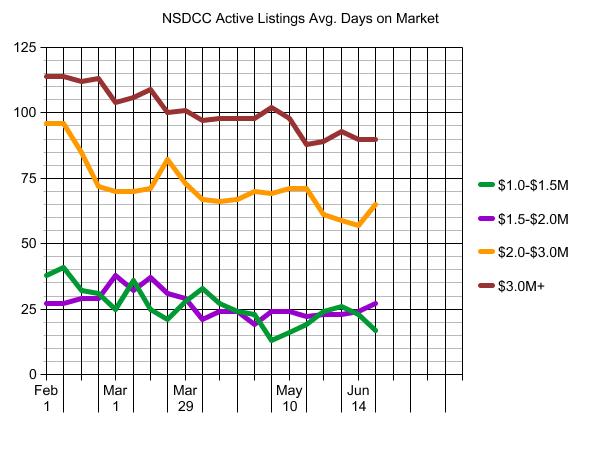
In the previous FM, I said that the March-May period had to be the hottest of all-time, but we had 400+ pendings from June 22nd to November 30th last year – with a peak of 491 pendings on September 7th.
We can also track the average market times too. Any upward trends here would indicate market slowing:
There is slowing of market times in all price ranges but averages of large sample sizes don’t move quickly.
by Jim the Realtor | Jul 16, 2021 | Frenzy, Frenzy Monitor, Slowdown

“We’re starting to see what a difference just a slight uptick in inventory and listings can do to help lessen the buying frenzy and create a sense of normalcy,” said C.A.R. President Dave Walsh (California).
~~~~~~~~~~~~~~~~~~~~~~~~~~~~~~~~~~~~~
by Jim the Realtor | Jul 14, 2021 | Frenzy Monitor, Slowdown, Spring Kick
When comparing to the last reading there hasn’t been much change, but the May 12th numbers were quite different – the number of actives today is now 15% higher, and pendings are 16% lower.
But it had to go in that direction. The March-May period has to be the hottest stretch ever recorded:
NSDCC Actives and Pendings
| Town or Area |
Zip Code |
Feb 2nd |
May 12 |
May 26 |
Jun 9 |
Jun 23 |
Jul 14 |
| Cardiff |
92007 |
11/16 |
9/12 |
10/11 |
8/14 |
10/11 |
14/7 |
| Carlsbad NW |
92008 |
17/19 |
19/30 |
19/23 |
20/24 |
21/23 |
18/24 |
| Carlsbad SE |
92009 |
9/38 |
19/60 |
13/57 |
19/49 |
21/44 |
27/42 |
| Carlsbad NE |
92010 |
1/12 |
5/13 |
6/13 |
8/14 |
7/15 |
8/19 |
| Carlsbad SW |
92011 |
2/17 |
8/16 |
4/17 |
4/19 |
11/16 |
12/24 |
| Carmel Valley |
92130 |
26/43 |
20/65 |
23/63 |
23/65 |
30/65 |
27/60 |
| Del Mar |
92014 |
43/13 |
34/26 |
34/26 |
32/20 |
37/19 |
42/12 |
| Encinitas |
92024 |
39/45 |
33/54 |
32/56 |
33/61 |
36/65 |
42/50 |
| La Jolla |
92037 |
101/46 |
82/40 |
87/47 |
88/48 |
88/41 |
89/38 |
| RSF |
92067 |
96/35 |
83/54 |
72/53 |
80/38 |
79/42 |
72/42 |
| RSF |
92091 |
– |
3/7 |
1/6 |
3/6 |
1/3 |
1/2 |
| Solana Beach |
92075 |
11/10 |
6/9 |
7/8 |
12/6 |
14/10 |
17/12 |
| NSDCC |
All Above |
356/294 |
321/386 |
308/380 |
330/364 |
355/354 |
369/332 |
We can also track the average market times too. Any upward trends here would indicate market slowing:
We could get a nice flare-up of activity as the summer closes out, and it probably won’t be that obvious in these stats as the frenzy simmers down slowly over the next few weeks.
by Jim the Realtor | Jul 6, 2021 | 2021, Frenzy, Frenzy Monitor, Jim's Take on the Market, Over List
The percentage of buyers who were willing to pay over list reached another all-time high in June:
NSDCC Detached-Home Sales, % Closed Over List Price
January: 38%
February: 43%
March: 53%
April: 55%
May: 54%
June: 59%
There were 37% of the total sales that closed for $100,000+ over list price!
The action was really hot in the $2,000,000s – the other price ranges cooled off slightly:
Percentage Who Paid Over List Price by Price Range
| Price Range |
March |
April |
May |
June |
| $0 – $1.0M |
76% |
79% |
89% |
88% |
| $1.0M – $1.5M |
68% |
78% |
84% |
75% |
| $1.5M – $2.0M |
66% |
66% |
72% |
66% |
| $2.0M – $3.0M |
54% |
32% |
34% |
66% |
| $3M+ |
16% |
22% |
22% |
17% |
After rising in six-figure amounts the previous month, it looks like pricing might be leveling off too:
NSDCC Average and Median Prices
| Month |
# of Sales |
Avg. LP |
Avg. SP |
Median LP |
Median SP |
| Feb |
224 |
$2,298,797 |
$2,257,334 |
$1,719,500 |
$1,758,000 |
| March |
252 |
$2,295,629 |
$2,260,524 |
$1,800,000 |
$1,825,000 |
| April |
357 |
$2,396,667 |
$2,403,962 |
$1,799,900 |
$1,828,000 |
| May |
300 |
$2,596,992 |
$2,581,715 |
$1,900,000 |
$1,994,500 |
| June |
348 |
$2,509,175 |
$2,537,953 |
$1,900,000 |
$1,967,500 |
We’ve been experiencing the hottest real estate market in the history of the world!
~~~~~~~~~~~~~~~~~~~~~~~~~~~~~~~~~~~~~~
by Jim the Realtor | Jun 23, 2021 | Frenzy, Frenzy Monitor
Here’s our bimonthly check on how the actives and pendings are faring.
Two weeks ago it was suggested, “We were driving 135 MPH, and now we’re down to 127 MPH”.
We’re probably down to 100 MPH now.
For the first time in months, the total number of active and pending listings are balanced, and almost all areas have a few more actives today than they did two weeks ago:
NSDCC Actives and Pendings
| Town or Area |
Zip Code |
Feb 2nd |
May 12 |
May 26 |
June 9 |
June 23 |
| Cardiff |
92007 |
11/16 |
9/12 |
10/11 |
8/14 |
10/11 |
| Carlsbad NW |
92008 |
17/19 |
19/30 |
19/23 |
20/24 |
21/23 |
| Carlsbad SE |
92009 |
9/38 |
19/60 |
13/57 |
19/49 |
21/44 |
| Carlsbad NE |
92010 |
1/12 |
5/13 |
6/13 |
8/14 |
7/15 |
| Carlsbad SW |
92011 |
2/17 |
8/16 |
4/17 |
4/19 |
11/16 |
| Carmel Valley |
92130 |
26/43 |
20/65 |
23/63 |
23/65 |
30/65 |
| Del Mar |
92014 |
43/13 |
34/26 |
34/26 |
32/20 |
37/19 |
| Encinitas |
92024 |
39/45 |
33/54 |
32/56 |
33/61 |
36/65 |
| La Jolla |
92037 |
101/46 |
82/40 |
87/47 |
88/48 |
88/41 |
| RSF |
92067 |
96/35 |
83/54 |
72/53 |
80/38 |
79/42 |
| RSF |
92091 |
– |
3/7 |
1/6 |
3/6 |
1/3 |
| Solana Beach |
92075 |
11/10 |
6/9 |
7/8 |
12/6 |
14/10 |
| NSDCC |
All Above |
356/294 |
321/386 |
308/380 |
330/364 |
355/354 |
We can also track the average market times too.
Any upward trends here would indicate market slowing:
The lower-end should always be the hottest segment, and the average market time was down to 18 days on Monday. But the other price ranges are going the other way, which either means that buyers are getting more picky, or more prices are wrong – or both.
~~~~~~~~~~~~~~~~~~~~~~~~~~~~~~~~~~~~~~~~~~~~~
by Jim the Realtor | Jun 9, 2021 | Frenzy Monitor, Jim's Take on the Market
Here’s our two-week check on how the actives and pendings are faring.
The Big Three areas (Carmel Valley, Encinitas, and SE Carlsbad) remain blistering hot, and overall we are similar to how Ryan described the Sacramento market yesterday:
“We were driving 135 MPH, and now we’re down to 127 MPH”.
NSDCC Actives and Pendings
| Town or Area |
Zip Code |
Actives/Pendings, Feb 2nd |
May 12th |
May 26th |
June 9th |
| Cardiff |
92007 |
11/16 |
9/12 |
10/11 |
8/14 |
| Carlsbad NW |
92008 |
17/19 |
19/30 |
19/23 |
20/24 |
| Carlsbad SE |
92009 |
9/38 |
19/60 |
13/57 |
19/49 |
| Carlsbad NE |
92010 |
1/12 |
5/13 |
6/13 |
8/14 |
| Carlsbad SW |
92011 |
2/17 |
8/16 |
4/17 |
4/19 |
| Carmel Valley |
92130 |
26/43 |
20/65 |
23/63 |
23/65 |
| Del Mar |
92014 |
43/13 |
34/26 |
34/26 |
32/20 |
| Encinitas |
92024 |
39/45 |
33/54 |
32/56 |
33/61 |
| La Jolla |
92037 |
101/46 |
82/40 |
87/47 |
88/48 |
| RSF |
92067 |
96/35 |
83/54 |
72/53 |
80/38 |
| RSF |
92091 |
– |
3/7 |
1/6 |
3/6 |
| Solana Beach |
92075 |
11/10 |
6/9 |
7/8 |
12/6 |
| NSDCC |
All Above |
356/294 |
321/386 |
308/380 |
330/364 |
We can also track the average market times too. Any upward trends here would indicate market slowing:
These remain steady too, and an indicator that buyers are still jumping at the hot buys…and more!


