
The reason for breaking down the active and pending listings by zip code is to give the readers a closer look at their neighborhood stats.
It’s interesting to see that the total number of actives and pendings are so similar – as close as they were in late-June as the max frenzy was unwinding. The big split in the counts on August 11th made it look like the frenzy was coming apart, but they’ve gotten back in line nicely since:
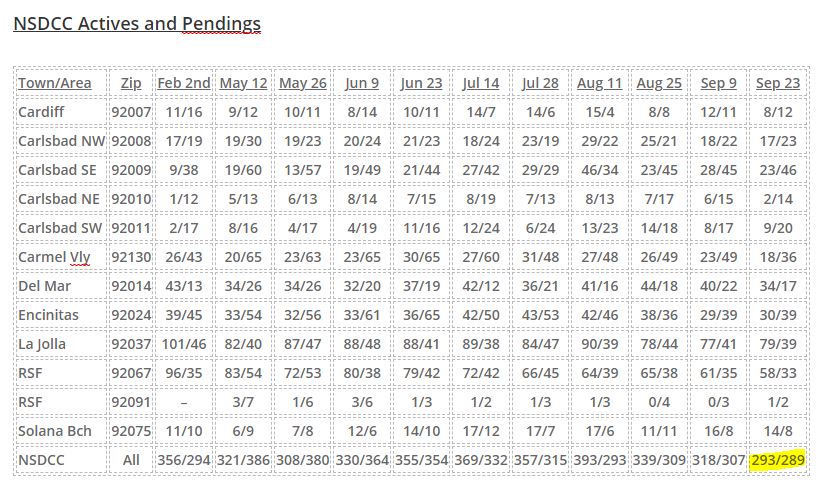
But with fewer homes for sale combined with the time of year, we probably won’t see much change. Let’s call it low-grade frenzy conditions for now.
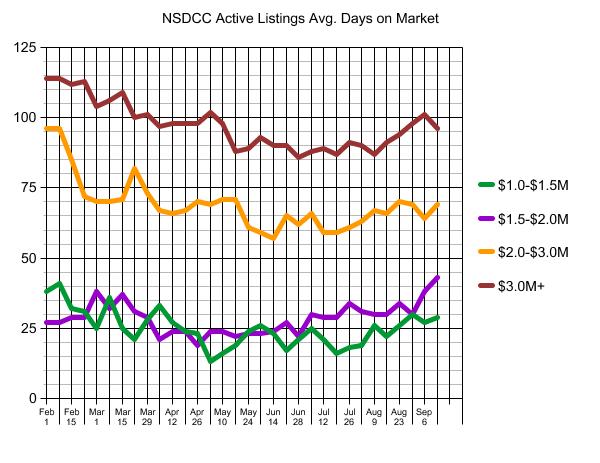
The average days on market is creeping upward, but still no big concerns. There will always be sellers who would rather wait for the lucky sale, than adjust their price – and longer average market times indicate more sellers doing the former. Though we should note that the hottest range ($1.5 – $2.0) must have a lot of dogs lying around:
San Diego County has experienced the worst YoY change of active listings IN THE NATION. Three thousand houses for sale in a county of 3.3 million people? Yikes!!
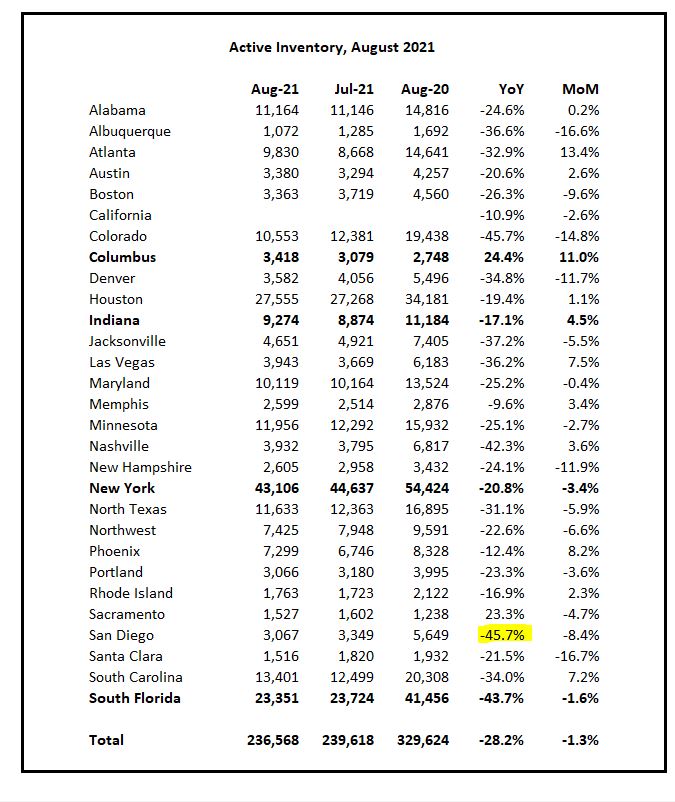
And that was the August report. Today in San Diego County:
ACTIVES: 1,760
PENDINGS: 2,600
Wow!


