by Jim the Realtor | Jun 9, 2021 | Frenzy Monitor, Jim's Take on the Market
Here’s our two-week check on how the actives and pendings are faring.
The Big Three areas (Carmel Valley, Encinitas, and SE Carlsbad) remain blistering hot, and overall we are similar to how Ryan described the Sacramento market yesterday:
“We were driving 135 MPH, and now we’re down to 127 MPH”.
NSDCC Actives and Pendings
| Town or Area |
Zip Code |
Actives/Pendings, Feb 2nd |
May 12th |
May 26th |
June 9th |
| Cardiff |
92007 |
11/16 |
9/12 |
10/11 |
8/14 |
| Carlsbad NW |
92008 |
17/19 |
19/30 |
19/23 |
20/24 |
| Carlsbad SE |
92009 |
9/38 |
19/60 |
13/57 |
19/49 |
| Carlsbad NE |
92010 |
1/12 |
5/13 |
6/13 |
8/14 |
| Carlsbad SW |
92011 |
2/17 |
8/16 |
4/17 |
4/19 |
| Carmel Valley |
92130 |
26/43 |
20/65 |
23/63 |
23/65 |
| Del Mar |
92014 |
43/13 |
34/26 |
34/26 |
32/20 |
| Encinitas |
92024 |
39/45 |
33/54 |
32/56 |
33/61 |
| La Jolla |
92037 |
101/46 |
82/40 |
87/47 |
88/48 |
| RSF |
92067 |
96/35 |
83/54 |
72/53 |
80/38 |
| RSF |
92091 |
– |
3/7 |
1/6 |
3/6 |
| Solana Beach |
92075 |
11/10 |
6/9 |
7/8 |
12/6 |
| NSDCC |
All Above |
356/294 |
321/386 |
308/380 |
330/364 |
We can also track the average market times too. Any upward trends here would indicate market slowing:
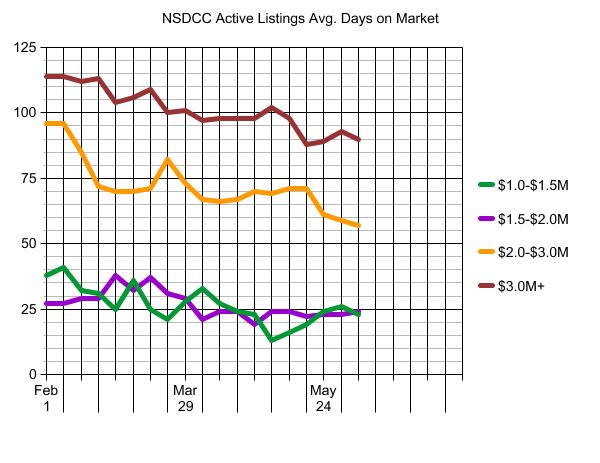
These remain steady too, and an indicator that buyers are still jumping at the hot buys…and more!
by Jim the Realtor | Jun 8, 2021 | 2021, Frenzy, Frenzy Monitor, Jim's Take on the Market, Over List |
Based on these closed sales, the local frenzy has been steady this year – though these are results of buying decisions made as far back as January and February.
For the most part, we have as many or more sales, and the same or higher LP:SP ratios over the last 60 days compared to the sales in the 60 days prior to April 23rd:
Detached-Home Sales By Zip Code
| Town/Area |
Zip Code |
Sales 60 days Prior to April 23 |
LP:SP Ratio |
Last 60 Days |
LP:SP Ratio |
| Carlsbad NW |
92008 |
40 |
103% |
32 |
104% |
| Carlsbad SE |
92009 |
95 |
105% |
118 |
106% |
| Carlsbad NE |
92010 |
15 |
105% |
22 |
106% |
| Carlsbad SW |
92011 |
29 |
103% |
29 |
106% |
| Encinitas |
92024 |
87 |
103% |
92 |
104% |
| Carmel Valley |
92130 |
72 |
101% |
88 |
101% |
This shows that the frenzy trends have been fairly consistent so far this year. Tomorrow we’ll take another look at the active and pending counts to see if there is any drop-off in the works.
by Jim the Realtor | May 26, 2021 | 2021, Actives/Pendings, Frenzy, Frenzy Monitor |

To help get a sense of the frenzy conditions, let’s monitor the number of active & pending listings per area.
If the active (unsold) listings start to rise, we will know that pricing is becoming an issue.
But so far, the demand for detached homes between Carlsbad and La Jolla is solid, and buyers are enduring prices that are 20% to 30% higher than last year:
NSDCC Actives and Pendings
| Town or Area |
Zip Code |
Actives/Pendings, Feb 2nd |
May 12th |
May 26th |
| Cardiff |
92007 |
11/16 |
9/12 |
10/11 |
| Carlsbad NW |
92008 |
17/19 |
19/30 |
19/23 |
| Carlsbad SE |
92009 |
9/38 |
19/60 |
13/57 |
| Carlsbad NE |
92010 |
1/12 |
5/13 |
6/13 |
| Carlsbad SW |
92011 |
2/17 |
8/16 |
4/17 |
| Carmel Valley |
92130 |
26/43 |
20/65 |
23/63 |
| Del Mar |
92014 |
43/13 |
34/26 |
34/26 |
| Encinitas |
92024 |
39/45 |
33/54 |
32/56 |
| La Jolla |
92037 |
101/46 |
82/40 |
87/47 |
| RSF |
92067 |
96/35 |
83/54 |
72/53 |
| RSF |
92091 |
– |
3/7 |
1/6 |
| Solana Beach |
92075 |
11/10 |
6/9 |
7/8 |
| NSDCC |
All Above |
356/294 |
321/386 |
308/380 |
The 92009, 92011 and 92130 (SE Carlsbad, SW Carlsbad, and Carmel Valley) are scorching hot, with 4x, 4x and 3x as many pendings as actives! But Rancho Santa Fe is the most impressive of all. There have been times when there were 10x as many actives as pendings in 92067 – today it’s 1.4x!
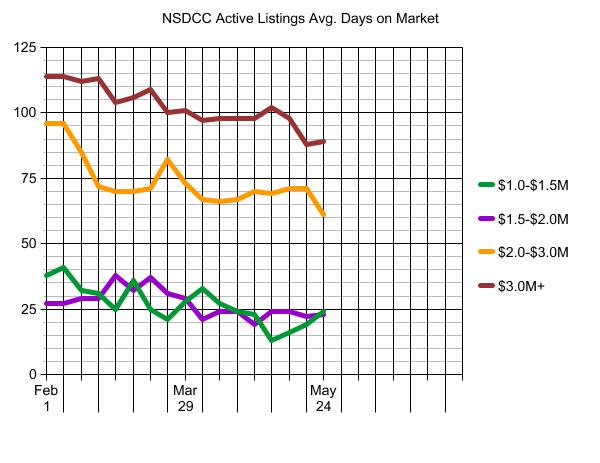
With the 30-day closings, there shouldn’t be any drastic changes here – let’s examine the trends over time.
We can also track the average market times too. Any upward trends here would indicate market slowing:
I’ll run this every couple of weeks.
by Jim the Realtor | May 12, 2021 | 2021, Frenzy, Frenzy Monitor |
To gauge the frenzy intensity, let’s monitor the number of active and pending listings per area.
If the count of unsold homes starts to rise, we will know that pricing is becoming an issue.
NSDCC Actives and Pendings
| Town or Area |
Zip Code |
Actives/Pendings, Feb 2nd |
Actives/Pendings, May 12th |
| Cardiff |
92007 |
11/16 |
9/12 |
| Carlsbad NW |
92008 |
17/19 |
19/30 |
| Carlsbad SE |
92009 |
9/38 |
19/60 |
| Carlsbad NE |
92010 |
1/12 |
5/13 |
| Carlsbad SW |
92011 |
2/17 |
8/16 |
| Carmel Valley |
92130 |
26/43 |
20/65 |
| Del Mar |
92014 |
43/13 |
34/26 |
| Encinitas |
92024 |
39/45 |
33/54 |
| La Jolla |
92037 |
101/46 |
82/40 |
| RSF |
92067 |
96/35 |
83/54 |
| RSF |
92091 |
– |
3/7 |
| Solana Beach |
92075 |
11/10 |
6/9 |
| NSDCC |
All Above |
356/294 |
321/386 |
We have 10% fewer active listings today than we had in the first week of February?
Yikes!
I’ll keep running this chart through the summer to help track the frenzy.