
The total number of pendings have been rapidly descending with frenzy-escrows closing out. But new listings should taper off from now on, so we’ll see which drops faster:
NSDCC Actives and Pendings
| Town/Area | ||||||||
| Cardiff | ||||||||
| Carlsbad NW | ||||||||
| Carlsbad SE | ||||||||
| Carlsbad NE | ||||||||
| Carlsbad SW | ||||||||
| Carmel Vly | ||||||||
| Del Mar | ||||||||
| Encinitas | ||||||||
| La Jolla | ||||||||
| RSF | ||||||||
| RSF | ||||||||
| Solana Bch | ||||||||
| NSDCC |
In the previous FM, I said that the March-May period had to be the hottest of all-time, but we had 400+ pendings from June 22nd to November 30th last year – with a peak of 491 pendings on September 7th.
We can also track the average market times too. Any upward trends here would indicate market slowing:
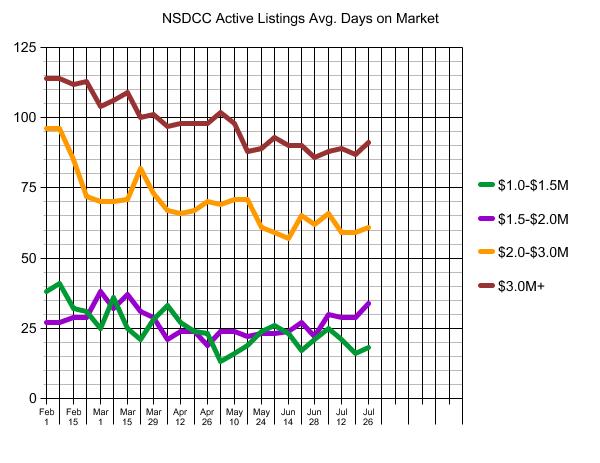
There is slowing of market times in all price ranges but averages of large sample sizes don’t move quickly.


