The post-frenzy headlines will revert back to their usual negative slant.
Will home buyers read the entire article? Or jump to their own conclusions?
Here are the actual numbers mentioned:
States with the largest number of new foreclosures were:
California: 3,434
Texas: 2,827
Florida: 2,546
New York: 1,363
Illinois: 1,362
“Despite the increased level of foreclosure activity in September, we’re still far below historically normal numbers,” said Rick Sharga, executive vice president at RealtyTrac, an ATTOM company.
September foreclosure actions were almost 70% lower than they were pre-pandemic. Total foreclosure activity is also still 60% lower than it was a year ago.
“I think the ‘forbearance cliff’ will be minimal,” said David Stevens, former CEO of the Mortgage Bankers Association and former FHA commissioner in the Obama administration.
“Unlike the Great Recession where home prices dropped approximately 20% from peak to trough, this recession saw home values rise by roughly the same amount. So while we should see some foreclosures, the likelihood is that there will be far fewer from a percentage basis due to the ability to sell a home versus default, or stay in the home due to far better workout options and higher re-employment.”
In a state of 40 million people, I don’t think anyone in California should get nervous over an additional 3,434 foreclosures filed (not completed). It’s different now that the Homeowners Bill of Rights was made law in this state, and anyone who gets foreclosed must want to lose their house, and their equity.
The San Diego housing market is a popular choice for those who are leaving the Bay Area (population of 6,404,512 in the five counties). It’s looks like more are coming – a report from sfgate:
Joint Venture Silicon Valley, in partnership with the Bay Area News Group, polled 1,610 registered voters across five Bay Area counties: Alameda, Contra Costa, San Francisco, San Mateo and Santa Clara.
A shocking 71% of respondents said the quality of life in the greater Bay Area is worse now compared to five years ago. Fifty-six percent of respondents said they are considering leaving in the next five years — including 53% of respondents who work in the tech sector.
“It’s the cost of living, high housing costs. I think that is the dominant thing. It’s housing housing housing,” said Russell Hancock, President and CEO of Joint Venture Silicon Valley, in a press briefing. “…That is driving almost all of the results.”
Hancock said the 53% figure is the highest percentage of people who have said they want to leave the Bay Area compared to previous polls conducted outside of Joint Venture.
Indeed, an overwhelming majority of respondents said it’s high housing costs (77%) and cost of living (84%) spurring their desire to seek out greener pastures. Homelessness, wildfires and drought were also issues respondents considered when mulling the decision to leave the Bay Area.
“We’ve long been a high-stress region. Staggering housing prices, rising homelessness, a stark income divide and a host of sustainability challenges have had us on edge for some time,” Hancock writes in the introduction to the poll. “But when you toss a highly infectious disease into the mix you get a smothering amount of anxiety.”
But as Hancock noted, these feelings go beyond the pandemic and its challenges.
“We’re split (48% to 52%) on whether the Bay Area is headed in the right direction,” he said.
The poll paints a disturbing picture of life in the Bay Area, but it’s not all doom and gloom. About 65% of respondents said “they feel a strong sense of belonging to the Bay Area” — even more so than they feel connected to their neighborhood and city. Many (66%) applauded their employers’ response to the pandemic and now feel differently about their work-life balance.
As Hancock pointed out in the briefing, polls “tell us how people are thinking. And that’s worth knowing.”
“Perception,” he added, “is also a form of reality.”
If there were 56% of their population who left, it would equal 3,586,526 people – which would create a whole new experience for those who stay! But we know that talk is cheap, and once all the other variables are considered, most people don’t move.
But we’ll probably get a steady flow for the foreseeable future.
For those who are thinking of selling next year and plan to do some improvements, don’t wait to begin.
In fact, start today!
Yesterday, I contacted three different flooring contractors, and all were booked into December. Our GC is currently booked for two months, our pool-repair guy has work scheduled for the next FIVE MONTHS, and our plumber gave up and suggested that we find someone else.
If you want us to provide an initial consultation and give opinions of what repairs/improvements would be smart to complete prior to selling, feel free to contact us – now. We can call in favors if needed – the pool guy got started within two weeks!
It made me wonder how many homeowners were in the hunt for a new house over the last 1-2 years, and have since given up on moving and decided to remodel instead.
No matter how small the percentage, it means the demand for homes for sale will be increasingly more dependent upon the out-of-towners who don’t have a house here yet. Their desperation level is higher than our current homeowners here who are comparing to what they already own……and who are finding it more difficult every day to justify a move.
~~~~~~~~~~~~~~~~~~~~~~~~~~~~~~~~~~~~~~~~~~~~~
~~~~~~~~~~~~~~~~~~~~~~~~~~~~~~~~~~~~~~~~~~~~~
More slides from the C.A.R. forecast:
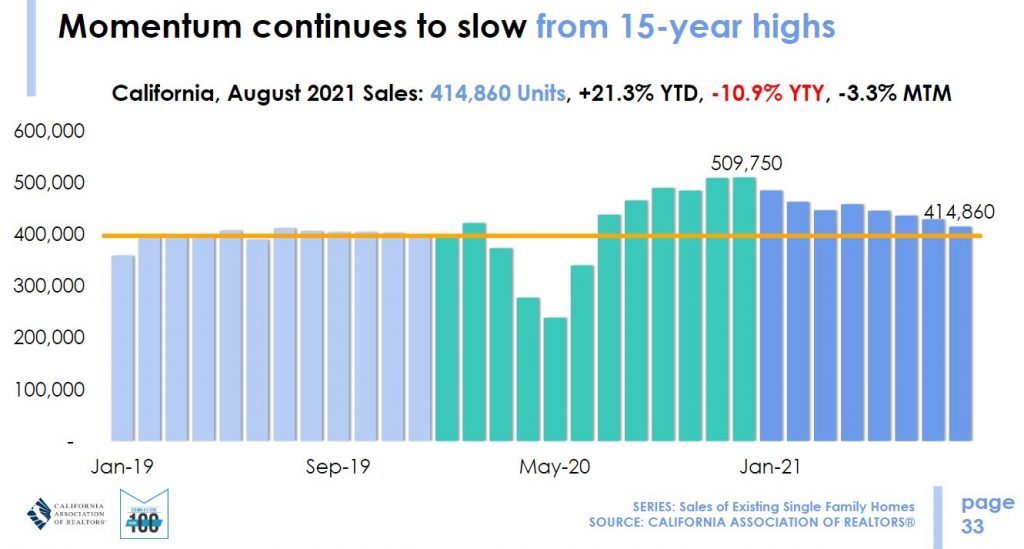
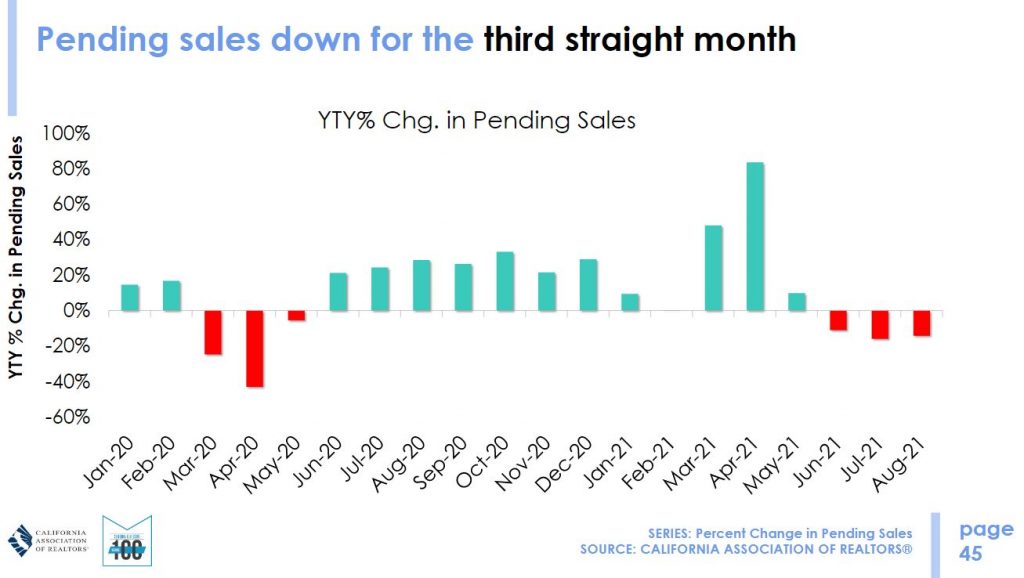
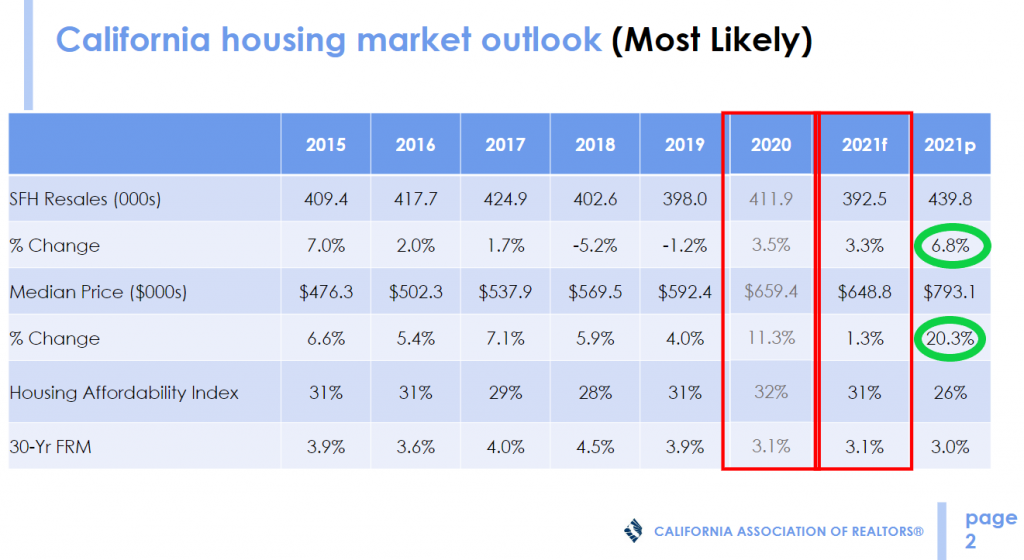
They are forecasting a 5.2% YoY drop in sales in 2022, after we will likely set the all-time record for sales here in 2021. They are probably considering the slowdown in pending sales:
~~~~~~~~~~~~~~~~~~~~~~~~~~~~~~~~~~~~~~~~~~
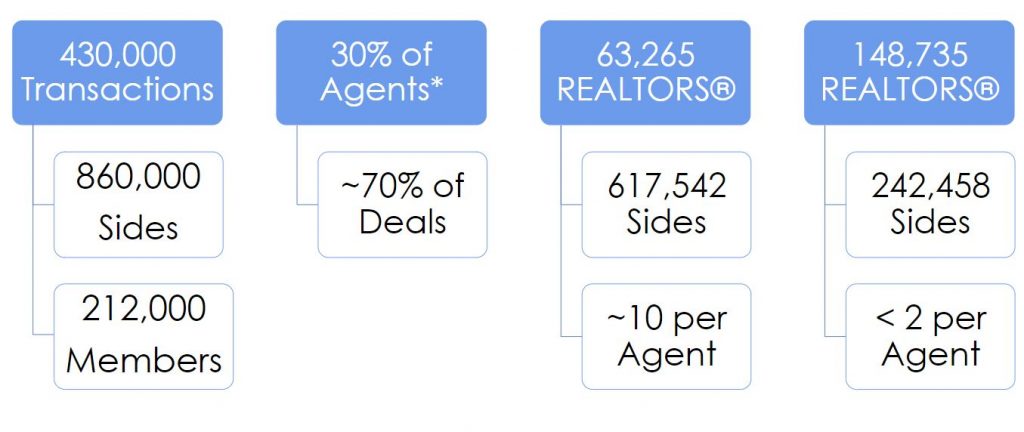
They also showed how 70% of the business is done by 30% of the realtors….and the rest of the agents are barely in business with less than two sales per year:
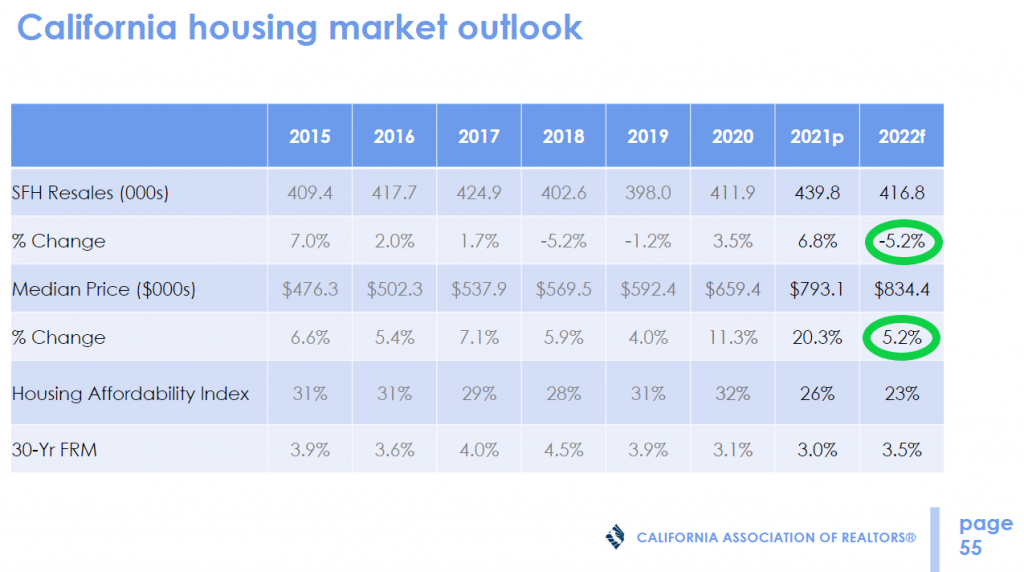
The association is predicting that home sales in California will drop next year, but has a typical guess for the statewide median sales price – expecting a 5.2% rise in 2022:
2022
Their predictions for this year were terrible – they thought pricing would go nearly flat in 2021 (in red box), and instead we had the biggest gain ever (p is projected):
2021
These were my guesses for this year:
MY 2021 PREDICTIONS:
We will have 10% more NSDCC listings than we had in 2020.
We will have 10% more sales.
We will have a 10% increase in the NSDCC median sales price.
Here’s how this year looks through the first three quarters of 2021:
Year
# of Listings (%YoY)
# of Sales (%YoY)
Median Sales Price (%YoY)
2019
3,947
2,148
$1,320,000
2020
3,677 (-7%)
2,207 (+3%)
$1,424,000 (+8%)
2021
3,078 (-16%)
2,535 (+15%)
$1,880,000 (+32%)
NSDCC inventory DROPPED 16%, yet sales ROSE 15% this year! Pricing is +32%!
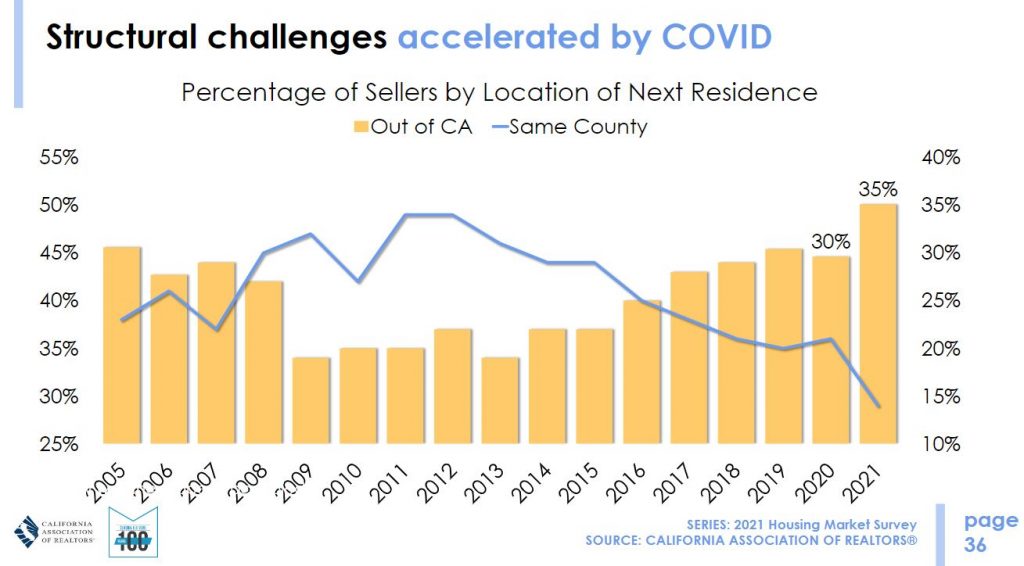
A graph showing how more people need to leave town to make it worth moving:
A CAR consumer survey showed, for example, that 35% of home sellers are moving out of state and fewer than 15% were moving to a home in the same county as their last residence. “I think that pressure to migrate out of the state is going to be just as strong, if not stronger, as housing, affordability gets worse,” CAR Chief Economist Jordan Levine said. “I think that this is a housing-driven phenomenon, and we don’t have a lot of relief in terms of housing affordability.”
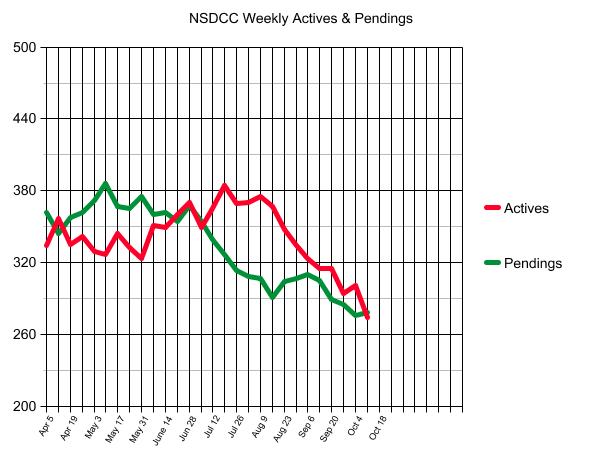
A year ago, there were 605 active listings between La Jolla and Carlsbad, and 470 pendings.
Today, there are 274 actives, and 278 pendings (which is -55% and -41% YoY).
Buyers didn’t hit the brakes last year when we had twice as many actives, so it will probably take a 100-year flood of inventory to crash the market. It’s more likely to go the other way, and the inventory will likely remain low in 2022…..with more fixers than creampuffs!
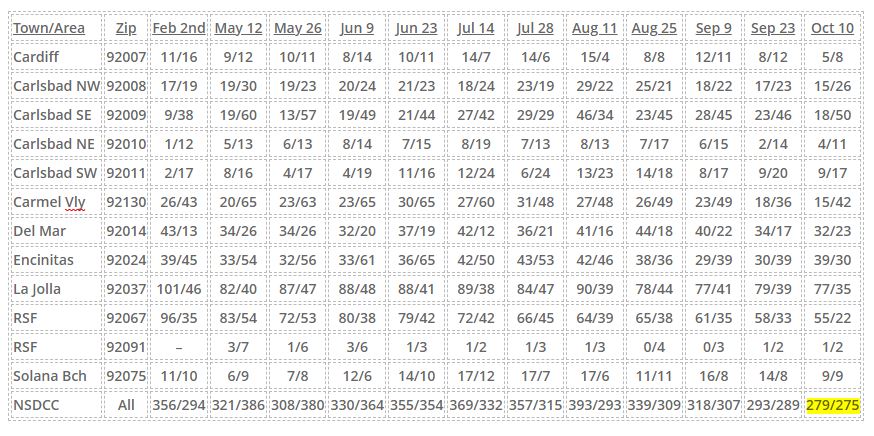
The reason for breaking down the active and pending listings by zip code is to give the readers a closer look at their neighborhood stats.
The number of pending listings is almost the same as the number of actives. It’s feasible that their paths could cross again in the coming weeks as the unsuccessful sellers cancel their listings for the holidays:
NSDCC Active and Pending Listings
But with fewer homes for sale combined with the time of year, we probably won’t see much change. Let’s call it low-grade frenzy conditions for now.
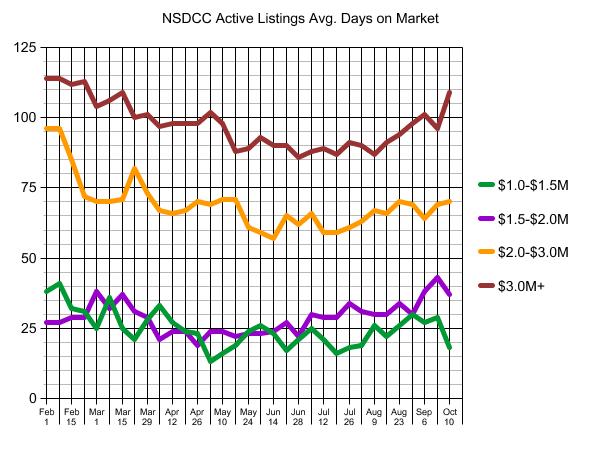
How about the average days on market?
Some of the high-enders have been hanging around a while, but the rest are moving!
It’s fascinating that the average days-on-market for ALL pendings is 33 days, and the median is 16 days. For those 65 pending sales over $3,000,000, the average DOM is 54, and the median is 43 – it doesn’t take months to sell in this market.