The latest read is a sign that housing continues to show strength as home prices rise at more than double the rate of inflation, said David M. Blitzer, managing director and chairman of the Index Committee at S&P Dow Jones Indices.
“The general economy appeared to slow slightly earlier in the fall, but is now showing renewed strength,” he said in a statement.
Though most analysts now expect the Federal Reserve to raise interest rates at its December meeting, that prospect is not likely to push 30-year conventional mortgage rates much above 4 percent, Blitzer said.
Google is teaming up with Zillow to provide a mortgage platform for consumer shopping. How much longer before they do the same thing with realtors? A year? A month?
Well, it’s official. Google has come to mortgages.
After first being reported earlier this year, Google is launching its own mortgage comparison tool via its Compare service.
“Google Compare for mortgages provides a seamless, intuitive experience that connects lenders with borrowers online,” Google posted on its website Monday.
“Whether you’re a national lender or one local to California, people searching for mortgages on their smartphone or desktop computer can now find you, along with a real-time, apples-to-apples comparison of rate quotes from other lenders — all in as little as a minute,” Google continued.
“Borrowers can also see ratings and read helpful reviews, and enter relevant information — like loan amount, estimated credit score, or home value — to receive rate quotes that match their needs,” Google said. “They can then visit your website to apply directly online or over the phone through one of your agents or loan officers.”
Powering Google Compare for mortgages will be Zillow Group and LendingTree, both of which announced Monday that they will be partnering with Google to provide mortgage information to the search engine monolith.
According to Zillow, lenders who use Zillow Group Mortgages for their marketing efforts will now have their rates, ratings and reviews prominently displayed on both “the world’s most popular search engine” and “the most visited real estate media network in the country.”
Zillow’s announcement goes on to say that Google has worked with a number of providers to provide a diversity of relevant results and purchasing options to users.
“With today’s launch, borrowers searching for mortgage custom quotes on Google Compare for Mortgages will now have seamless access to Zillow’s industry-leading real-time lender rates, reviews and ratings on both desktop and mobile devices,” Zillow said in a statement.
“The mortgage shopping experience allows borrowers to shop anonymously, browse through more than 200,000 local and national lender reviews published on Zillow and choose to contact the lender best suited to meet their needs.”
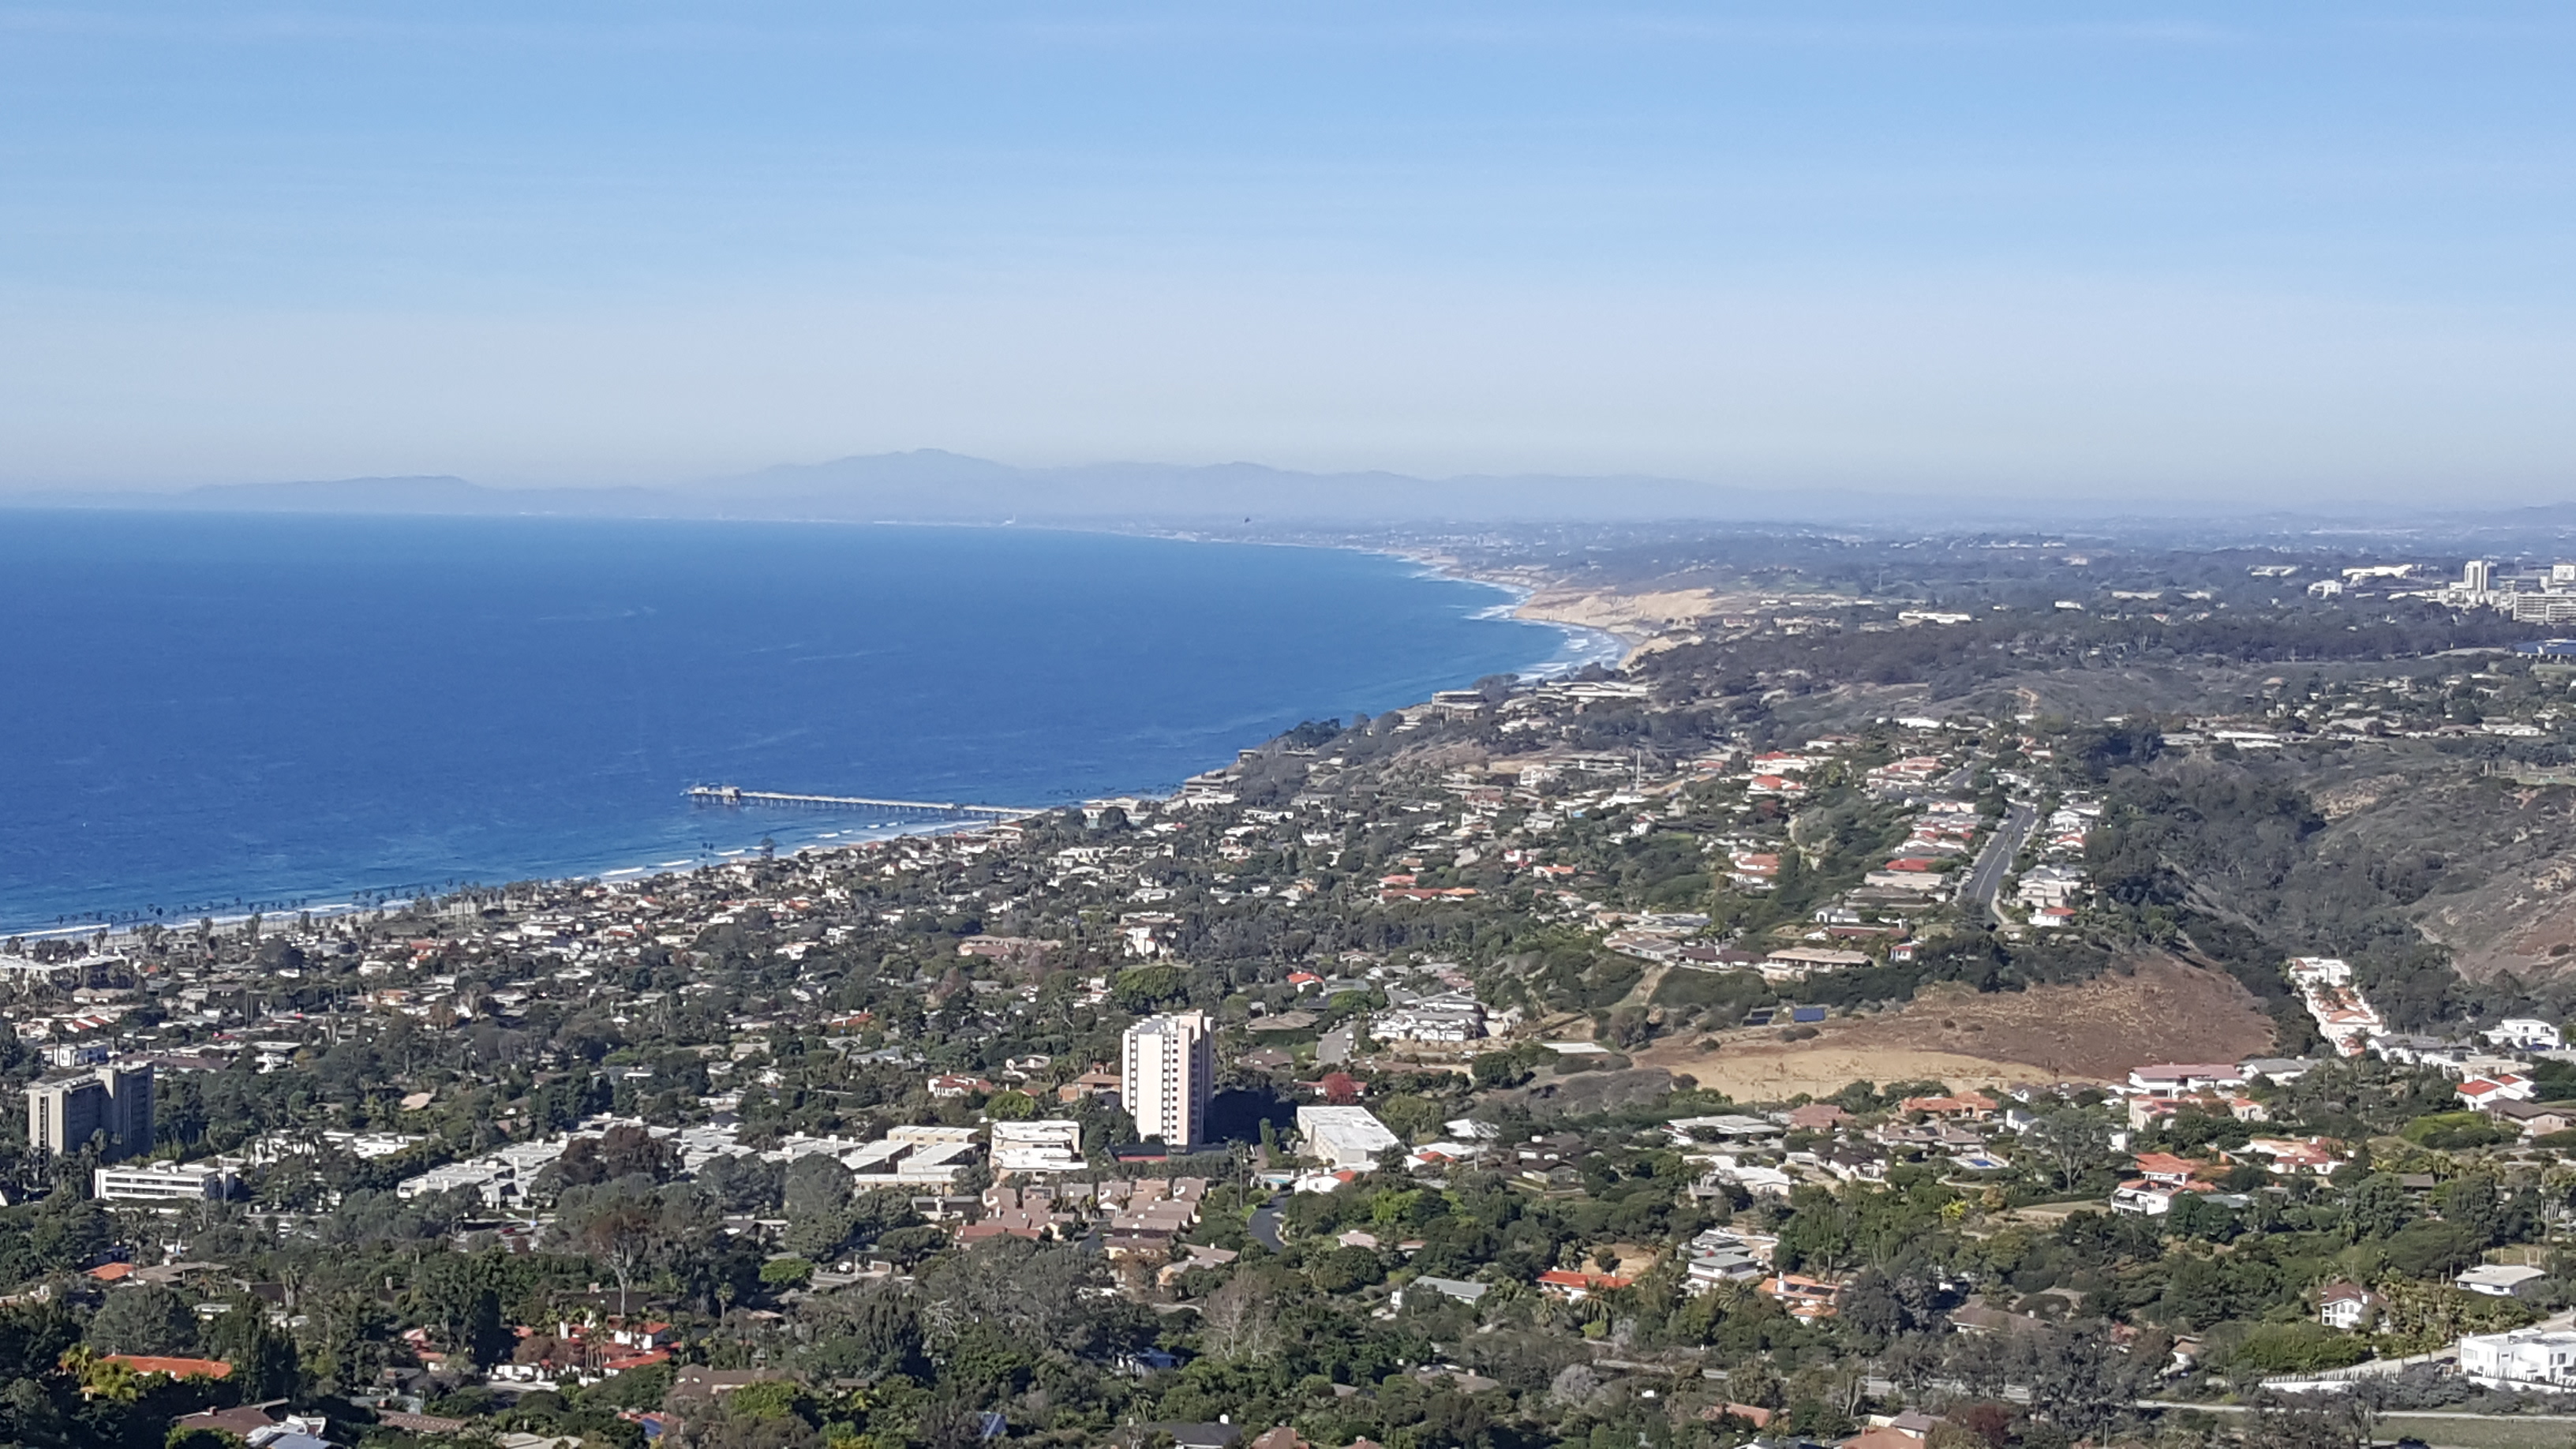
The stretch between La Jolla and Carlsbad is an affluent area!
Below is the annual number of houses sold for $1,000,000 or more – and 2015 still has six weeks to go with 214 sales pending! Just the sheer number of higher-end sales is impressive. General median pricing looks flat though.
Year
Annual Number of Million-Dollar Sales
Median Sales Price
2011
914
$1,420,000
2012
1,128
$1,460,000
2013
1,483
$1,487,000
2014
1,461
$1,525,000
2015
1,504
$1,500,000
Click on the link below for the complete NSDCC active-inventory data:
Have you noticed that some listings aren’t on the real estate portals?
There are two ways that it can happen.
There used to be an agreement between our MLS company, Sandicor, and Zillow/Trulia, to upload our listings automatically. But as a result of a dispute between them over the last year, there is no auto-upload. Some agents don’t know that they have to manually upload their listings, or wait for their brokerage to do it for them.
That’s the reason you’ll see a listing on other portals but not Zillow/Trulia.
But some MLS listings aren’t on any portals – even realtor.com.
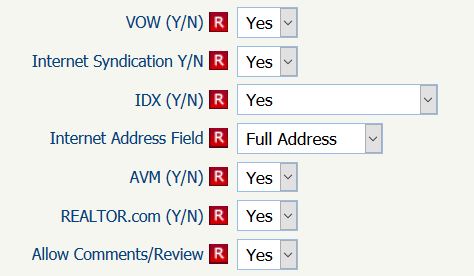
How does that happen? Below is a snip of the actual online listing input form. The red Rs mean that they boxes are required to be completed, and the default answer is ‘Yes’:
If you see a sign in a yard, or get a listing direct from the MLS and can’t find it anywhere on the real estate portals, it means that the listing agent has clicked ‘No’ to several boxes to be excluded. The agent has deliberately chosen out.
But there are still other holdouts. If you are thinking of selling your home, a good question to be asking a potential listing agent, “Will my home be advertised on the real estate portals?”
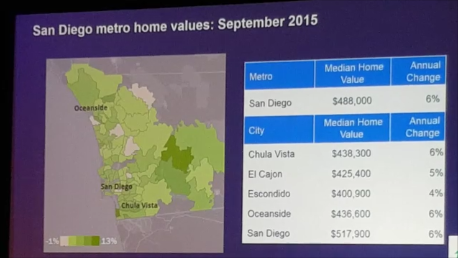
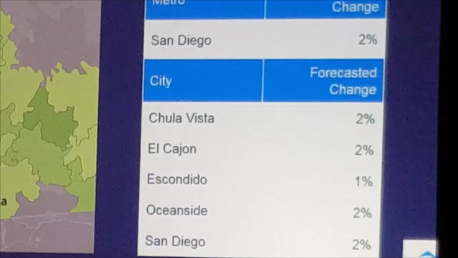
The Zillow folks offered up their forecast for the San Diego area. Below is the actual change in their home-value index for the 12 months ending in September, and then their forecast for 2016:
Are we heading for flatsville? Let’s see how they did last year.
These were their predicted and actual changes in the ZHVI for the 12 months ending in October, 2015:
Zillow HVI Appreciation Forecast
Prediction
Actual
La Jolla
+1.7%
+6.3%
Carlsbad
+1.4%
+5.9%
Solana Beach
+1.2%
+6.4%
San Diego
+1.2%
+6.4%
Del Mar
+1.0%
+1.1%
Carmel Valley
-1.0%
+5.4%
Encinitas
-1.0%
+7.6%
RSF
-2.0%
+10.1%
They were pretty close for Del Mar!
Zillow claims to have the most sophisticated data and algorithms, yet they were way off. It goes to show you how any forecast is really just a guess.
This looks like a fairly safe forecast – I’ll take the under. FromHW:
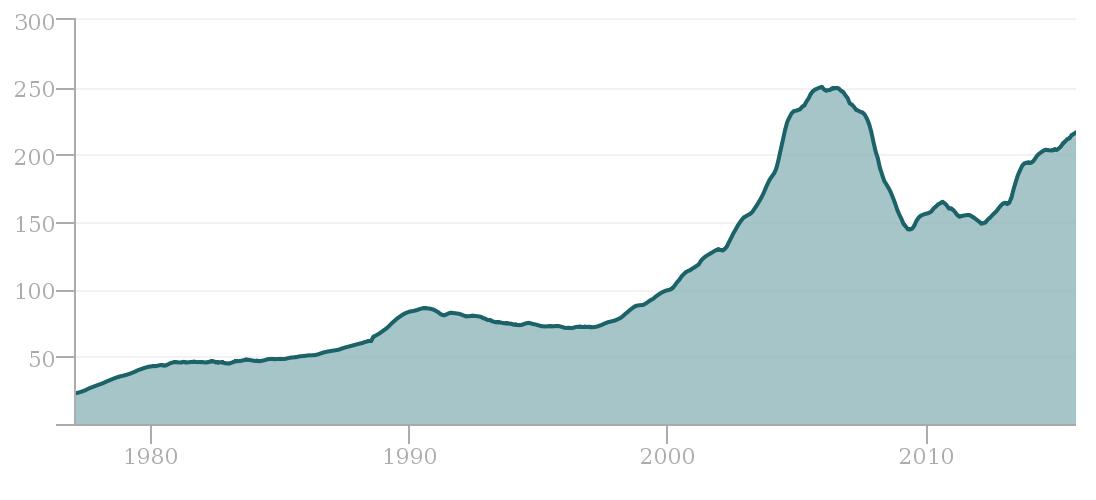
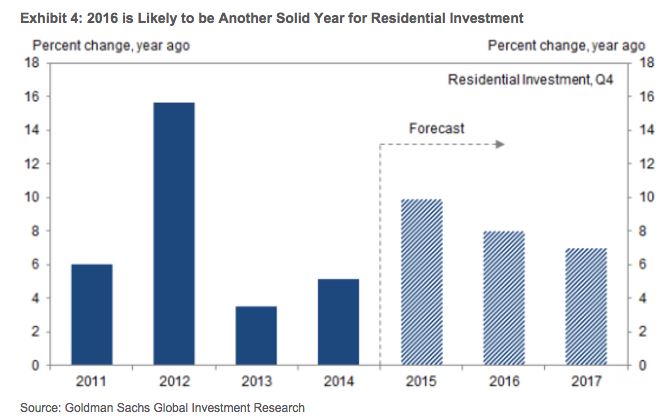
Goldman Sachs sent an email to clients advising that growth in residential investments through 2016 will be solid, though not as strong as they originally hoped. Plus, this growth will likely curtail in the years immediately following as the chart below notes.
The residential investment definition includes all new construction, about half the total of all construction, plus home improvement spending and commissions for real estate brokers.
“We are trimming our expectations for 2016 slightly — lowering our forecast for residential investment to 8% from 11% previously — but we still expect housing to be the top performer among the major components of GDP,” writes economist Daan Struyven, in a note to clients. “Although housing starts are likely to increase at a somewhat slower pace than in 2015, a shift in composition to more single-family building should add to residential investment next year.”
The Goldman note states that residential investment growth is hampered by housing starts, which remain below pace to match demand.
Additionally, the rising interest rate environment expected next year, something the Fed is now openly referring to as “normalization,” will impact mortgage applications, but the Goldman note is unclear to what extent.
“We continue to expect housing to be the fastest growing component of GDP next year,” Struyven adds. “Taking all the components together, we forecast a gain of 8% Q4/Q4 for 2016 residential investment, which would add about 0.3 percentage points to overall GDP growth.”
“Our outlook for new construction in 2016 is mixed. On the one hand, we expect positive but lower growth in housing starts, with 100,000 more starts in 2016 than in 2015 (1.3 million in 2016 vs 1.2 million in 2015), compared to a gain of 150,000 in 2015.
This relative slowing reflects three factors. First, the level of housing starts, while still depressed, is getting closer to its equilibrium level, implied by demographics and demolition rates. Second, unemployment should continue to decline, which should foster household formation, but at a slower pace. Third, Fed hikes, and associated higher mortgage rates, may also reduce the pace at which builders increase starts.”
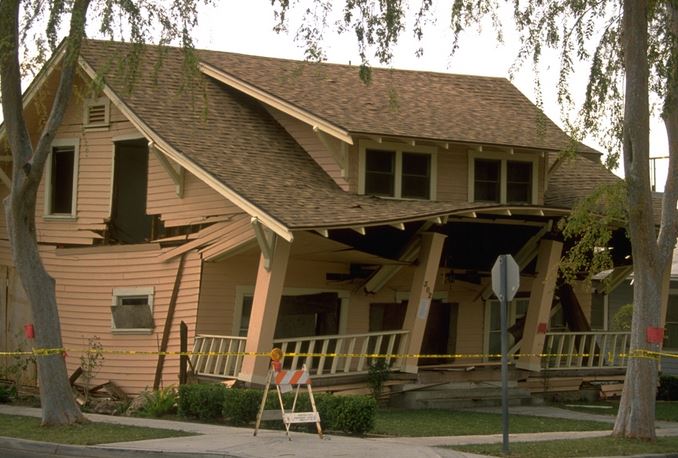
There have been 54 major earthquakes in California since 1900, defined as an earthquake of at least magnitude 6.5, and/or causing loss of life or property damage greater than $200,000, according to the California Geological Survey. The last major earthquake was a magnitude 6.5 and occurred on December 22, 2003 in San Simeon, causing substantial damage in nearby Paso Robles.
With 54 major earthquakes over the past 115+ years, one major earthquake occurs on average every 2.1 years. Therefore, it appears California is well overdue for a major earthquake.
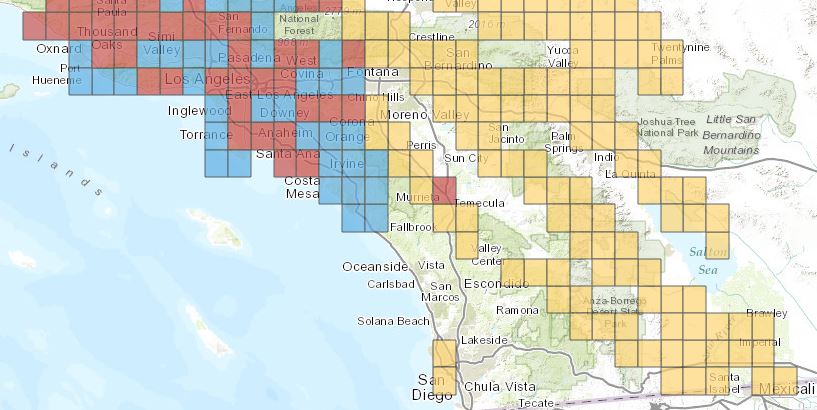
Most of California’s populated areas are located in or near an earthquake hazard zone. The exception is California’s Central Valley, encompassing cities like Fresno and Sacramento (property lying east of I-5 north of Delano and south of Redding). Here, you are as safe as you can be (in California) from earthquakes.
The map above shows a broad picture of earthquake fault zones — the yellow and red boxes — in Southern California (the blue boxes are landslide and liquefaction zones and the red boxes are both earthquake and landslide zones).
There are 105 cities in California that contain earthquake hazard zones (view the list here). However, just because a city is listed doesn’t mean that the entire city is in an earthquake hazard zone. To find out if a specific property is located in an earthquake hazard zone or any other hazard zone, view maps at the property’s local planning department.
If you would have told me that Johnny Rotten was still alive, I would have said “No way”. But he is, and still performing with his second major band, PIL – how many punk rockers can say that? Here’s how he looked as one of the Sex Pistols in 1978 when he was probably the third best player behind Steve Jones and Sid Vicious: LINK.
Pardon the ad in the beginning – I try to avoid those: