In last Saturday’s blog post, I mentioned three reasons why San Diego real estate was undervalued, and pondered that there are new market forces in play that we haven’t seen before.
While people will scoff at the idea that it could be different this time and insist that the market will always revert to the mean, there are new factors to consider that will have impact on the eventual outcome:
LESS SUPPLY
No foreclosures
Ultra-low rates locking in homeowners to their forever home.
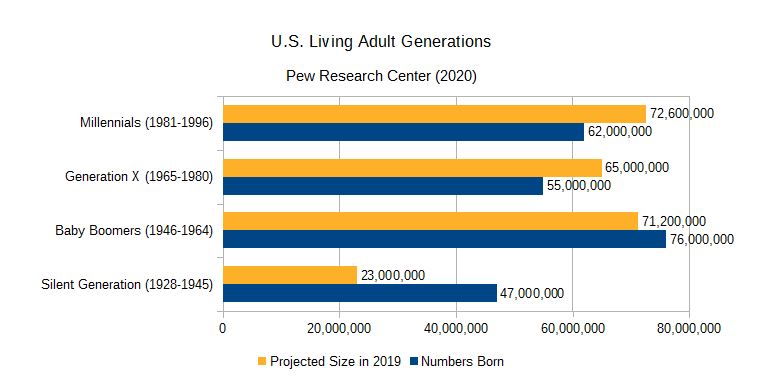
Boomers are older than ever, and are aging-in-place (too old to move).
Holding real estate has never been so sexy.
Longest expected length of ownership ever.
MORE DEMAND
Population is more affluent than ever (SD County has 100,000+ millionaires, fifth in USA).
Work From Home has expanded the choices for buyers, increasing the demand in desirable areas.
Hoarding real estate is cool (high rents, kids to inherit).
Current homeowners have more equity than ever to use when buying again.
There are more people than ever in the homebuying ages.
We probably only needed supply OR demand to change by 5% or 10% to make a difference. But it seems like BOTH have changed more than that….in opposite directions, which has really stirred it up.
It used to be that when home prices were hitting new highs, sellers would come out of the woodwork to take advantage. But not this time – which is different!
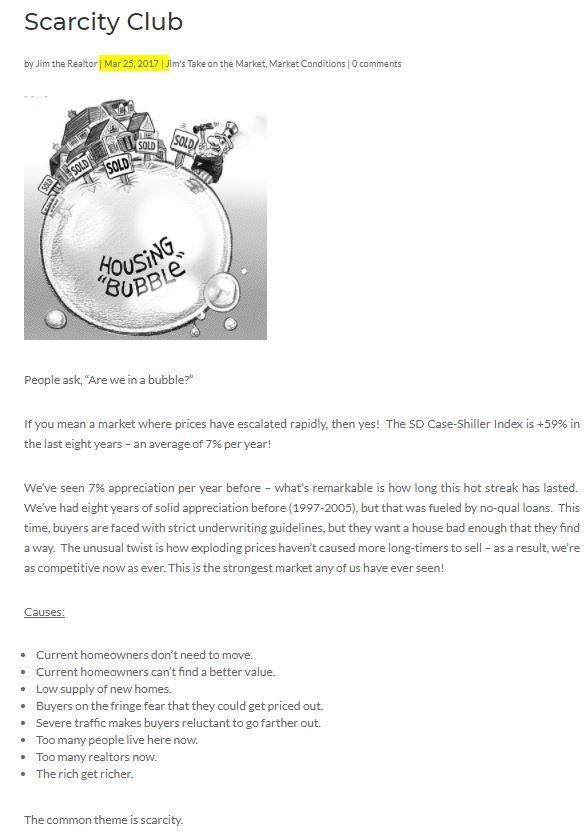
The frenzy conditions have been building for years – see this old blog post from 2017 (above).
We were discussing it all through the second half of last year that the 2021 Frenzy was going to be huge, and the signs were so obvious that even Ray Charles could see them!
But the foundation of people buying their forever home with a low-rate mortgage has been on-going since the last crisis bottomed out in 2009.
San Diego really should enjoy frenzy conditions longer than most areas – maybe longer than any area!
Interestingly, a check of our buyers, and buyers of our listings over the last 18 months shows that about 80% of them were local residents. We’ve had people move here from the Bay Area, Chicago, and NYC, but for the most part it has been move-uppers and move-downers. Results may vary!
I’ve been leaving my buyer & seller tips for dealing with frenzy on our Instagram Reels @klingerealtygroup. Here is a compilation of ideas you might not hear elsewhere:
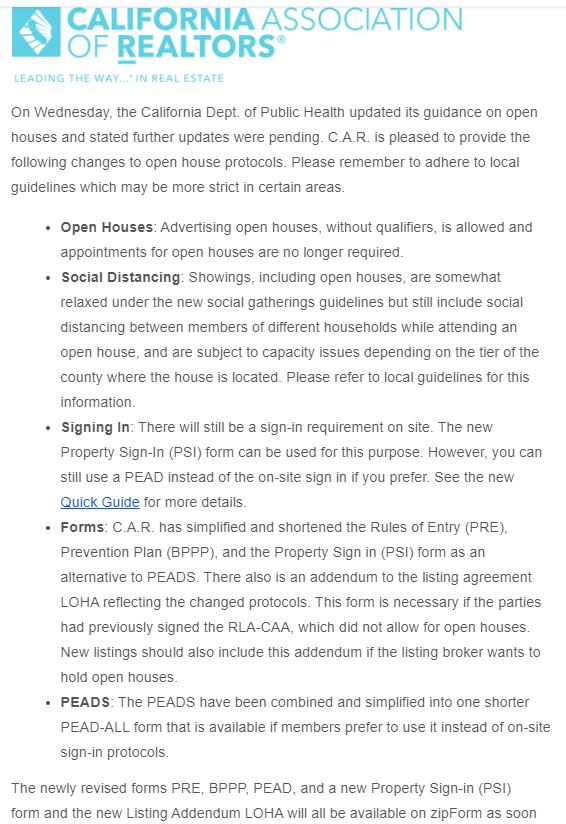
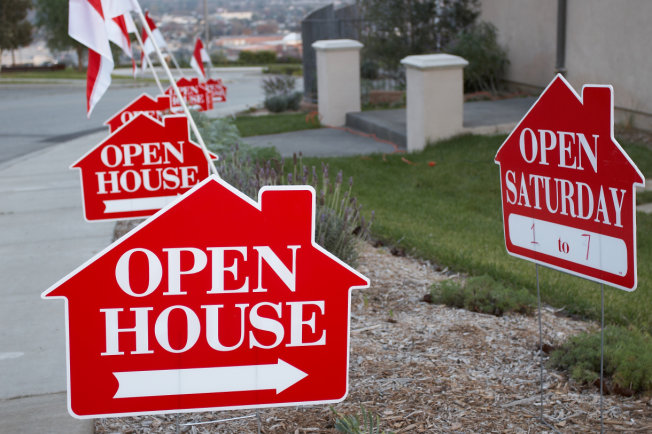
With the California Department of Public Health allowing open houses now, it would seem that we are getting back to normal. The industry has done open houses for 100 years, so taking a few months off shouldn’t inhibit the practice from coming back.
Or will it? It will.
Why? Because the covid-frenzy has condensed the selling process into a weekend. We only show homes by appointment now, and many listing agents demand that buyers show proof of ability to purchase just to see the home. It makes for a clean and tidy 5-30 qualified appointments over the first couple of days on the market, and then pick a winner. Job over.
Listing agents will resist having to work any harder. Instead, they will adopt the appointment-only plan, and then convince sellers that they don’t want random people wandering around their house.
What are the benefits of open houses? Why would we want them to come back?
REASONS TO HAVE OPEN HOUSES
The main reason to do open houses is to create real or imagined urgency – the fear of missing out. There is nothing better to motivate a buyer than to see other competitors roaming around the house at the same time – it makes them think that they will lose out if they don’t act promptly. Sellers deserve this benefit.
While demanding to show proof of ability-to-buy sounds good, it eliminates those legitimate buyers who do have the ability to purchase, but don’t want to show their financials just to see a house. We want to include these buyers who are currently shut out from the process. I know there will be agents who will scoff and declare that any buyer who is unwilling to show their underwear just to see a house isn’t a serious buyer anyway. But it’s just an excuse – the minute the frenzy is over, you’ll be back to showing homes to anyone with a pulse.
Interacting with buyers in person helps agents keep their chops up.
C.A.R. will be releasing more open-house guidance tomorrow. They will insist on booties and masks, and they might include a modified registration book where attendees state that they don’t have covid.
But don’t be surprised if agents are slow to adopt the old-fashioned open house techniques.
The California Dept. of Public Health has just updated its guidance on open houses, and further updates are pending. The following is now on live on the COVID-19.ca.gov website. C.A.R. will be providing more details regarding this guidance so that REALTORS® are in full compliance, but the following is the information currently on the California State official website:
Shown properties, like open houses – effective immediately
In-person showings of properties, like open houses, are permitted and must follow the indoor gatherings capacity limits in the CDPH gatherings guidance. Check the Attendance section of the gatherings guidance for the capacity limits for each tier.
Open houses will be excellent for transparency and frenzy intel – just how heavy is the demand?
I already guessed that the runaway frenzy will start to temper in June. Here are reasons:
Some of the craziest demand has been satisfied.
Other buyers will take a break and go on vacation.
Overly-optimistic pricing by some sellers.
It’s been red-hot for 10-12 months.
Newsom says the state will be 100% open by June 15.
Covid-19 has been blamed for why many potential sellers have delayed their plans to sell. But now that the pandemic is wrapping up and sellers have had a +20% gift of appeciation dropped in their lap, you’d think they would be flooding the streets with inventory.
But there’s no flood yet. In May, 2019 we had 502 NSDCC homes come to market, but so far this month we’ve only had 119 new listings.
Could more inventory be coming?
Prop 19 was heralded as the solution to get seniors moving again – but we’re still waiting. They should stop discriminating against younger people and let everyone take their old property-tax basis with them to their next home.
Owners of investment properties should be expediting their plans to trade for newer/better homes before they change the 1031 rules. This article says that investors will still be able to defer taxes on the first $500,000 profit, but Uncle Joe wants to tax the rest. Americans hate the idea of paying taxes, so they will just keep their old property, rather than selling – which means less inventory.
Any potential seller who wants to stay local doesn’t see many homes that would make it worth the hassle of moving. Sure, selling their home sounds great, but we’re to the point where you need to leave town to really cash in – but who wants to do that?
Sellers have the most ideal market conditions of all-time to sell their home, yet they are holding back.
If we do see a slowdown this summer, it won’t be because of a flood of inventory. It will be due to prices having gone completely bonkers – price will fix anything!
In the last week, there were 90 new listings between La Jolla and Carlsbad, which is the highest weekly number of the year. The total number of pendings also hit its YTD high for 2021:
NSDCC Weekly Listings & Pendings
Week
Number of New Listings
Number of New Pendings
Total Number of Pendings
Jan 4, 2021
35
33
284
Jan 11
57
49
271
Jan 18
56
64
278
Jan 25
46
52
280
Feb 1
55
74
306
Feb 8
45
66
316
Feb 15
60
65
332
Feb 22
71
71
338
Mar 1
54
67
346
Mar 8
43
75
366
Mar 15
70
53
333
Mar 22
58
61
354
Mar 29
69
57
363
Apr 5
68
66
362
Apr 12
67
61
344
Apr 19
59
69
358
Apr 26
71
65
362
May 3
65
85
372
May 10
90
75
386
The frenzy is at that stage where any additional listings of quality homes at decent prices will fuel more action – making it crazier. But more sellers are pushing their list prices to unimaginable numbers, which could slow the trend.
Trustindex verifies that the original source of the review is Google.
We sold a home with Jim and Donna and from beginning to end they were consummate professionals. Their initial walk through the property resulted in a list of items to be repaired or updated. They supplied a list of vendors and job quotes to do the repairs and updates. We originally wanted to sell ‘as is’ and just get it over with. They gave us a selling price for ‘as is’ and options for doing a few updates/repairs to doing it all with the selling price for each option. We agreed to do all they suggested and we sold for the exact price they predicted. For every dollar spent we got back more than $2 back in the selling price. And they got that price in a rising interest rate environment! Donna and Jim are extremely detailed and guide you through ever aspect of the sale. There were no surprises thanks to their guidance. We couldn’t be more pleased with their representation.
Thank you Donna and Jim,
Jerry and Mary
Heather Quejada
March 27, 2025
Trustindex verifies that the original source of the review is Google.
We have known Jim & Donna Klinge for over a dozen years, having met them in Carlsbad where our children went to the same school. As long time North County residents, it was a no- brainer for us to have the Klinges be our eyes and ears for San Diego real estate in general and North County in particular. As my military career caused our family to move all over the country and overseas to Asia, Europe and the Pacific, we trusted Jim and Donna to help keep our house in Carlsbad rented with reliable and respectful tenants for over 10 years.
Naturally, when the time came to sell our beloved Carlsbad home to pursue a rural lifestyle in retirement out of California, we could think of no better team to represent us than Jim and Donna. They immediately went to work to update our house built in 2004 to current-day standards and trends — in 2 short months they transformed it into a literal modern-day masterpiece. We trusted their judgement implicitly and followed 100% of their recommended changes. When our house finally came on the market, there was a blizzard of serious interest, we had multiple offers by the third day and it sold in just 5 days after a frenzied bidding war for 20% above our asking price! The investment we made in upgrades recommended by Jim and Donna yielded a 4-fold return, in the process setting a new high water mark for a house sold in our community.
In our view, there are no better real estate professionals in all of San Diego than Jim and Donna Klinge. Buying or selling, you must run and beg Jim and Donna Klinge to represent you! Our family will never forget Jim, Donna, and their whole team at Compass — we are forever grateful to them.
Lou F
March 27, 2025
Trustindex verifies that the original source of the review is Google.
WeI had the pleasure of working with Klinge Realty Group to sell our home in Carmel Valley, and I cannot recommend them highly enough!
Jim and Donna demonstrated exceptional professionalism, offering expert guidance on market conditions and pricing strategy, which resulted in a quick and successful sale.
Communication was prompt and we were well-informed throughout the entire process.
For anyone looking for a dedicated and knowledgeable real estate team, look no further!
---
William Sams
March 25, 2025
Trustindex verifies that the original source of the review is Google.
Donna and Jim Klinge of Klinge Realty Group have our highest possible recommendation. From Donna and Jim’s first visit to our house through closing their advice and counsel was candid and honest in all dealings. They kept us fully informed throughout the process. The house sold less than three days after listing with a two-week closing. My wife and I have sold several houses during our lives. This was by far the best experience. Klinge Reality is a premium service realtor. You can’t make a better choice for someone to sell your home fast and for top dollar.
Emily Hernandez
December 29, 2024
Trustindex verifies that the original source of the review is Google.
Donna and Jim provided exceptional support and professionalism throughout the entire process. We couldn't have been happier with their efforts. They made our house shine, and thanks to their expertise, it sold above the listing price in the very first weekend! Truly a fantastic experience from start to finish.
Jesus Adrian Sahagun
November 11, 2024
Trustindex verifies that the original source of the review is Google.
This year has been difficult on our family, mainly due to having to sell our home. Thankfully we knew God had a plan for us and working with the Klinge team was a key part of it. It was an obvious decision to work with them again after such an amazing experience when purchasing the same home we needed to sell. The challenge was, how will we do this in so little time with so much going on? Jim and Donna held our hand every step of the way. Whenever an unexpected issue arose they found and provided a solution. Never once did we feel pressured to make a decision and the Klinges were always reassuring after providing the information that the decision was ours to make. Despite the curve balls, they never panicked and exemplified the “can do” attitude, making us feel optimistic and taken care of. Their expertise and professionalism was superb. But of all the reasons to work with the Klinges, the most impactful and valuable is their compassion and genuine care for their clients. We pray that we can one day purchase our forever home and you better believe that Jim and Donna will be representing us - as long as they will have us of course. Thank you again Klinge team! Your execution, experience, and care are unmatched.
SABIHA PASHA
July 23, 2024
Trustindex verifies that the original source of the review is Google.
Jim and Donna were fantastic! Jim understanding my needs, recommending potential places, pointing out the pros and cons of each property was invaluable. Then when the offer was accepted Donna’s organized guidance through the inspections, paperwork etc made the whole process seem effortless.
So grateful that I had them on my side!
Anu Koberg
July 13, 2024
Trustindex verifies that the original source of the review is Google.
We first found Jim through his blog at bubbleinfo.com, which really showcased his knowledge of SoCal real estate. Since then we've done three transactions with Jim and Donna, and they are an incredible full service agency, with Jim's deep market insight and Donna's deft contract and project management. We trust them implicitly in their analysis and strategy, which is based on years of experience. They're always available and on top of things, and we strongly recommend them to anyone.
Bjorn Isachsen
July 10, 2024
Trustindex verifies that the original source of the review is Google.
The Good
The Klinge Realty Group operates like a finely tuned machine, with a very personal touch. We contacted them on a Sunday and they were talking to us about our family and our needs on our living room couch the following day. They carefully listened to us and worked with us to identify the best and quickest path to listing within 2 weeks to take advantage of the low inventory conditions in our South Carlsbad neighborhood. They knew our tract specifically and had many previous sales there over the years - they came prepared with a thorough analysis of comparative sales and recommended a pricing strategy that they felt confident would yield offers the first weekend on the market.
The Great
Over the next two weeks Donna coordinated a range of vendors who she knew from experience could get the preparation to list work we needed done on time and with high quality. Our light tune-up involved excellent experiences with their stagers, landscapers, contractors, electricians, and plumbers. Throughout this period Donna's daily communication was clear, concise, and responsive. Any time we had questions Donna picked up the phone or texted immediately - but almost always, she answered our questions before we even knew we had them.
The Outstanding
We had a tricky situation with a shared fence that could have delayed our escrow. Donna used superb mediation skills to negotiate the terms of replacement and was personally on site with the fence contractor to make sure everything went smoothly. The fence looks great and escrow closed on time.
The Truly Exceptional
Our house came on the market on a Wednesday and between then and Monday morning Jim was personally at all three open houses. He was in constant communication explaining potential buyer reaction and strength. As he predicted offers began to come in on Saturday and each one was incrementally higher than the last. At the end we had 5 offers, 4 of which were over list, and the final accepted offer was $100,000 over list. In addition to being over list it included rent back terms that met our needs.
The Recommendation
For all of these reasons we would strongly recommend The Klinge Team to anyone wanting to sell in North County Coastal San Diego. I had been reading Jim's bubbleinfo.com blog for 15 years and knew when the time came to sell that he would be our first call. Jim Klinge is not your standard realtor. He is keenly aware of market conditions and sales strategies. And, works his tail off - though not as hard as Donna . At this point he's gone from realtor to friend and I plan to have him over to grill and chill at our new place to talk real estate, but also just about life and raising kids in San Diego. He's more interested in relationships than his sales numbers - and that's why his sales numbers are so high. We have already recommended the Klinge's to some close friends and another successful sale is on deck right around the corner...
Chris Shea
June 21, 2024
Trustindex verifies that the original source of the review is Google.
We recently had the pleasure of working with Jim and Donna from Klinge Realty Group to sell our house, and we couldn't be more satisfied with the experience. From the initial meeting, they listened attentively to our needs and provided invaluable guidance on specific improvements to get our home market ready.
Their responsiveness throughout the entire process was truly impressive. Anytime we had questions or concerns, they were quick to address them, ensuring we felt comfortable and informed every step of the way. What stood out the most was their team and extensive network of tradespeople, which made addressing any necessary repairs or updates seamless and stress-free.
Thanks to their expertise and dedication, our house sold quickly and at a great price. We highly recommend Jim and Donna to anyone looking to buy or sell a home. They are a fantastic team who truly care about their clients and deliver exceptional results.