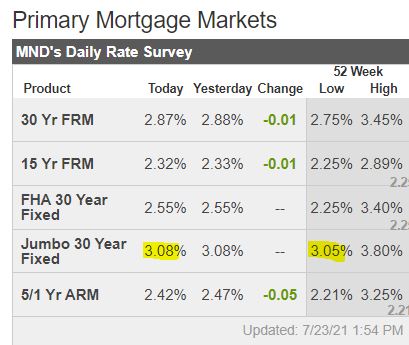
Regardless where the inventory goes (likely to retreat), the potential home buyers should stay interested, just because of rates staying low. Many of them may be looking forward to when the foreclosures start pouring in.
What’s the latest on the delinquencies/forbearances? From Black Knight:
Total U.S. loan delinquency rate (loans 30 or more days past due, but not in foreclosure): 4.37%
Top 5 states by 90-plus days delinquent percentage:
Mississippi: 4.89%
Louisiana: 4.59%
Hawaii: 4.14%
Nevada: 4.14%
Maryland: 4.08%
The takeaway:
The national delinquency rate is at its lowest level since the pandemic hit, even below the pre-Great Recession average.
While there’s been improvement, however, there are still 1.5 million homeowners 90 or more days past due on their mortgages but who are not in foreclosure—nearly four times pre-pandemic levels.
There are 1.5 million homeowners who are 90+ days late but who are not in foreclosure? Do you need any more evidence that lenders aren’t interested in foreclosing? They will give loan mods when they get around to it.
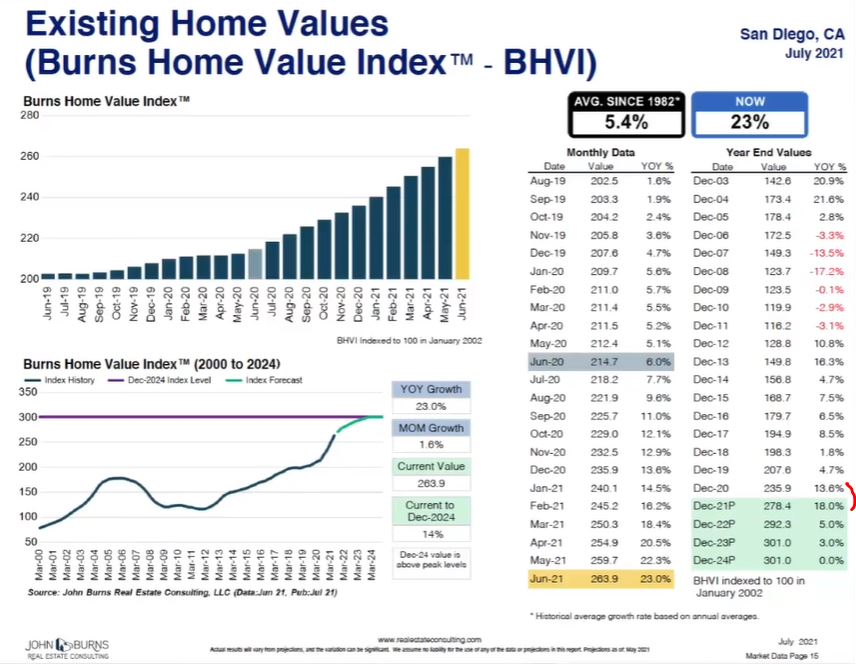
The prognostications are coming in about the direction of home prices.
It’s easy to predict that the market won’t be as hot as it’s been (or will it?).
The Burns forecast will be as good any of the guesses, and don’t be surprised if all of them end up predicting a goose egg over the next 1-3 years as we pull in Plateau City. Sellers shouldn’t mind much, because they picked up a whopping 31.6% increase during the 2020-2021 Greatest Real Estate Frenzy of All-Time.
There will be some potential sellers – probably those who don’t need to move, have plenty of time, and aren’t going to give it away – who are waiting for the market to top out.
You can’t blame them. It’s been a hellava party over the last year, and they don’t want to leave any money on the table. They will be the sellers who provide the extra inventory that will help moderate the pricing.
But I’m going to take the OVER.
There are two things that can cause moderation; sales and pricing.
It’s likely that one of these two things will happen:
Either sales will drop due to ultra-low inventory, and prices keep rising, or
Inventory does increase a bit, which boosts sales – but causes prices to flatten.
The 31.6% increase in pricing did put a dent in the affordability, but homes were already expensive and available only to the affluent anyway. They will still have the horsepower to pay a little more in 2022 and 2023, but they will be more picky than ever about what they are willing to buy.
I’m taking #1, and guess that sales will drop, but sellers who can find a buyer will be getting a premium.
They are predicting that the BHVI will go up 5% next year, and 3% in 2023.
I think the BHVI will rise 10% next year, and 6% in 2023 – and agree with their 0% in 2024.
Abalone Landing Terrace in Carmel Valley has had a typical frenzy – low inventory and rapidly rising prices. There were two sales that closed in 2020 – one $1,650,000 in July and $1,780,000 in October.
At the end of May, 2021 a new listing hit the open market at $1,950,000, and was promptly bid up to $2,120,000. It closed on July 8th, and it must have gotten other residents thinking.
Four new listings have hit the market in the last week:
This is a street of 50 homes, with about half of them still owned by the original purchaser from 2002-2003. After having only three sales in the last two years, the four new listings in a week is shocking!
It’s Carmel Valley, so there probably won’t be an issue with these selling. But it shows how quickly the market can change, and provide the buyers with even more data to consider.
If you ever get famous enough that you might need a direct line – like a batphone – well, then you need to be prepared. A solid red push button will do just fine.
The San Diego Chicken – a legend, and sorry your left hand got clipped.
Rickey! I was at the game when he got his 3,000th hit as a Padre!
Chick, the legend. He was like a father to all of us, talking about our favorite team.
Shaq & Kobe, the duo that won three championships and could have had three more. Between them is the golf ball I used for my only hole-in-one on a legit course in 1994.
Above is my precious two daughters in a photo I took on Esfera Drive when we lived in La Costa. Their beauty overwhelms the wicked full moon in the background.
It’s good to have a few screwdrivers.
Attitude Is Everything
The Klinge name badge, and my grandfather’s business card with home address and phone number!
Mark Kotsay and Phil Nevin both went to Cal State Fullerton (as did Donna and I), and both were the NCAA College Player of the Year. And they both had a great experience with the Padres!
Trevor Hoffman, the Hall of Famer. His kids went to Cathedral when mine did and he participated like a regular guy. He was an incredible baseball player too. Back in the 1990s he threw 95+ gas and blew batters way. But then he developed the wicked change-up that allows him to get 601 saves.
Ken Caminiti is a lesson to us all.
You always need WD-40, DeWalt drill bits, and an extra Master lock. Count on it!
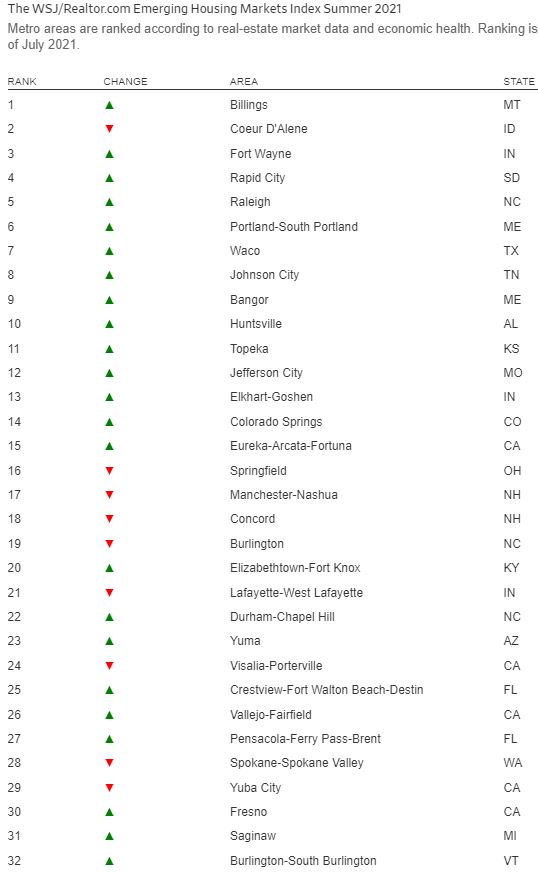
Hat tip to Rob Dawg who sent in this article that suggests Salinas ranks higher than San Diego and Ventura! I cannot find the 60 metro areas on the luxury list they talk about here so not sure about the overall rankings.
Coastal California has seen a surge of interest as buyers continue to expand out from urban hubs in Silicon Valley, San Francisco and Los Angeles.
Four Golden State beach spots jumped into the top 10 on the luxury segment of the second Wall Street Journal/realtor.com Emerging Housing Markets Index, released Tuesday.
They include Santa Maria and Santa Barbara, California, in the No. 1 spot; San Luis Obispo, Paso Robles and Arroyo Grande, California, at No. 5; and Oxnard, Thousand Oaks and Ventura, California, taking the ninth slot on the ranking, the data showed. Salinas, whose greater metro area includes the highly affluent Monterey area, also made the top 10, ranking No. 8 on the index.
These regions, all north of Los Angeles, offer space for affluent families to continue working and schooling from home without having to entirely pull up roots from California.
“In general, there’s a trend toward areas with less density,” Danielle Hale, chief economist for realtor.com, told Mansion Global. “Buyers are looking for places that are less crowded, where they can spread out and have privacy.”
The index, based on June housing data, uses a slate of indicators to assess the prosperity of emerging housing markets. Those include growth in housing supply and demand; median listing prices; unemployment; wages; a cost of living measure; small businesses; amenities and the share of foreign-born residents—who contribute to the vitality and diversity of the area. In its second edition, local real estate taxes have also been considered.
The 60 metropolitan areas reviewed within the luxury segment of the Emerging Housing Markets Index are ranked based on housing data for the top 1% of each market and the weighted sum of those metrics to determine which have the hottest high-end markets.
California has a mix of densities, from big cities to small towns, Ms. Hale continued, which gives affluent buyers options when they are looking for a new residence. That bodes well for markets in what have traditionally been second-home destinations, such as Santa Barbara’s extremely affluent Montecito and Malibu, but also attractive under-the-radar coastal locales like Oxnard.
“The top markets in the mainstream ranking tend to be not necessarily vacation-oriented spots,” Ms. Hale said of the overall, non-luxury rankings, of which Billings, Montana, came in No. 1 this time around. “That’s not true for luxury.”
The influx from more dense areas like Los Angeles is certainly evident in Santa Barbara, according to Billy Rose, co-founder and vice-chairman of The Agency.
“There are bidding wars on nearly every property,” he said. “Homes are being resold not very long after they were purchased for high premiums and agents are peddling pocket listings more than ever.”
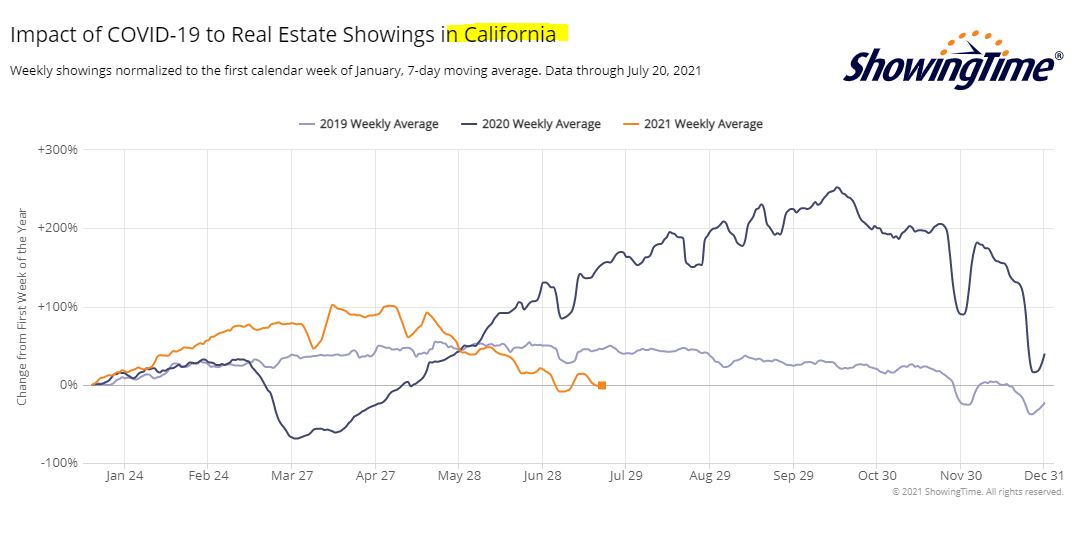
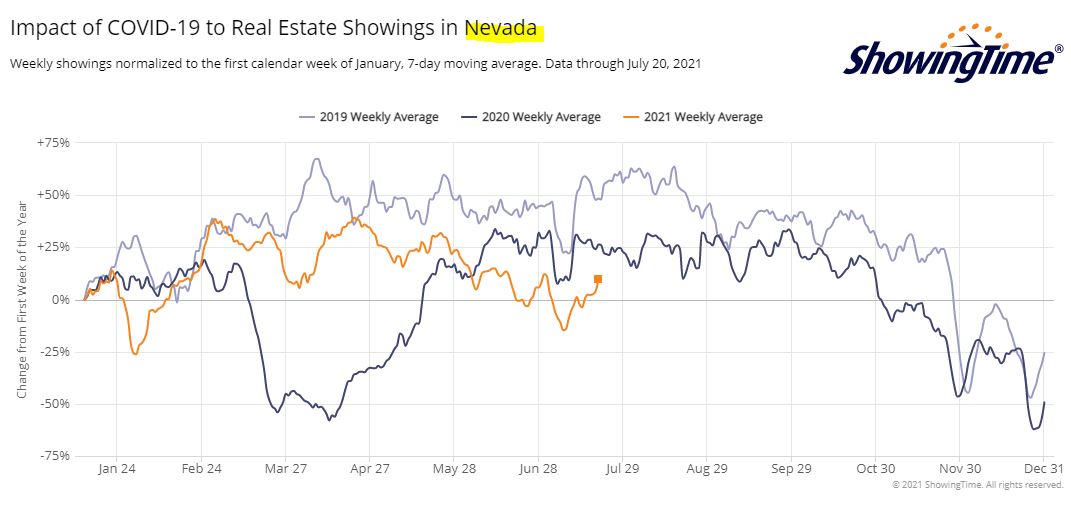
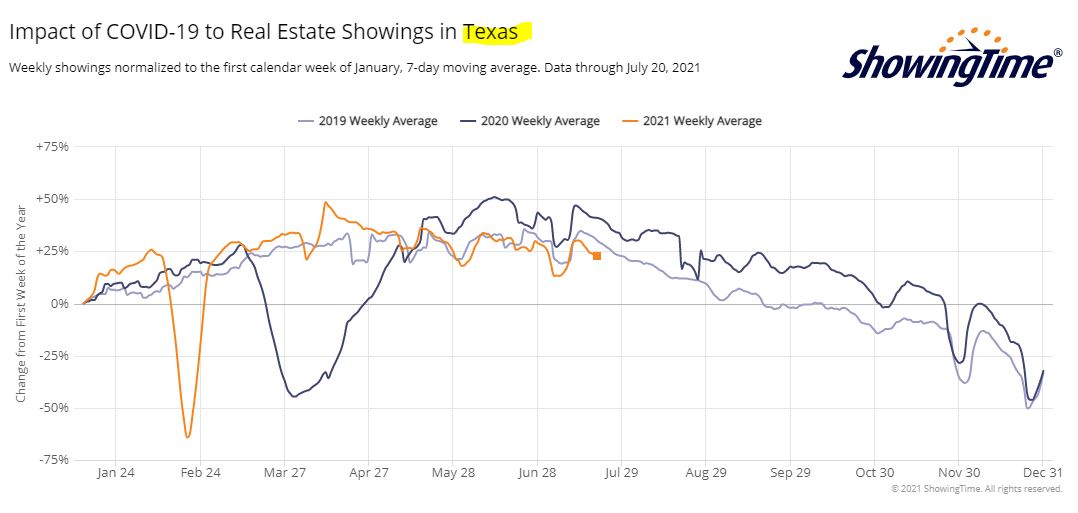
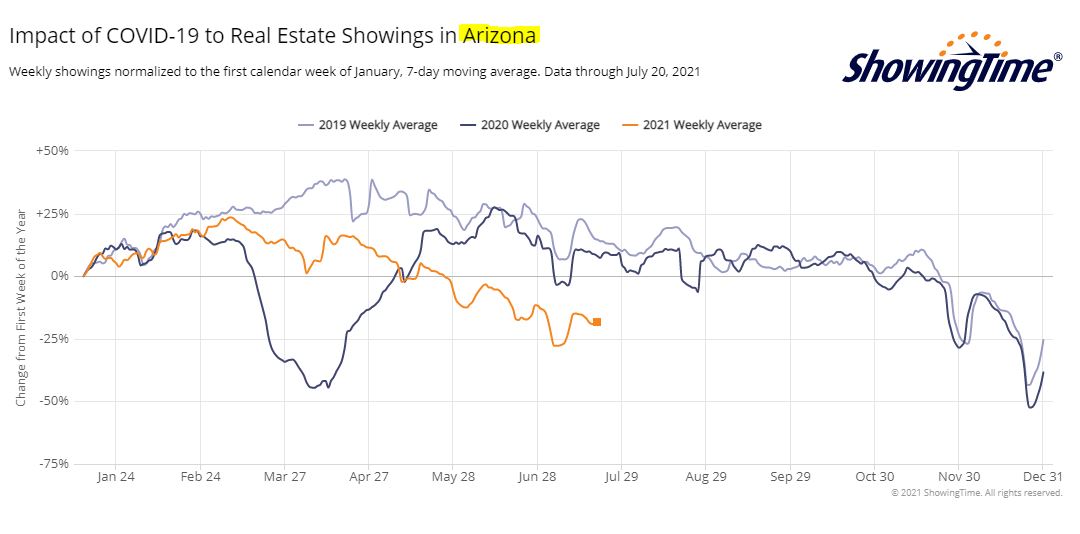
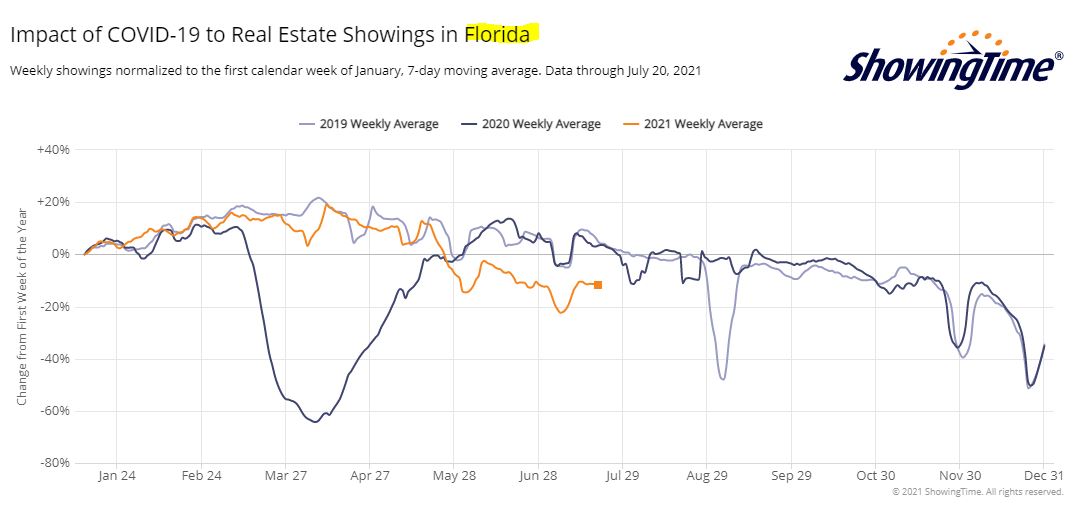
Speaking of other states, how is the cooldown playing out elsewhere? Nevada and Texas are holding up, but towards the end of May, Arizona and Florida started to taper like we did here – and Arizona has been sliding all selling season (maybe due to lack of inventory?):
California is at the 0% line today, which is the same amount of showings as in the first week of January. Arizona and Florida are well under that!
If you are thinking about moving out-of-state, here’s another data point to consider:
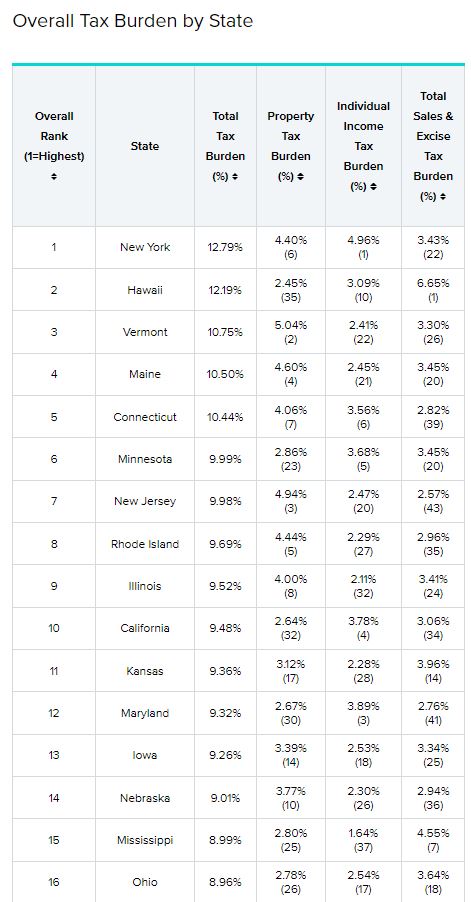
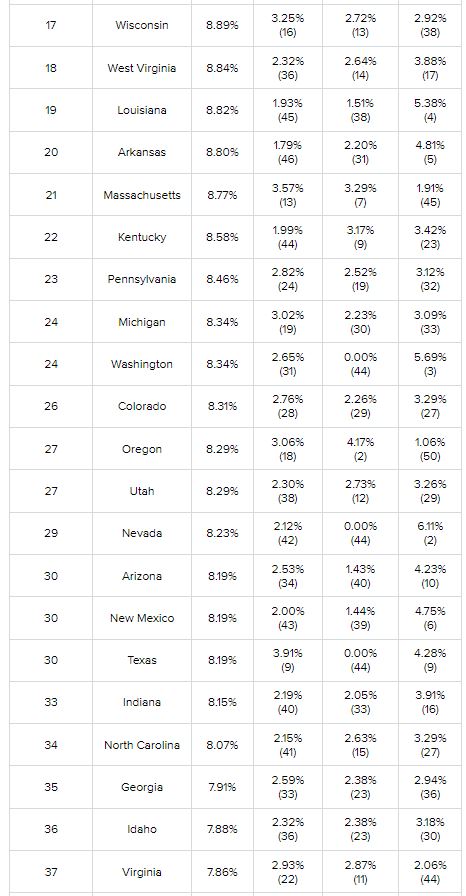
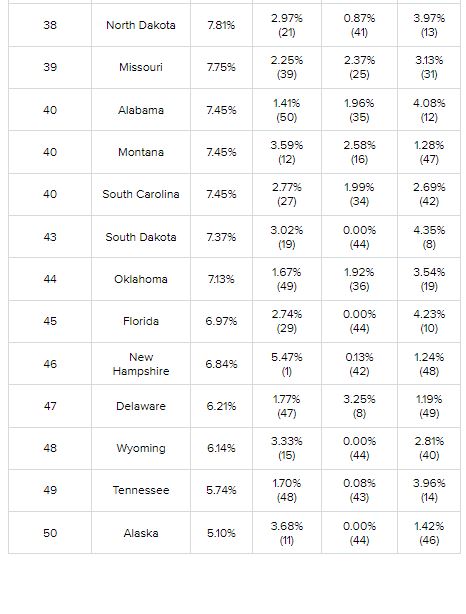
This year, Uncle Sam took his cut of the past year’s earnings on May 17, slightly later than usual due to the COVID-19 pandemic. Many taxpayers are undoubtedly wondering how this year’s Tax Day will affect their finances, as a lot of people are struggling financially as a result of the pandemic.
Since the tax code is so complicated and has rules based on individual household characteristics, it’s hard for the average person to tell how they will be impacted.
One simple ratio known as the “tax burden” helps cut through the confusion. Unlike tax rates, which vary widely based on an individual’s circumstances, tax burden measures the proportion of total personal income that residents pay toward state and local taxes. And it isn’t uniform across the U.S., either.
To determine the residents with the biggest tax burdens, WalletHub compared the 50 states across the three tax types of state tax burdens — property taxes, individual income taxes and sales and excise taxes — as a share of total personal income in the state.
Trustindex verifies that the original source of the review is Google.
We sold a home with Jim and Donna and from beginning to end they were consummate professionals. Their initial walk through the property resulted in a list of items to be repaired or updated. They supplied a list of vendors and job quotes to do the repairs and updates. We originally wanted to sell ‘as is’ and just get it over with. They gave us a selling price for ‘as is’ and options for doing a few updates/repairs to doing it all with the selling price for each option. We agreed to do all they suggested and we sold for the exact price they predicted. For every dollar spent we got back more than $2 back in the selling price. And they got that price in a rising interest rate environment! Donna and Jim are extremely detailed and guide you through ever aspect of the sale. There were no surprises thanks to their guidance. We couldn’t be more pleased with their representation.
Thank you Donna and Jim,
Jerry and Mary
Heather Quejada
March 27, 2025
Trustindex verifies that the original source of the review is Google.
We have known Jim & Donna Klinge for over a dozen years, having met them in Carlsbad where our children went to the same school. As long time North County residents, it was a no- brainer for us to have the Klinges be our eyes and ears for San Diego real estate in general and North County in particular. As my military career caused our family to move all over the country and overseas to Asia, Europe and the Pacific, we trusted Jim and Donna to help keep our house in Carlsbad rented with reliable and respectful tenants for over 10 years.
Naturally, when the time came to sell our beloved Carlsbad home to pursue a rural lifestyle in retirement out of California, we could think of no better team to represent us than Jim and Donna. They immediately went to work to update our house built in 2004 to current-day standards and trends — in 2 short months they transformed it into a literal modern-day masterpiece. We trusted their judgement implicitly and followed 100% of their recommended changes. When our house finally came on the market, there was a blizzard of serious interest, we had multiple offers by the third day and it sold in just 5 days after a frenzied bidding war for 20% above our asking price! The investment we made in upgrades recommended by Jim and Donna yielded a 4-fold return, in the process setting a new high water mark for a house sold in our community.
In our view, there are no better real estate professionals in all of San Diego than Jim and Donna Klinge. Buying or selling, you must run and beg Jim and Donna Klinge to represent you! Our family will never forget Jim, Donna, and their whole team at Compass — we are forever grateful to them.
Lou F
March 27, 2025
Trustindex verifies that the original source of the review is Google.
WeI had the pleasure of working with Klinge Realty Group to sell our home in Carmel Valley, and I cannot recommend them highly enough!
Jim and Donna demonstrated exceptional professionalism, offering expert guidance on market conditions and pricing strategy, which resulted in a quick and successful sale.
Communication was prompt and we were well-informed throughout the entire process.
For anyone looking for a dedicated and knowledgeable real estate team, look no further!
---
William Sams
March 25, 2025
Trustindex verifies that the original source of the review is Google.
Donna and Jim Klinge of Klinge Realty Group have our highest possible recommendation. From Donna and Jim’s first visit to our house through closing their advice and counsel was candid and honest in all dealings. They kept us fully informed throughout the process. The house sold less than three days after listing with a two-week closing. My wife and I have sold several houses during our lives. This was by far the best experience. Klinge Reality is a premium service realtor. You can’t make a better choice for someone to sell your home fast and for top dollar.
Emily Hernandez
December 29, 2024
Trustindex verifies that the original source of the review is Google.
Donna and Jim provided exceptional support and professionalism throughout the entire process. We couldn't have been happier with their efforts. They made our house shine, and thanks to their expertise, it sold above the listing price in the very first weekend! Truly a fantastic experience from start to finish.
Jesus Adrian Sahagun
November 11, 2024
Trustindex verifies that the original source of the review is Google.
This year has been difficult on our family, mainly due to having to sell our home. Thankfully we knew God had a plan for us and working with the Klinge team was a key part of it. It was an obvious decision to work with them again after such an amazing experience when purchasing the same home we needed to sell. The challenge was, how will we do this in so little time with so much going on? Jim and Donna held our hand every step of the way. Whenever an unexpected issue arose they found and provided a solution. Never once did we feel pressured to make a decision and the Klinges were always reassuring after providing the information that the decision was ours to make. Despite the curve balls, they never panicked and exemplified the “can do” attitude, making us feel optimistic and taken care of. Their expertise and professionalism was superb. But of all the reasons to work with the Klinges, the most impactful and valuable is their compassion and genuine care for their clients. We pray that we can one day purchase our forever home and you better believe that Jim and Donna will be representing us - as long as they will have us of course. Thank you again Klinge team! Your execution, experience, and care are unmatched.
SABIHA PASHA
July 23, 2024
Trustindex verifies that the original source of the review is Google.
Jim and Donna were fantastic! Jim understanding my needs, recommending potential places, pointing out the pros and cons of each property was invaluable. Then when the offer was accepted Donna’s organized guidance through the inspections, paperwork etc made the whole process seem effortless.
So grateful that I had them on my side!
Anu Koberg
July 13, 2024
Trustindex verifies that the original source of the review is Google.
We first found Jim through his blog at bubbleinfo.com, which really showcased his knowledge of SoCal real estate. Since then we've done three transactions with Jim and Donna, and they are an incredible full service agency, with Jim's deep market insight and Donna's deft contract and project management. We trust them implicitly in their analysis and strategy, which is based on years of experience. They're always available and on top of things, and we strongly recommend them to anyone.
Bjorn Isachsen
July 10, 2024
Trustindex verifies that the original source of the review is Google.
The Good
The Klinge Realty Group operates like a finely tuned machine, with a very personal touch. We contacted them on a Sunday and they were talking to us about our family and our needs on our living room couch the following day. They carefully listened to us and worked with us to identify the best and quickest path to listing within 2 weeks to take advantage of the low inventory conditions in our South Carlsbad neighborhood. They knew our tract specifically and had many previous sales there over the years - they came prepared with a thorough analysis of comparative sales and recommended a pricing strategy that they felt confident would yield offers the first weekend on the market.
The Great
Over the next two weeks Donna coordinated a range of vendors who she knew from experience could get the preparation to list work we needed done on time and with high quality. Our light tune-up involved excellent experiences with their stagers, landscapers, contractors, electricians, and plumbers. Throughout this period Donna's daily communication was clear, concise, and responsive. Any time we had questions Donna picked up the phone or texted immediately - but almost always, she answered our questions before we even knew we had them.
The Outstanding
We had a tricky situation with a shared fence that could have delayed our escrow. Donna used superb mediation skills to negotiate the terms of replacement and was personally on site with the fence contractor to make sure everything went smoothly. The fence looks great and escrow closed on time.
The Truly Exceptional
Our house came on the market on a Wednesday and between then and Monday morning Jim was personally at all three open houses. He was in constant communication explaining potential buyer reaction and strength. As he predicted offers began to come in on Saturday and each one was incrementally higher than the last. At the end we had 5 offers, 4 of which were over list, and the final accepted offer was $100,000 over list. In addition to being over list it included rent back terms that met our needs.
The Recommendation
For all of these reasons we would strongly recommend The Klinge Team to anyone wanting to sell in North County Coastal San Diego. I had been reading Jim's bubbleinfo.com blog for 15 years and knew when the time came to sell that he would be our first call. Jim Klinge is not your standard realtor. He is keenly aware of market conditions and sales strategies. And, works his tail off - though not as hard as Donna . At this point he's gone from realtor to friend and I plan to have him over to grill and chill at our new place to talk real estate, but also just about life and raising kids in San Diego. He's more interested in relationships than his sales numbers - and that's why his sales numbers are so high. We have already recommended the Klinge's to some close friends and another successful sale is on deck right around the corner...
Chris Shea
June 21, 2024
Trustindex verifies that the original source of the review is Google.
We recently had the pleasure of working with Jim and Donna from Klinge Realty Group to sell our house, and we couldn't be more satisfied with the experience. From the initial meeting, they listened attentively to our needs and provided invaluable guidance on specific improvements to get our home market ready.
Their responsiveness throughout the entire process was truly impressive. Anytime we had questions or concerns, they were quick to address them, ensuring we felt comfortable and informed every step of the way. What stood out the most was their team and extensive network of tradespeople, which made addressing any necessary repairs or updates seamless and stress-free.
Thanks to their expertise and dedication, our house sold quickly and at a great price. We highly recommend Jim and Donna to anyone looking to buy or sell a home. They are a fantastic team who truly care about their clients and deliver exceptional results.