More ivory-tower musings here, and it’s hard to believe that they could be so blind.
How can analysts read these statistics and decide that the frenzy will come to a complete halt, which is what a 2.5% YoY gain will feel like if it were to happen? Because of a break for the holidays?
That’s the best you got?
Predicting that there will be additional inventory for-sale when it’s been plummeting everywhere is naïve too.
At least their headline writer got it right:
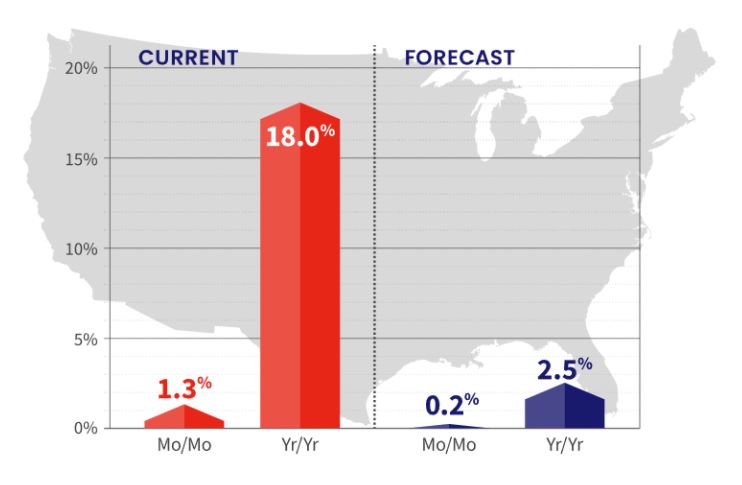
‘Lower Appreciation Not Yet Reflected in Gains’
While it is clear that the growth of home prices has started to slow, reports on the results of the deceleration are diverging. Earlier this week Black Knight reported its Home Price Index (HPI) was up 0.6 percent in October, today CoreLogic puts the gain at 1.3 percent.
The CoreLogic report says its reported October appreciation is a full 1 percentage point lower than the peak posted for April. The annual rate of increase in the HPI for the October was 18 percent, identical to the 12-month growth it reported for September, and the highest recorded in the 45-year history of the index. Incidentally, in April the annual increase was 13 percent, showing the rapid run-up of prices over the summer and early fall.
Detached properties(i.e., single-family residences) continue to appreciate at a much higher rate (19.5 percent, also a record high) than attached properties at 12.9 percent. This also differs substantially from the 11 percent gain for single family homes reported by Black Knight which also reported that condo prices are now rising faster than those for single-family houses.
Price gains remain strongest in the Mountain West, with Arizona and Idaho again topping the charts with growth of 28.8 percent and 28.7 percent, respectively. Utah was third at 24.5 percent. Twin Falls, Idaho had the fastest growth among metros at 35.8 percent, but the South did weigh in. Naples, Florida was second at 33.5 percent.
Despite affordability challenges, a recent CoreLogic consumer survey shows that over half of respondents across every age cohort said that owning a home has always been a goal of theirs – further supporting the outlook that consumer desire for homeownership remains.
“New household formation, investor purchases and pandemic-related factors driving demand for the limited supply of available for-sale homes continues to propel the upward spiral of U.S. home prices,” said Frank Martell, president and CEO of CoreLogic. “However, we expect home price growth to moderate over the near term as many buyers take a break for the holidays.”
CoreLogic’s forward looking HPI projects that slowdown to result in a year-over-year increase of only 2.5 percent by next October “as affordability and economic concerns deter some potential buyers and additional for-sale inventory becomes available.”
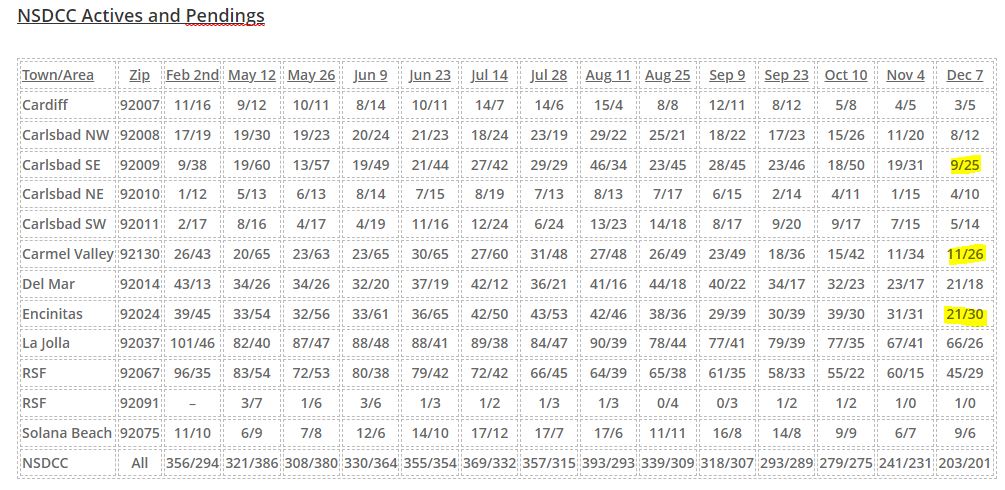
The reason for breaking down the active and pending listings by zip code is to give the readers a closer look at their neighborhood stats.
Our Big Three zip codes – where you can still buy a decent house for $2,000,000 – are still having more pendings than actives (highlighted below), but let’s note how strong the pending counts are in La Jolla and Rancho Santa Fe too:
The median list price in La Jolla today is $5,422,500, and in RSF it is $7,700,000!
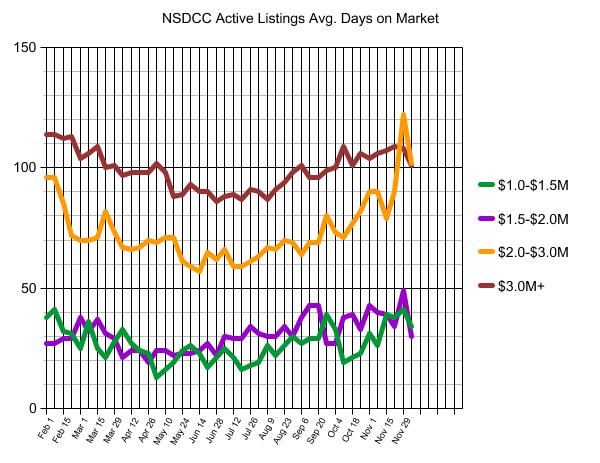
We can also track the average market times too. Upward trends here would indicate market slowing:
All four categories have improved recently, and the high-end $3,000,000+ average market times have been in the tightest range over the last few months!
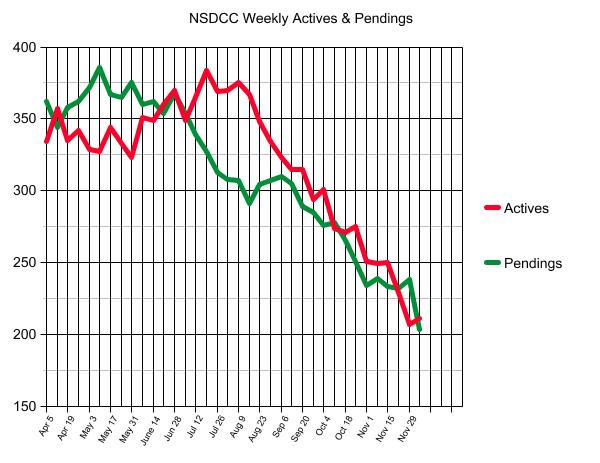
Some may call this the off-season, but the only reason that the numbers aren’t any better is because the number of new listings is so low. Brace for impact in 2022!
We did get to spend the Thanksgiving weekend in Manhattan with Kayla. She cooked a good old-fashioned turkey dinner at home on Thursday, and the next day we visited the new tourist attraction on 42nd Street adjacent to Grand Central Station. They run you up to the 92nd floor where most of the younger folks are posing like a Kardashian – with some bringing their own pro photographers!
The view looking towards downtown (and Brooklyn to the left):
Looking west across the Hudson River towards New Jersey:
42nd Street below, and New Jersey in the distance:
Pivoting to the right, this is looking up Madison Avenue towards Central Park, Harlem, and the Bronx:
Looking east towards the Chrysler Building and the United Nations, with Queens in the distance:
Virtually all of the ivory-tower crowd thinks that pricing will settle down in 2022.
They should take a good look at how 2021 is wrapping up.
Admittedly, the San Diego market is at the extreme end, with our inventory enduring the biggest YoY dropoff anywhere in the country. It’s been that way around here for months, and the NSDCC stats for November show how explosive the pricing can be when buyers are starved for quality homes for sale:
Year
NSDCC November Sales
Median LP/sf
Median SP/sf
LP:SP
2019
212
$1,391,500
$1,347,500
97%
2020
306
$1,597,000
$1,589,950
100%
2021
195
$2,000,000
$2,100,000
105%
The median sales price is 32% higher than it was 12 months ago, and 56% higher than it was two years ago!
We thought that the last half of 2020 was the frenzy of all-time, mostly because there was ample inventory that enabled home buyers to set monthly sales records.
But the second half of 2021 has been experiencing a radical pricing frenzy, with the November LP:SP ratio at a whopping 105%! The median sales price is $100,000 higher than the median list price? Wow!
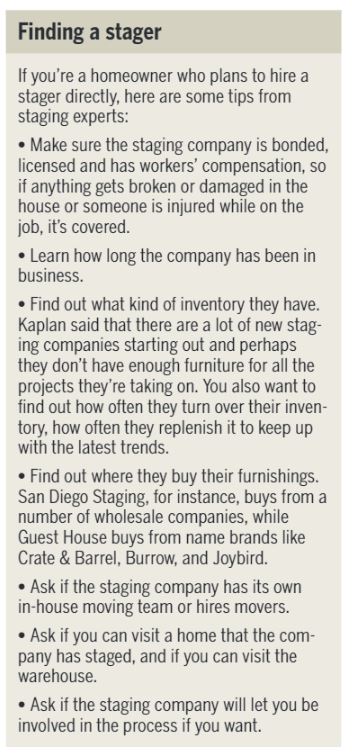
Buyers need to be sold twice – online and in-person. Staging helps with both!
La Jolla Realtor Michelle Silverman can easily tick off the various homes she’s sold for which she got more and higher offers because of effective staging.
“There was one home that hadn’t been staged and was listed at $1.149 million. It was old. It was tired looking,” she said. “I took the listing and had it staged. We got 12 offers on it and ended up selling it for just a little over $1.15 million. So, maybe it was just a little higher, but the buyer said they were only going to get $900,000 for the house.”
According to a 2020 survey of 13,000 staged homes by the Real Estate Staging Association noted that staged homes sell faster, averaging just 23 days on the market. By comparison, the typical U.S. home spent 43 days on the market last month, according to a report from Realtor.com.
The staging association survey also showed that with an average investment of 1 percent, approximately 75 percent of sellers saw a return on investment of 5% to 15% over asking price.
And this was before the market got as heated as it is now.
So, you might ask, if we’re in a seller’s market, why bother staging a home? Why not save the expense?
Silverman’s response was quick.
“Because even in a seller’s market, buyers are not visionary.”
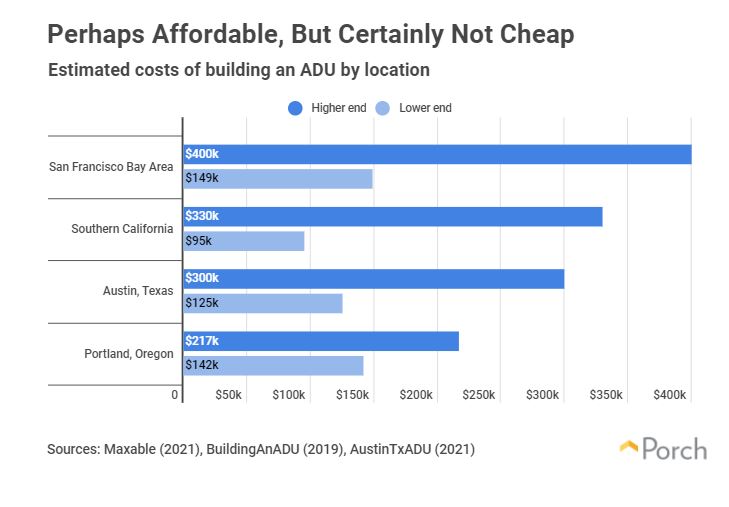
Because ADUs are expensive to build, there’s not much hope that they will solve the housing crisis.
Key Findings
There are an estimated 1.5 million Accessory Dwelling Units (ADUs) in the United States, making up roughly 2% of all homes in the country
ADUs are growing at a rate of 9%, or 100,000 per year
An average cost of an ADU is $180,000, or $260 per square foot
In America’s biggest cities, a home with an ADU is priced 35% higher on average than a home without one
The top states for ADUs are California (30%), Florida (12%), Texas (10%) and Georgia (5%)
The cities with the most ADUs are Los Angeles (12%), Portland (4%) and Houston (3%)
ADU sale listings are growing fastest in Portland (+23%), Dallas (+19%), and Seattle (+18%)
Whether you call them granny flats, in-law suites, or garage apartments – accessory dwelling units (“ADUs”) are on the rise. There are an estimated 1.4 million of them in the United States, with around 110,000 constructed in the last year alone.
In 2020, ADUs were often heralded as one answer to the growing housing affordability crisis. Their proponents argue that ADUs offer an opportunity for homeowners to make extra income, for young people to rent affordably, and for communities to grow slowly and sustainably.
But then the pandemic came and changed everything, and hardly for the better. So where did that leave ADUs in 2021?
Susie asked for a Zillow Offers update, and yesterday they announced that the unwinding is going just fine. While the debacle did tank their stock price, they figured it would be a good time to buy more for themselves:
SEATTLE, Dec. 2, 2021 – Zillow Group, Inc. today announced it has made significant progress in winding down Zillow Offers inventory and has sold, is under contract to sell or has reached agreement on disposition terms for more than 50% of the homes it expected to resell during the entire wind-down process. Zillow Group’s Board of Directors has also authorized the repurchase of up to $750 million of its Class A common stock, Class C capital stock or a combination of both.
“We are pleased with the progress of our wind-down efforts and recognize that no longer operating Zillow Offers will allow us to have a more capital-efficient balance sheet and business moving forward,” said Zillow Group co-founder and CEO Rich Barton. “With that, we see today as an opportune time to announce a share repurchase program and reduce the cash balance we built up to support Zillow Offers.”
We can expect them to gloss over their little boo-boo and carry on.
The less equity you have, the more likely you will move.
Q: I guess it may be too late, but figured I’d ask. We did a reverse mortgage. We got almost no cash out of it, but it is eating up whatever equity remains with our loan that has an effective interest rate of almost 5 percent. Is there anything we can do? Thank you.
A: Reverse mortgages have been around for more than 20 years. The concept is enticing: If you’re over age 62 and you have equity in your home, there are a number of lenders who will give you a loan for a certain percentage of available equity (often up to 85 percent, but sometimes quite a bit less). The loan provides you with cash and no requirement to repay the loan until the home is sold or the owners pass away.
If you’re house rich and cash poor, and want to stay in your home but perhaps need funds to make repairs, pay off the mortgage to lower your cash burn or even augment your retirement income, a reverse mortgage can help. But it comes at a fairly steep price: a higher interest rate plus higher fees.
The higher fees eat away at the amount of cash you’ll get. The higher interest rate eats away at your remaining equity. And you still have the requirement to pay your real estate property taxes and homeowners insurance premiums.
It sounds like you needed cash, maybe didn’t qualify for a home equity line of credit and turned to a reverse mortgage as a way to secure the funds you required. The problem is the one you now face: You had a home without much in the way of equity, took what you could, and now have run through the cash and are out of options to get more.
It’s an unfortunate position to be in if returning to work is no longer an option or a possibility. When we get asked about reverse mortgages, we’ll often recommend that homeowners sell the property, take whatever equity they can and rent something that’s affordable. Or, better yet, move in with family or into some sort of shared living arrangement to cut costs.
Trustindex verifies that the original source of the review is Google.
Jim & Donna Klinge helped us sell our home of 30 years in Ocean Hills. We were very happy with their service and would HIGHLY recommend them to anyone looking for an Honest, Knowledgeable, Skilled, Informed Efficient realty team. Both Jim & Donna were so helpful in different ways and complemented each others skills. Please refer to a more detailed review that we wrote on YELP. Thank You Both for all your help!!!
Jesse O'Hara
June 12, 2025
Trustindex verifies that the original source of the review is Google.
A+ thank you
Lisa Tuomi
June 11, 2025
Trustindex verifies that the original source of the review is Google.
Many years ago, we purchased a home in Carlsbad, using a realtor that was recommended to us - Jim Klinge. Fast forward to 2025, we recently had the privilege of selling 2 homes in Carlsbad, CA and didn't hesitate to reach out to Jim and Donna Klinge of Klinge Realty Group to guide us through the sales. The transactions were very different, each with its own unique situation, opportunities and challenges. From start to finish, Donna and Jim helped navigate the pre-sale preparation, the listing, showing of the house, buyer negotiations, the final close and all of the paperwork and decisions in between. What stands out with both transactions is the professionalism of Jim and Donna (and their team), wonderful communication (timely, relevant, concise), their deep understanding of market dynamics (setting realistic expectations), their access to top-notch contractors, and last, their ability to guide us across the finish line successfully. We wouldn't hesitate to use Jim and Donna in the future and highly recommend them for anyone looking to buy or sell a property in North San Diego County.
Jerry Meyer
March 28, 2025
Trustindex verifies that the original source of the review is Google.
We sold a home with Jim and Donna and from beginning to end they were consummate professionals. Their initial walk through the property resulted in a list of items to be repaired or updated. They supplied a list of vendors and job quotes to do the repairs and updates. We originally wanted to sell ‘as is’ and just get it over with. They gave us a selling price for ‘as is’ and options for doing a few updates/repairs to doing it all with the selling price for each option. We agreed to do all they suggested and we sold for the exact price they predicted. For every dollar spent we got back more than $2 back in the selling price. And they got that price in a rising interest rate environment! Donna and Jim are extremely detailed and guide you through ever aspect of the sale. There were no surprises thanks to their guidance. We couldn’t be more pleased with their representation.
Thank you Donna and Jim,
Jerry and Mary
Heather Quejada
March 27, 2025
Trustindex verifies that the original source of the review is Google.
We have known Jim & Donna Klinge for over a dozen years, having met them in Carlsbad where our children went to the same school. As long time North County residents, it was a no- brainer for us to have the Klinges be our eyes and ears for San Diego real estate in general and North County in particular. As my military career caused our family to move all over the country and overseas to Asia, Europe and the Pacific, we trusted Jim and Donna to help keep our house in Carlsbad rented with reliable and respectful tenants for over 10 years.
Naturally, when the time came to sell our beloved Carlsbad home to pursue a rural lifestyle in retirement out of California, we could think of no better team to represent us than Jim and Donna. They immediately went to work to update our house built in 2004 to current-day standards and trends — in 2 short months they transformed it into a literal modern-day masterpiece. We trusted their judgement implicitly and followed 100% of their recommended changes. When our house finally came on the market, there was a blizzard of serious interest, we had multiple offers by the third day and it sold in just 5 days after a frenzied bidding war for 20% above our asking price! The investment we made in upgrades recommended by Jim and Donna yielded a 4-fold return, in the process setting a new high water mark for a house sold in our community.
In our view, there are no better real estate professionals in all of San Diego than Jim and Donna Klinge. Buying or selling, you must run and beg Jim and Donna Klinge to represent you! Our family will never forget Jim, Donna, and their whole team at Compass — we are forever grateful to them.
Lou F
March 27, 2025
Trustindex verifies that the original source of the review is Google.
WeI had the pleasure of working with Klinge Realty Group to sell our home in Carmel Valley, and I cannot recommend them highly enough!
Jim and Donna demonstrated exceptional professionalism, offering expert guidance on market conditions and pricing strategy, which resulted in a quick and successful sale.
Communication was prompt and we were well-informed throughout the entire process.
For anyone looking for a dedicated and knowledgeable real estate team, look no further!
---
William Sams
March 25, 2025
Trustindex verifies that the original source of the review is Google.
Donna and Jim Klinge of Klinge Realty Group have our highest possible recommendation. From Donna and Jim’s first visit to our house through closing their advice and counsel was candid and honest in all dealings. They kept us fully informed throughout the process. The house sold less than three days after listing with a two-week closing. My wife and I have sold several houses during our lives. This was by far the best experience. Klinge Reality is a premium service realtor. You can’t make a better choice for someone to sell your home fast and for top dollar.
Emily Hernandez
December 29, 2024
Trustindex verifies that the original source of the review is Google.
Donna and Jim provided exceptional support and professionalism throughout the entire process. We couldn't have been happier with their efforts. They made our house shine, and thanks to their expertise, it sold above the listing price in the very first weekend! Truly a fantastic experience from start to finish.
Jesus Adrian Sahagun
November 11, 2024
Trustindex verifies that the original source of the review is Google.
This year has been difficult on our family, mainly due to having to sell our home. Thankfully we knew God had a plan for us and working with the Klinge team was a key part of it. It was an obvious decision to work with them again after such an amazing experience when purchasing the same home we needed to sell. The challenge was, how will we do this in so little time with so much going on? Jim and Donna held our hand every step of the way. Whenever an unexpected issue arose they found and provided a solution. Never once did we feel pressured to make a decision and the Klinges were always reassuring after providing the information that the decision was ours to make. Despite the curve balls, they never panicked and exemplified the “can do” attitude, making us feel optimistic and taken care of. Their expertise and professionalism was superb. But of all the reasons to work with the Klinges, the most impactful and valuable is their compassion and genuine care for their clients. We pray that we can one day purchase our forever home and you better believe that Jim and Donna will be representing us - as long as they will have us of course. Thank you again Klinge team! Your execution, experience, and care are unmatched.
SABIHA PASHA
July 23, 2024
Trustindex verifies that the original source of the review is Google.
Jim and Donna were fantastic! Jim understanding my needs, recommending potential places, pointing out the pros and cons of each property was invaluable. Then when the offer was accepted Donna’s organized guidance through the inspections, paperwork etc made the whole process seem effortless.
So grateful that I had them on my side!