Tinge of Nic
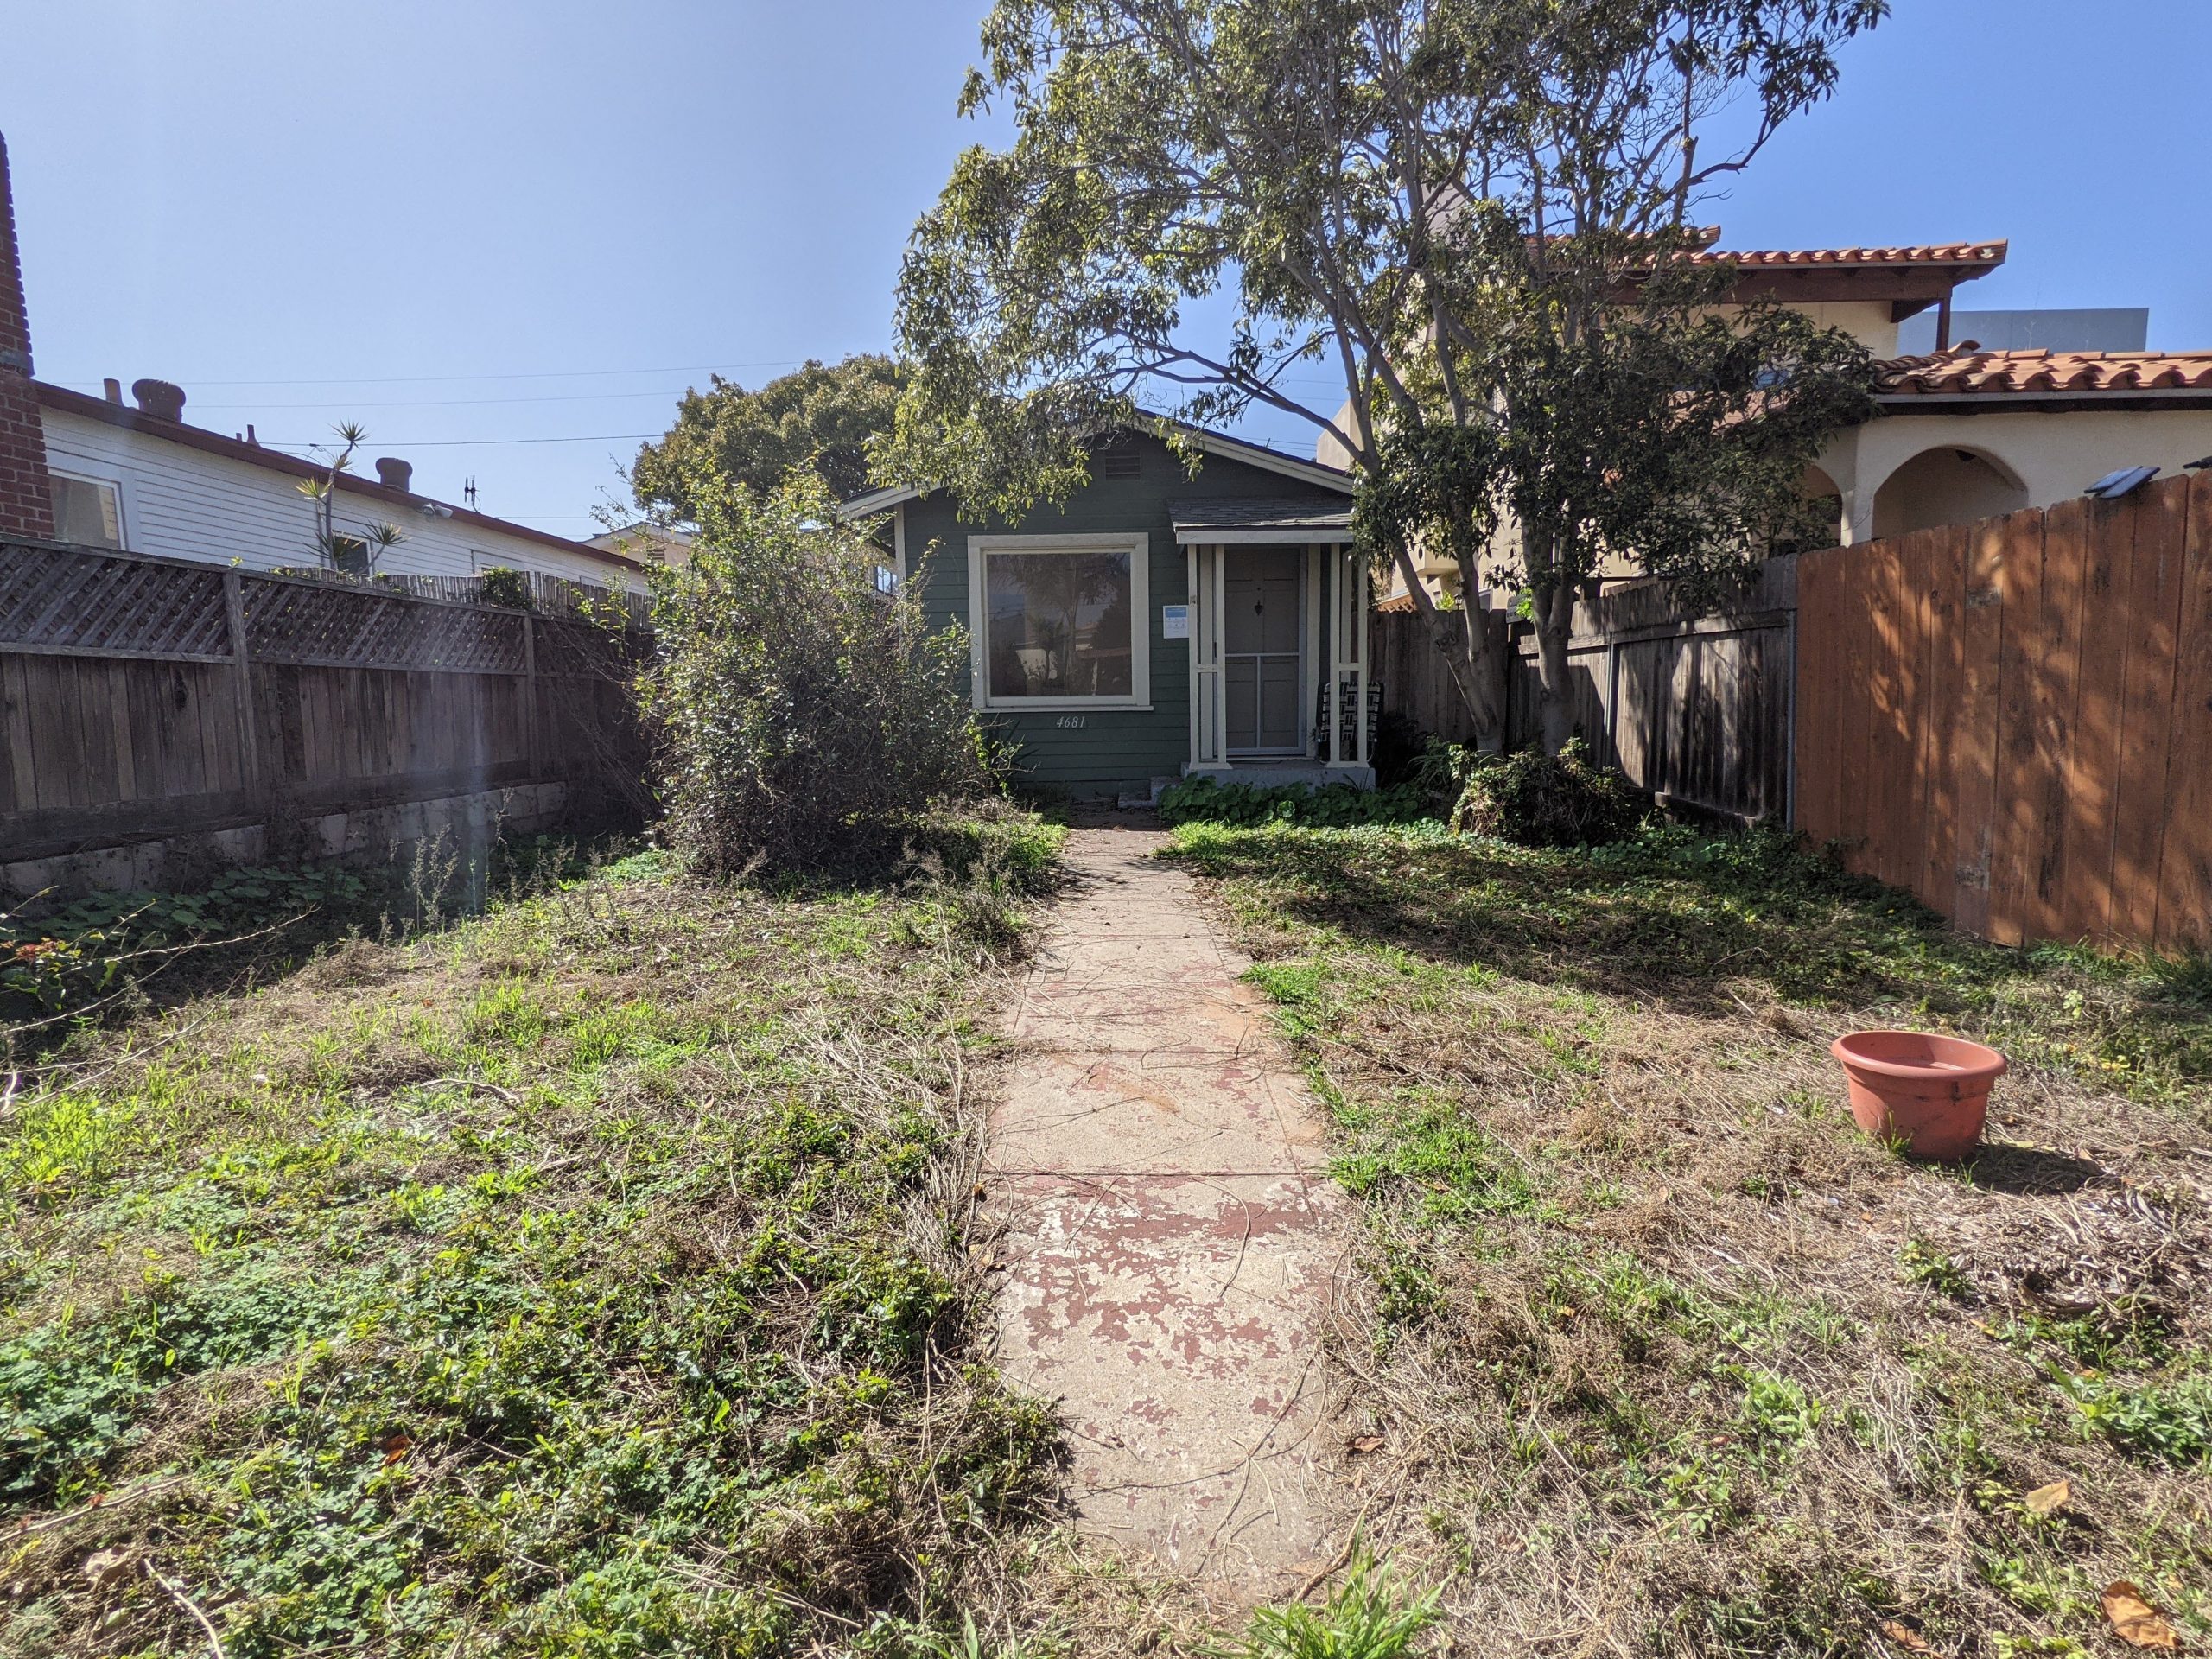
I’ll probably see two properties around the flight path all year – might as well show them back-to-back:

I’ll probably see two properties around the flight path all year – might as well show them back-to-back:

Everyone says that inventory is low because potential sellers don’t want people in their house during covid……but that’s not stopping the buyers! The showing counts are rising quickly and more people are looking – maybe more than ever for early March:
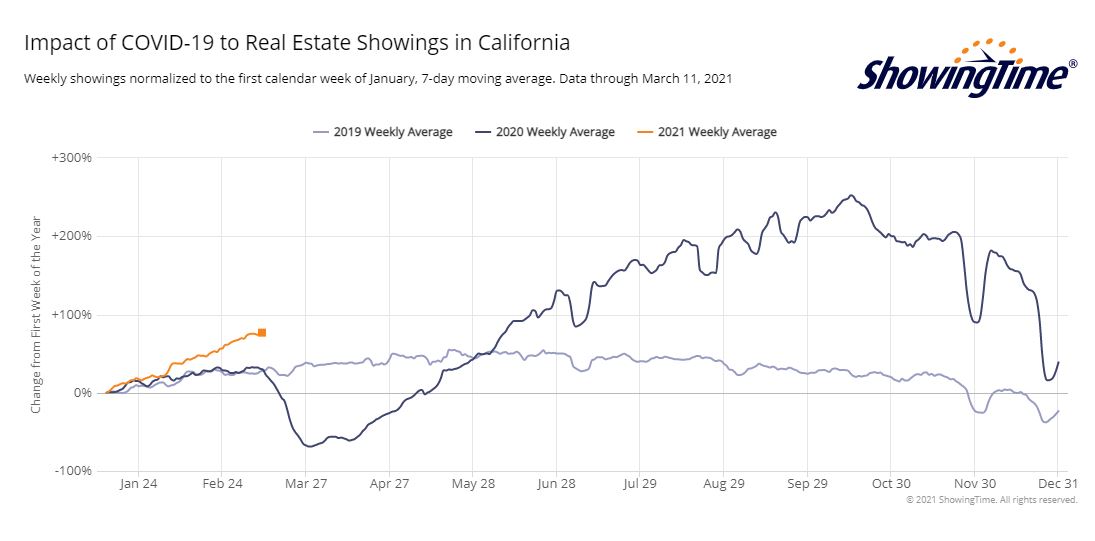
The competition among buyers is increasing daily, yet the number of homes coming on the market is still well behind previous years, creating an imbalance of gigantic proportions – twice as many lookers to buy 18% fewer listings than last year:
San Diego County Number of New Listings, January + February Combined
| Year | |
| 2013 | |
| 2014 | |
| 2015 | |
| 2016 | |
| 2017 | |
| 2018 | |
| 2019 | |
| 2020 | |
| 2021 |
This year we were 26% below the average of the previous 8 years!
The extraordinary demand mixed with fewer properties is causing everything to get bid up.
In past years, any defects or concerns might limit the number of buyers, and affect the value. These days, it just means you’ll have less than ten offers. The flipper paid $911,500 for this in November, listed for $1,089,000, got seven offers and two bid it up to $1,300,000:
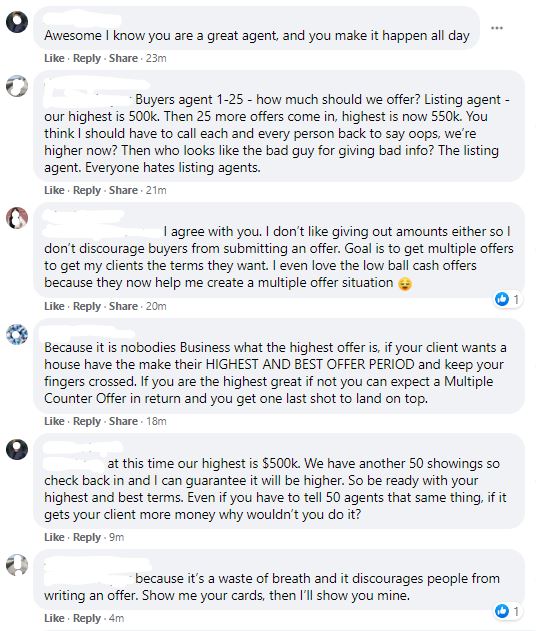
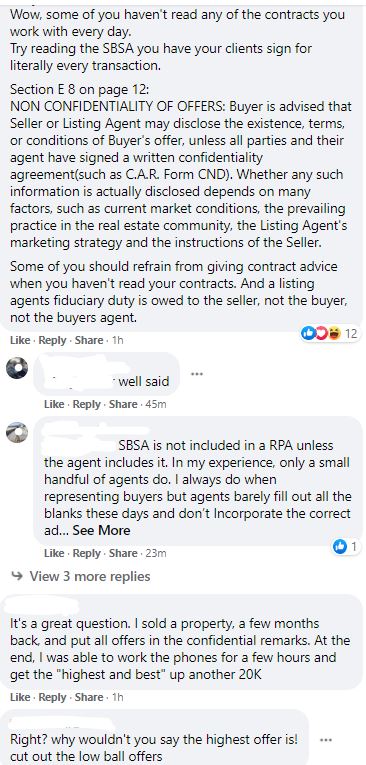
To say it’s the Wild Wild West out here is putting it lightly, and how realtors handle multiple offers is the primary reason. There isn’t a standard way to handle a bidding war – and heck, we don’t even agree on what is confidential, and what isn’t. Here is the variety of opinions from a FB thread:
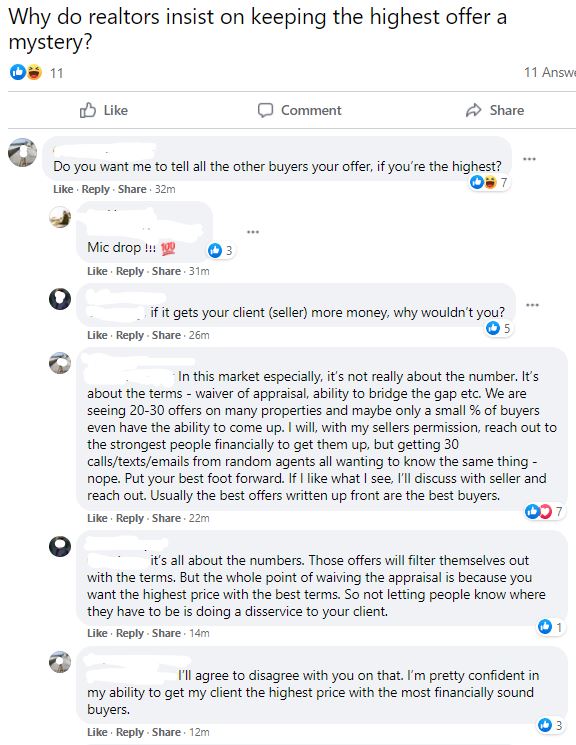
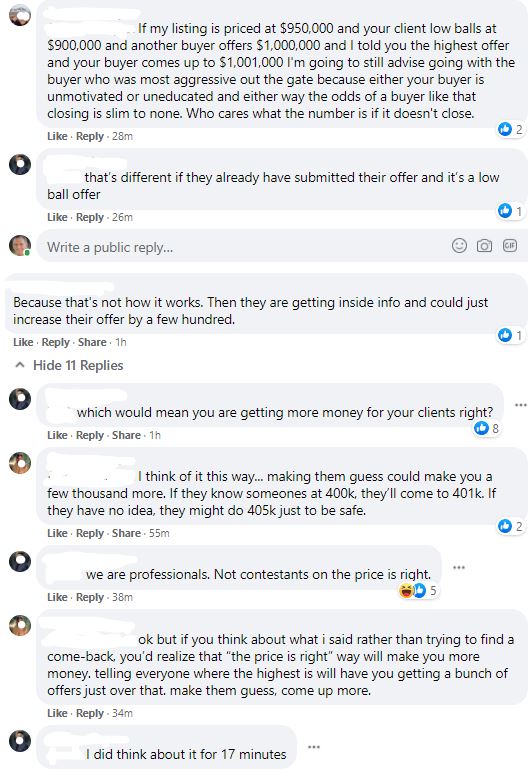


Even when presented with a copy of the actual verbiage from our contracts, she comments, “Wrong”.
Is anyone surprised why buyers are so frustrated?

The trend of paying over the list price is increasing.
NSDCC Detached-Home Sales Closed Over List Price
January: 38%
February: 43%
March: 51% (of the first 75 closed sales of the month)
Most sellers and agents are happy just to get 1% to 5% over list which will cover some or all of the commission. There were only four that went double-digit over:
Most % Over List Price
| List Price | ||
| $1,900,000 | ||
| $1,200,000 | ||
| $1,750,000 | ||
| $1,095,000 |
NSDCC Sales, March 1st-10th: 75
Average List Price: $2,072,379
Average Sales Price: $2,049,937 (99%)
Median List Price: $1,750,000
Median Sales Price: $1,800,000 (103%)
~~~~~~~~~~~~~~~~~~~~~~~~~~~~~~~~~~~~~~~
This Brentwood Heights culdesac home on a 27,007sf lot in Olde Carlsbad had one of the better granny flats – and was hotly contested. We were hoping to talk the seller into paying off the $259/mo. solar lease, but he probably didn’t have to. It closed today for $1,625,000 cash:
I love hearing from new readers!
Hi Jim,
I have recently stumbled upon your blog and find it very interesting as I am an appraiser in San Diego. I wonder if anyone has considered that the low inventory levels are in part because home prices are going up so fast why would anyone want to sell something that is going to be worth 10K, 20K, 50K more within just months. For example my home according to Zillow is up 22K in the last 30 days. Something else to consider that I have not seen mentioned….
Are sellers paying attention that closely? If so, then you’re right – it’s possible. Add that extra supply to the post-covid/Prop-19/usual-spring listings and there could be a real surge. But the worst thing that will happen is there will be 3-4 houses for sale in your neighborhood, instead of one or two.
Do sellers risk it? Most are already making $200,000 to $1,000,000+ profit……are they going to purposely hold out in hopes of picking up an extra $50,000? Maybe, but I’d guess that when and where they are moving probably plays a bigger role in their decision-making.
~~~~~~~~~~~~~~~~~~~~~~~~~~~~~~~~~~~~~~
Sellers are indeed holding back for some reason.
In the first nine days of March last year we had 148 new listings between La Jolla and Carlsbad, and so far we’ve only had 90 this year. More will be added to that nine-day total this week, but we’re still well under where we’ve been in previous years. March is when the inventory really picks up, historically:
~~~~~~~~~~~~~~~~~~~~~~~~~~~~~~~~~~~~~~~~~~~~
The Frenzy of 2013 was red-hot for about a year. If the same happens this time, it means the market should flatten out by July as rates increase and buyer exhaustion sets in.
~~~~~~~~~~~~~~~~~~~~~~~~~~~~~~~~~~~~~~~~~~~~
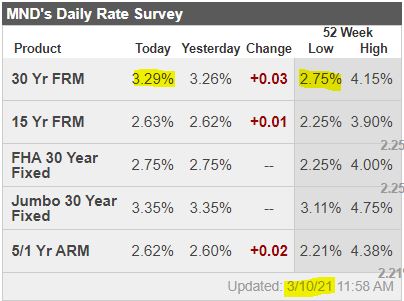
The bump in rates over the last two weeks just threw gasoline on the fire for those who could find a house to buy. But an extended run-up – especially if we get to 4% – should cool things off.
~~~~~~~~~~~~~~~~~~~~~~~~~~~~~~~~~~~~~~~~~~~~
I have two closings with buyers this week. One paid $135,000 over list, and the other paid $100,000 over.
~~~~~~~~~~~~~~~~~~~~~~~~~~~~~~~~~~~~~~~~~~~~
Over the weekend, I had buyers make a highest-and-best offer that was $207,000 over list….and lost.
~~~~~~~~~~~~~~~~~~~~~~~~~~~~~~~~~~~~~~~~~~~~
There is virtually no transparency – just take your shot and pray. Don’t think, and don’t blink!
~~~~~~~~~~~~~~~~~~~~~~~~~~~~~~~~~~~~~~~~~~~~

The industry has been abuzz over Zillow buying ShowingTime, our appointment-scheduling service.
Wouldn’t it be great if Zillow published the number of showings publicly? The intel that could be gathered would be of great interest to buyers, and help enhance the home-selling transparency.
The data is already available.
Buyer-agents who book their appointments to show on the ShowingTime mobile app can see the whole schedule of times already reserved by other agents. It also makes you wonder if listing agents are reserving a bunch of times to make their listing look more popular (no names or other info is given on the app).
If buyers knew how many showings were scheduled, it would help them decide how much to offer.
Same with the number of offers.
The trend is to do less for buyers, so when asked, most listing agents won’t discuss how many offers they’ve received – and they certainly won’t divulge the offer prices.
But they should.
It would give other buyers a number to shoot at, and that transparency alone makes them more likely to hit it, or even offer more. It’s an old wives’ tale that you can’t divulge – the opposite is stated in the contract:

Another benefit of divulging the number of offers and their terms is you quickly eliminate the non-players. Most buyers are comfortable offering the list price, and +/- 5%, so why not just tell them that you have an offer that is 12% over list and save them the trouble – and save the listing agent from having to process another offer that’s going nowhere.
You can then concentrate on having the real players compete against one another.
It sounds like an auction, doesn’t it?
Del Mar Heights has always been a sexy option – the access to beach/freeway/UCSD is excellent, and two of the best elementary schools in the county are a short walk. Like in other areas, the inventory has dried up, so when this one hit the market, it created a tsunami of interest. Look at the number of views & saves:
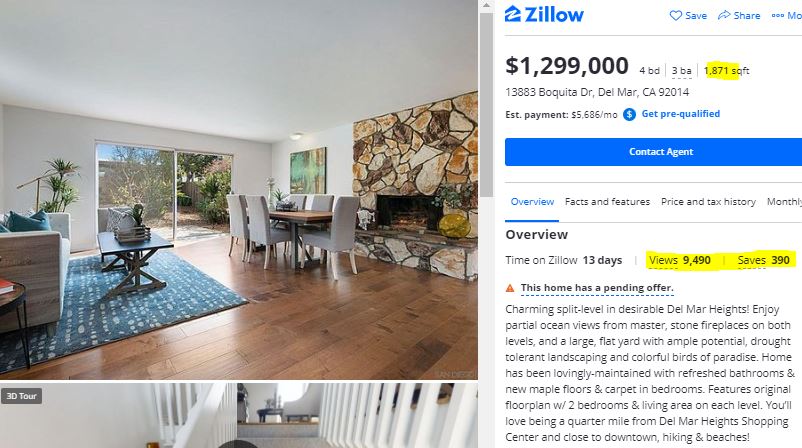
https://www.zillow.com/homedetails/13883-Boquita-Dr-Del-Mar-CA-92014/16764209_zpid/
Talk about perfect timing! The day after the bidding concluded on the home above, this estate sale hit the market, and about half of the disappointed group ran over here to make an offer:
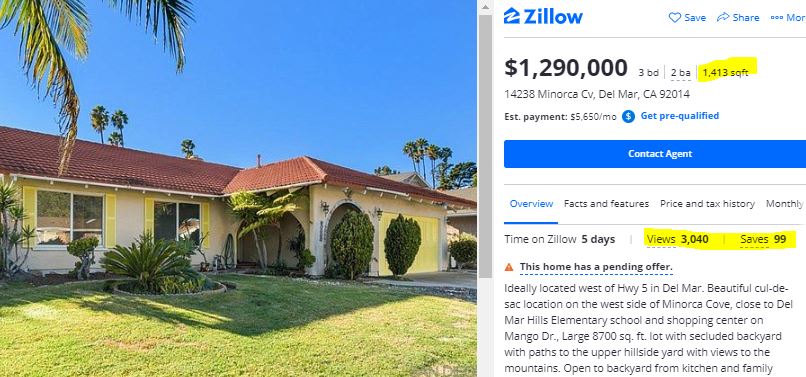
https://www.zillow.com/homedetails/14238-Minorca-Cv-Del-Mar-CA-92014/16764756_zpid/
We can expect both to be in the March double-digit-over-list group at 15% to 20% above.
If three-quarters of those unsuccessful buyers throw their hands up and decide to sit this out for a while, there will still be several competitors frothing at the mouth for the next one – even at $1,500,000+.
~~~~~~~~~~~~~~~~~~~~~~~~~~~~~~~~
Here are the percentages from January:
Link to January Blog PostHere are February’s winners:
Most % Over List Price
| List Price | ||
| $1,595,000 | ||
| $1,300,000 | ||
| $1,550,000 | ||
| $1,079,000 | ||
| $1,395,000 | ||
| $899,000 | ||
| $1,150,000 | ||
| $1,150,000 | ||
| $1,350,000 | ||
| $1,399,000 | ||
| $1,949,000 | ||
| $1,900,000 |
Those are the only double-digit winners out of 216 sales, and only 43% of the total sold for more than list.
How much crazier could it get if we did auctions?
NSDCC February Stats (so far):
Sales: 216 (+16% YoY)
Average LP: $2,308,952
Average SP: $2,263,457 (98% of list)
Median LP: $1,699,500
Median SP: $1,736,000 (102% of list)
~~~~~~~~~~~~~~~~~~~~~~~~~~~~~~~~~~~~~~~
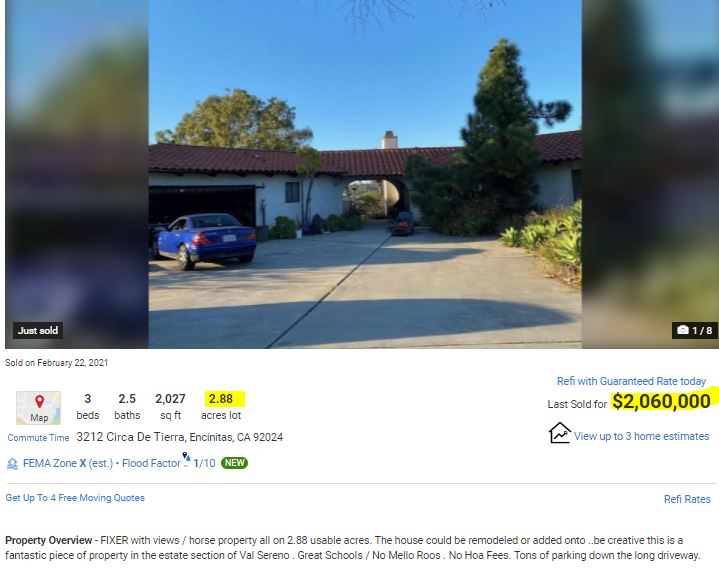
This is the property where the listing agent received 50+ phone calls in the first 24 hours on the market.
She raised the list price from $1,595,000 to $1,795,000, but the bidding war persisted.
Ten offers were submitted, and it sold for $2,060,000 cash, or 29% above the original list price!
Hopefully the new owner will split the lot and build $3M homes so more can enjoy.
~~~~~~~~~~~~~~~~~~~~~~~~~~~~~


Are you looking for an experienced agent to help you buy or sell a home?
Contact Jim the Realtor!
CA DRE #01527365, CA DRE #00873197
