We’ve heard of the metric that measures the supply and demand in residential real estate sales. Lance called it the key housing metric going into 2025, but he is suspicious of its accuracy:
A rule of thumb in real estate is that anything below a 6-month supply of inventory is considered a ‘seller’s market,’ while anything above a 6-month supply is a ‘buyer’s market.’
However, that hasn’t always held true this cycle, and ResiClub’s view is that this rule of thumb is a bit outdated. In many housing markets, including Austin’s metro area, where house prices began to decline in June 2022 with only 2.1 months of inventory, that rule hasn’t applied effectively.
In fact, despite Austin’s months of inventory only reaching a high of 4.8 as of August 2024, house prices have already dropped by -19.8% from their 2022 peak in Austin. A better measure of this incoming pricing weakness was the abrupt active inventory jump that occurred in Austin in spring/summer 2022 (going from 0.4 months of inventory in February 2022 to 2.1 in June 2022), which quickly pushed active listings above pre-pandemic levels.
I agree that using six months is outdated, and four is probably too high also.
Let’s use three months as the new standard.
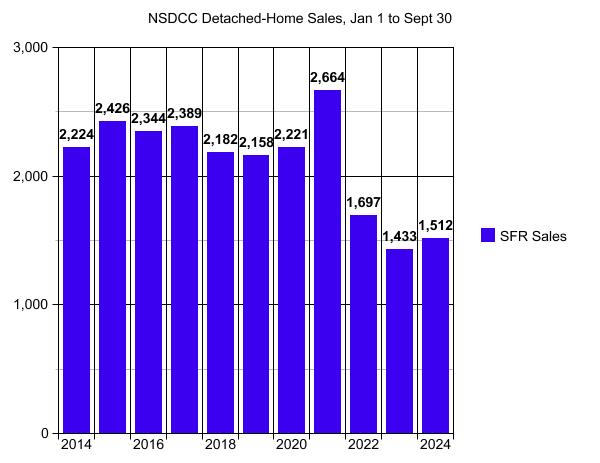
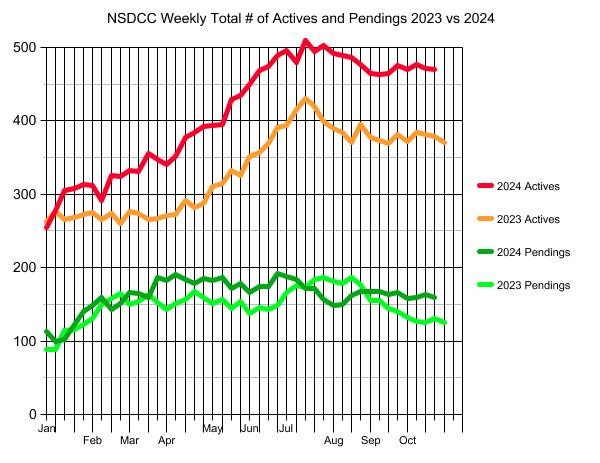
It is hard to believe how well our local market is doing.
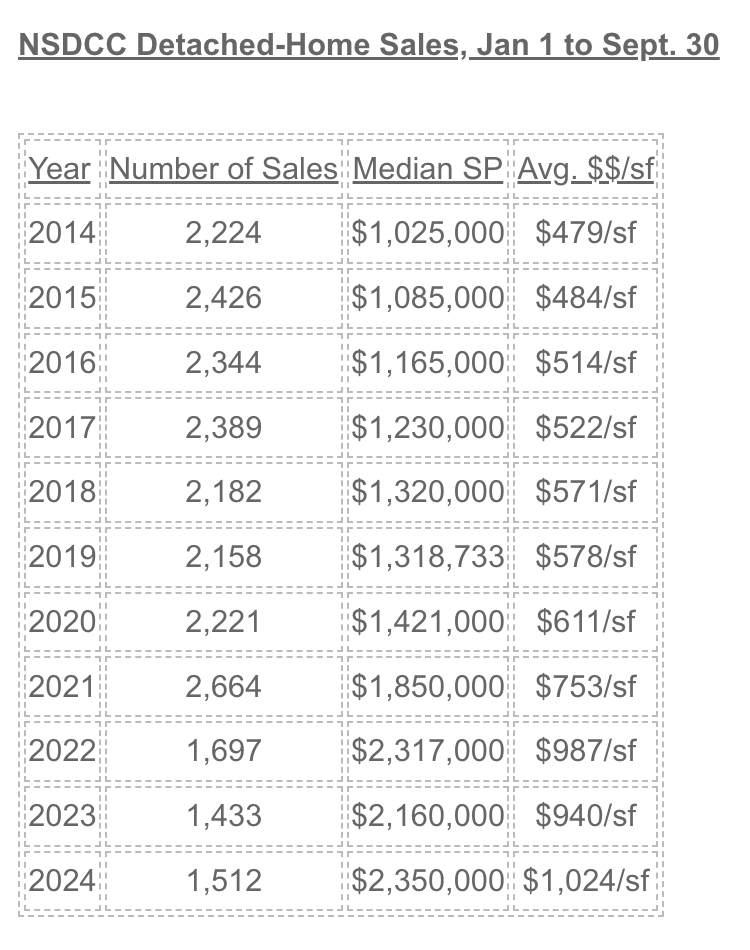
There have been 120 closed sales this month between La Jolla and Carlsbad with a median sales price of $2,617,500 which is about 9% higher than last month when there were 165 sales! With the 120 sales already in the books, it means the final count should be around 150 sales in October – even with the political circus going on!
There are 470 NSDCC houses for sale currently, and the number has been steady.
Let’s do the math: 470/150 = 3.13
If three is the new standard, it means we are at the limit of a seller’s market. With higher rates and election backwash in November, it means this measuring stick will almost certainly be indicating a buyer’s market for the last two months of 2024.
The seaside mansion known as the “sandcastle” estate hit the market Tuesday for a whopping $108 million. The architectural wonder was designed to resemble the Chateau de Versailles. This is two doors down from the Marine Room so you know the types of waves that can pummel this area:
The seller paid $26,150,000 for the two properties, and purchased both at the bottom in 2009:
In February, these sellers bought our listing in Aviara Point for $3,365,000. They moved, then just sold this beach-close newer one-story with killer garage. They made out good too:
It was on this tour in 1982 that I saw the Who at the L.A. Sports Arena. It was the loudest concert I’ve ever attended, and my ears were ringing for a week – and I was in the back!
Whoops it wasn’t the 1982 tour.
It was the 1980 tour that I saw – look at the Townshend leap:
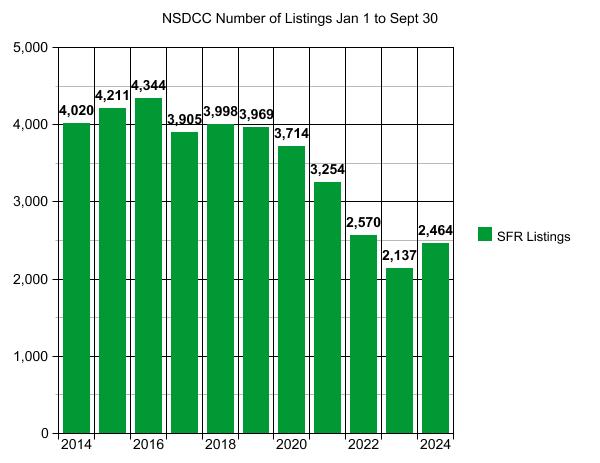
There are several reasons why I think the local inventory will surge in 2025. It will be due to several causes contributing more houses for sale, and all combined it may look like a flood in some areas.
Been Trending That Way in 2024 – The inventory this year has been +15% more than last year, making it look like we have already hit bottom, and the number of listings will keep growing. It may not get back to the 4,000+ like it was in the pre-covid years, but 3,000+ should be a lock in 2025 (+22% over this year).
2024 Leftovers – We have 100+ of this year’s listings waiting until 2025 to not sell (unless they adjust).
More Baby Boomers Are Dying – According to the CDC, the number of deaths per year in the U.S. has been steadily increasing, in part because of the Baby Boomers’ advancing age. Estimates suggest that Boomers will account for millions of deaths over the next two decades as they continue to reach their 80s and beyond. There were 1.6 million boomers who died last year, and the number will be above two million by the year 2030.
Prop 19 – Those who have already inherited a home from their parents or grandparents since 2020 have had to occupy the property as their primary residence to inherit the lower property tax rate too. But the old family homestead needs work and/or the other siblings want their dough. Renting the house triggers the higher property taxes, so that’s no longer a viable choice. More of these will decide to sell instead.
Politics – The 49% who don’t have the election go their way will threaten to move to cure their ills. Most won’t actually get around to it, but I’m guessing more will move than before.
Jackpot – In 2023, total U.S. credit card debt surpassed $1 trillion for the first time, reflecting a significant increase over pre-pandemic levels. More homeowners in that group will throw in the towel and finally decide to sell the house to lighten the load, and move out-of-state where they can live the rest of their life on their home-sale proceeds.
There is enough demand to soak up all of the additional inventory – but at what price?
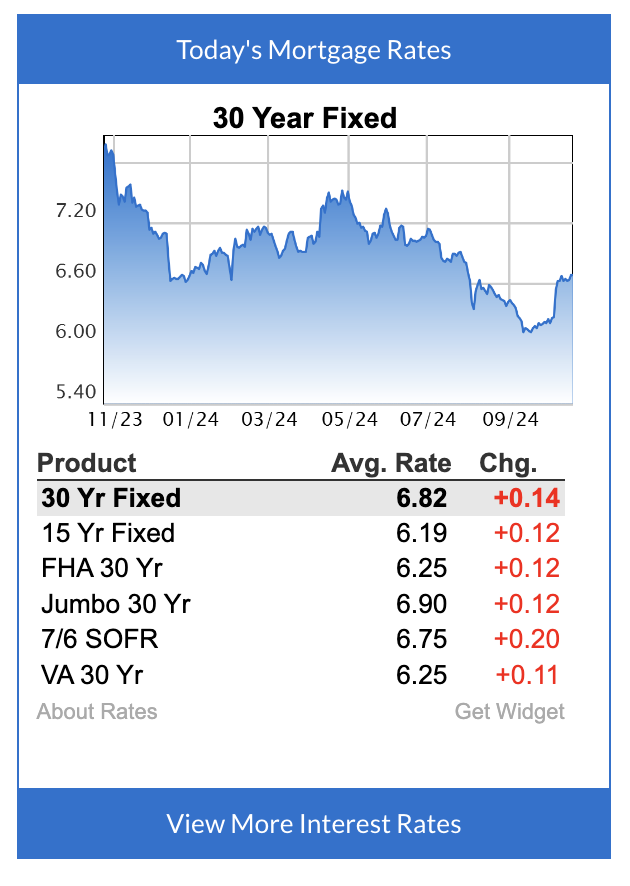
By the smallest of margins, mortgage rates are back up to levels last seen in July. That means we’ve gone from being fairly close to 6% in mid-September to being nearly as close to 7% today when it comes to top tier 30yr fixed scenarios for the average lender.
Today’s jump was particularly quick and frustratingly lacking in satisfying explanations. It’s not the explanations make bad news any more palatable, but it’s always more frustrating to be confronted with unpleasantness that seems to be happening for no good reason.
There are several theories, but nothing as obvious or demonstrable as a surprise result in a key piece of economic data. These include things like shifting election odds coupled with assumptions about policy impacts, arcane calendar issues surrounding the options market, and one of several research notes regarding U.S. deficits that have been making the rounds.
It’s unlikely that any of these factors could exclusively drive the pace of weakness seen in rates today. There are limited examples of several such factors teaming up to cause days like today, but just as often, something else comes to light in the following days that helps flesh out the explanation.
Explanations aside, it was one of the bigger jumps seen in the past few months, and by far and away the biggest jump seen on a day without a big economic report or other scheduled event.
The activity this weekend was about what I expected for the middle of October, 2024.
Happy to report that the political circus has been less of a distraction recently, and hopefully the real estate market will feel a bit of a boost from those who are motivated to move by the election’s result!
It would be natural to expect the number of active listings to be declining by now, but sellers are still hopeful. Of the 470 actives, there are 113 of them that have been on the market for 90+ days too (24%).
Those don’t have much chance of selling this year without a drastic price reduction, so we should see them again next year. Let’s expect about 100+ more listings than last year to carry over into 2025, which will be my first category of why I think there will be a surge of inventory in the next selling season!
Trustindex verifies that the original source of the review is Google.
We sold a home with Jim and Donna and from beginning to end they were consummate professionals. Their initial walk through the property resulted in a list of items to be repaired or updated. They supplied a list of vendors and job quotes to do the repairs and updates. We originally wanted to sell ‘as is’ and just get it over with. They gave us a selling price for ‘as is’ and options for doing a few updates/repairs to doing it all with the selling price for each option. We agreed to do all they suggested and we sold for the exact price they predicted. For every dollar spent we got back more than $2 back in the selling price. And they got that price in a rising interest rate environment! Donna and Jim are extremely detailed and guide you through ever aspect of the sale. There were no surprises thanks to their guidance. We couldn’t be more pleased with their representation.
Thank you Donna and Jim,
Jerry and Mary
Heather Quejada
March 27, 2025
Trustindex verifies that the original source of the review is Google.
We have known Jim & Donna Klinge for over a dozen years, having met them in Carlsbad where our children went to the same school. As long time North County residents, it was a no- brainer for us to have the Klinges be our eyes and ears for San Diego real estate in general and North County in particular. As my military career caused our family to move all over the country and overseas to Asia, Europe and the Pacific, we trusted Jim and Donna to help keep our house in Carlsbad rented with reliable and respectful tenants for over 10 years.
Naturally, when the time came to sell our beloved Carlsbad home to pursue a rural lifestyle in retirement out of California, we could think of no better team to represent us than Jim and Donna. They immediately went to work to update our house built in 2004 to current-day standards and trends — in 2 short months they transformed it into a literal modern-day masterpiece. We trusted their judgement implicitly and followed 100% of their recommended changes. When our house finally came on the market, there was a blizzard of serious interest, we had multiple offers by the third day and it sold in just 5 days after a frenzied bidding war for 20% above our asking price! The investment we made in upgrades recommended by Jim and Donna yielded a 4-fold return, in the process setting a new high water mark for a house sold in our community.
In our view, there are no better real estate professionals in all of San Diego than Jim and Donna Klinge. Buying or selling, you must run and beg Jim and Donna Klinge to represent you! Our family will never forget Jim, Donna, and their whole team at Compass — we are forever grateful to them.
Lou F
March 27, 2025
Trustindex verifies that the original source of the review is Google.
WeI had the pleasure of working with Klinge Realty Group to sell our home in Carmel Valley, and I cannot recommend them highly enough!
Jim and Donna demonstrated exceptional professionalism, offering expert guidance on market conditions and pricing strategy, which resulted in a quick and successful sale.
Communication was prompt and we were well-informed throughout the entire process.
For anyone looking for a dedicated and knowledgeable real estate team, look no further!
---
William Sams
March 25, 2025
Trustindex verifies that the original source of the review is Google.
Donna and Jim Klinge of Klinge Realty Group have our highest possible recommendation. From Donna and Jim’s first visit to our house through closing their advice and counsel was candid and honest in all dealings. They kept us fully informed throughout the process. The house sold less than three days after listing with a two-week closing. My wife and I have sold several houses during our lives. This was by far the best experience. Klinge Reality is a premium service realtor. You can’t make a better choice for someone to sell your home fast and for top dollar.
Emily Hernandez
December 29, 2024
Trustindex verifies that the original source of the review is Google.
Donna and Jim provided exceptional support and professionalism throughout the entire process. We couldn't have been happier with their efforts. They made our house shine, and thanks to their expertise, it sold above the listing price in the very first weekend! Truly a fantastic experience from start to finish.
Jesus Adrian Sahagun
November 11, 2024
Trustindex verifies that the original source of the review is Google.
This year has been difficult on our family, mainly due to having to sell our home. Thankfully we knew God had a plan for us and working with the Klinge team was a key part of it. It was an obvious decision to work with them again after such an amazing experience when purchasing the same home we needed to sell. The challenge was, how will we do this in so little time with so much going on? Jim and Donna held our hand every step of the way. Whenever an unexpected issue arose they found and provided a solution. Never once did we feel pressured to make a decision and the Klinges were always reassuring after providing the information that the decision was ours to make. Despite the curve balls, they never panicked and exemplified the “can do” attitude, making us feel optimistic and taken care of. Their expertise and professionalism was superb. But of all the reasons to work with the Klinges, the most impactful and valuable is their compassion and genuine care for their clients. We pray that we can one day purchase our forever home and you better believe that Jim and Donna will be representing us - as long as they will have us of course. Thank you again Klinge team! Your execution, experience, and care are unmatched.
SABIHA PASHA
July 23, 2024
Trustindex verifies that the original source of the review is Google.
Jim and Donna were fantastic! Jim understanding my needs, recommending potential places, pointing out the pros and cons of each property was invaluable. Then when the offer was accepted Donna’s organized guidance through the inspections, paperwork etc made the whole process seem effortless.
So grateful that I had them on my side!
Anu Koberg
July 13, 2024
Trustindex verifies that the original source of the review is Google.
We first found Jim through his blog at bubbleinfo.com, which really showcased his knowledge of SoCal real estate. Since then we've done three transactions with Jim and Donna, and they are an incredible full service agency, with Jim's deep market insight and Donna's deft contract and project management. We trust them implicitly in their analysis and strategy, which is based on years of experience. They're always available and on top of things, and we strongly recommend them to anyone.
Bjorn Isachsen
July 10, 2024
Trustindex verifies that the original source of the review is Google.
The Good
The Klinge Realty Group operates like a finely tuned machine, with a very personal touch. We contacted them on a Sunday and they were talking to us about our family and our needs on our living room couch the following day. They carefully listened to us and worked with us to identify the best and quickest path to listing within 2 weeks to take advantage of the low inventory conditions in our South Carlsbad neighborhood. They knew our tract specifically and had many previous sales there over the years - they came prepared with a thorough analysis of comparative sales and recommended a pricing strategy that they felt confident would yield offers the first weekend on the market.
The Great
Over the next two weeks Donna coordinated a range of vendors who she knew from experience could get the preparation to list work we needed done on time and with high quality. Our light tune-up involved excellent experiences with their stagers, landscapers, contractors, electricians, and plumbers. Throughout this period Donna's daily communication was clear, concise, and responsive. Any time we had questions Donna picked up the phone or texted immediately - but almost always, she answered our questions before we even knew we had them.
The Outstanding
We had a tricky situation with a shared fence that could have delayed our escrow. Donna used superb mediation skills to negotiate the terms of replacement and was personally on site with the fence contractor to make sure everything went smoothly. The fence looks great and escrow closed on time.
The Truly Exceptional
Our house came on the market on a Wednesday and between then and Monday morning Jim was personally at all three open houses. He was in constant communication explaining potential buyer reaction and strength. As he predicted offers began to come in on Saturday and each one was incrementally higher than the last. At the end we had 5 offers, 4 of which were over list, and the final accepted offer was $100,000 over list. In addition to being over list it included rent back terms that met our needs.
The Recommendation
For all of these reasons we would strongly recommend The Klinge Team to anyone wanting to sell in North County Coastal San Diego. I had been reading Jim's bubbleinfo.com blog for 15 years and knew when the time came to sell that he would be our first call. Jim Klinge is not your standard realtor. He is keenly aware of market conditions and sales strategies. And, works his tail off - though not as hard as Donna . At this point he's gone from realtor to friend and I plan to have him over to grill and chill at our new place to talk real estate, but also just about life and raising kids in San Diego. He's more interested in relationships than his sales numbers - and that's why his sales numbers are so high. We have already recommended the Klinge's to some close friends and another successful sale is on deck right around the corner...
Chris Shea
June 21, 2024
Trustindex verifies that the original source of the review is Google.
We recently had the pleasure of working with Jim and Donna from Klinge Realty Group to sell our house, and we couldn't be more satisfied with the experience. From the initial meeting, they listened attentively to our needs and provided invaluable guidance on specific improvements to get our home market ready.
Their responsiveness throughout the entire process was truly impressive. Anytime we had questions or concerns, they were quick to address them, ensuring we felt comfortable and informed every step of the way. What stood out the most was their team and extensive network of tradespeople, which made addressing any necessary repairs or updates seamless and stress-free.
Thanks to their expertise and dedication, our house sold quickly and at a great price. We highly recommend Jim and Donna to anyone looking to buy or sell a home. They are a fantastic team who truly care about their clients and deliver exceptional results.