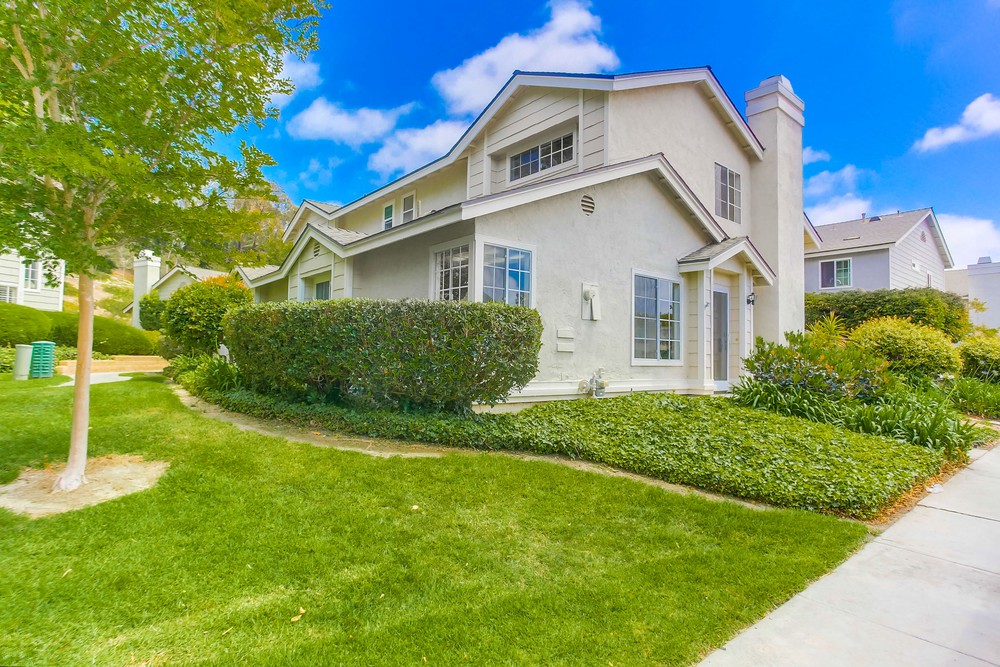
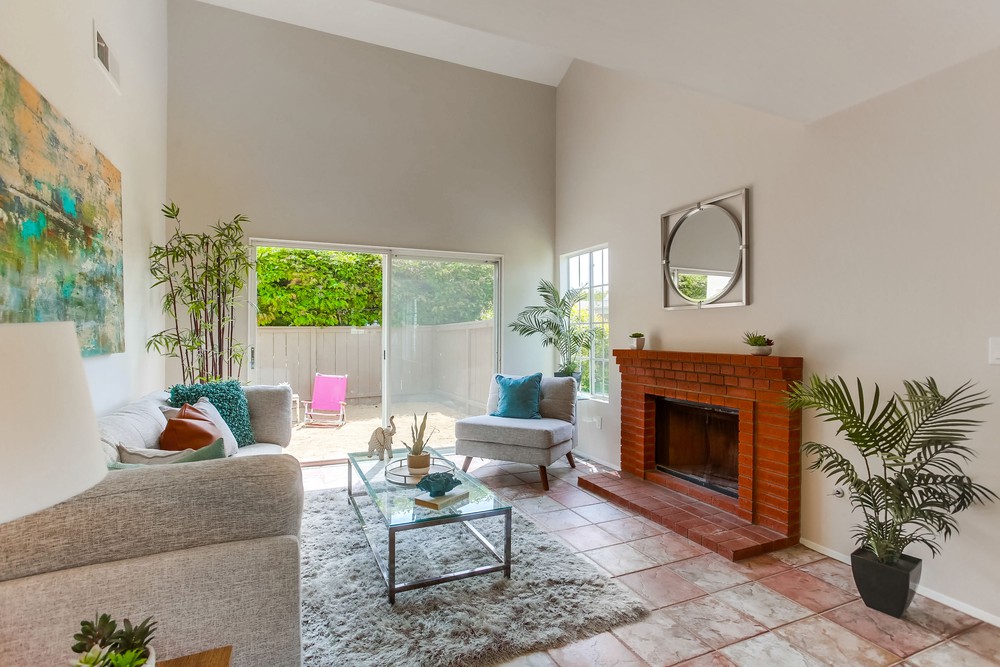
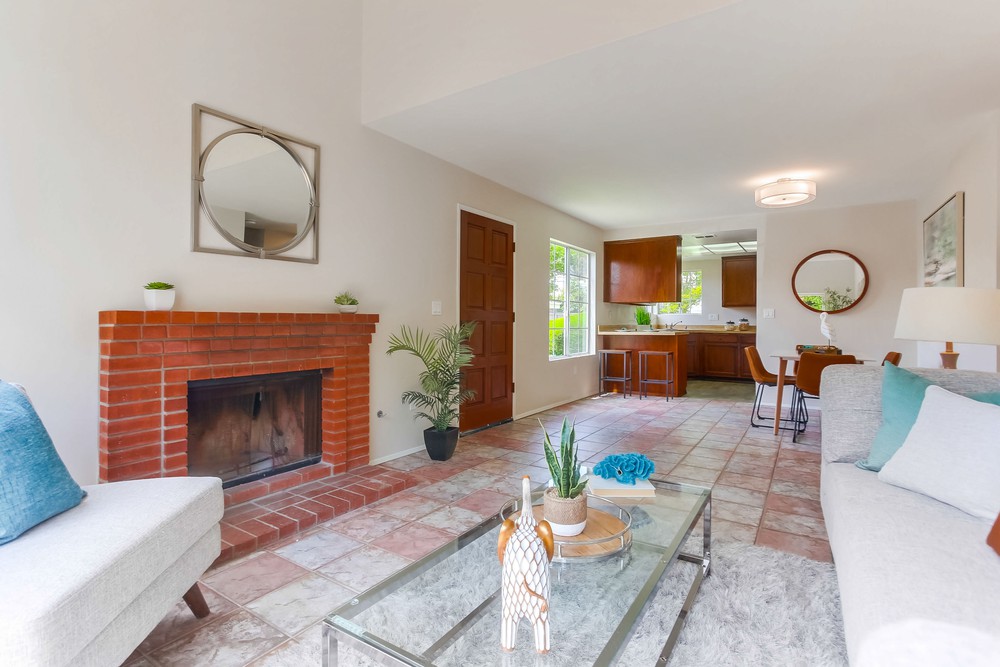
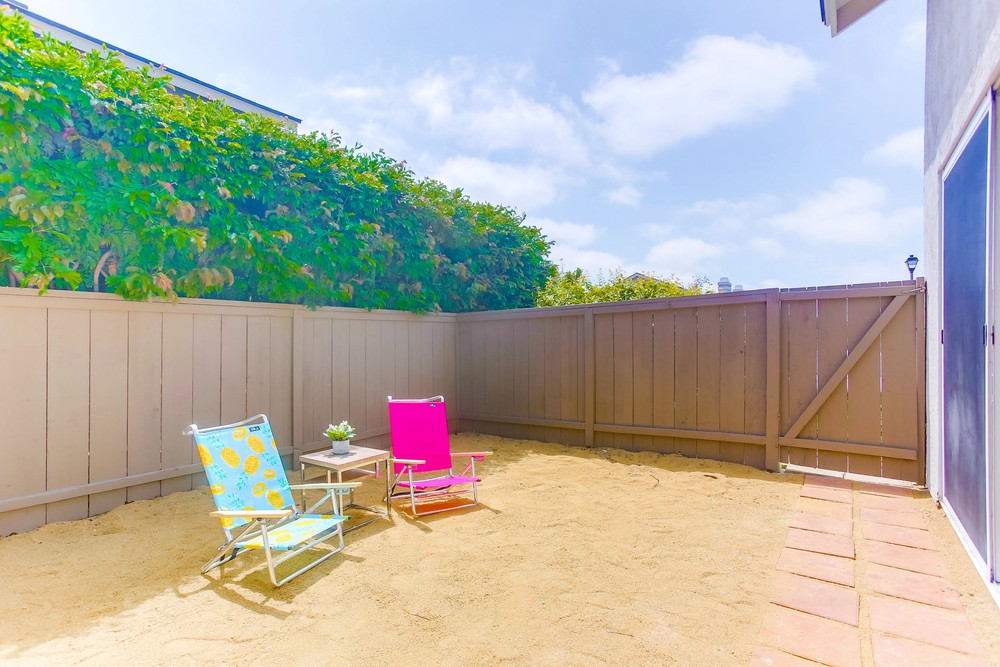
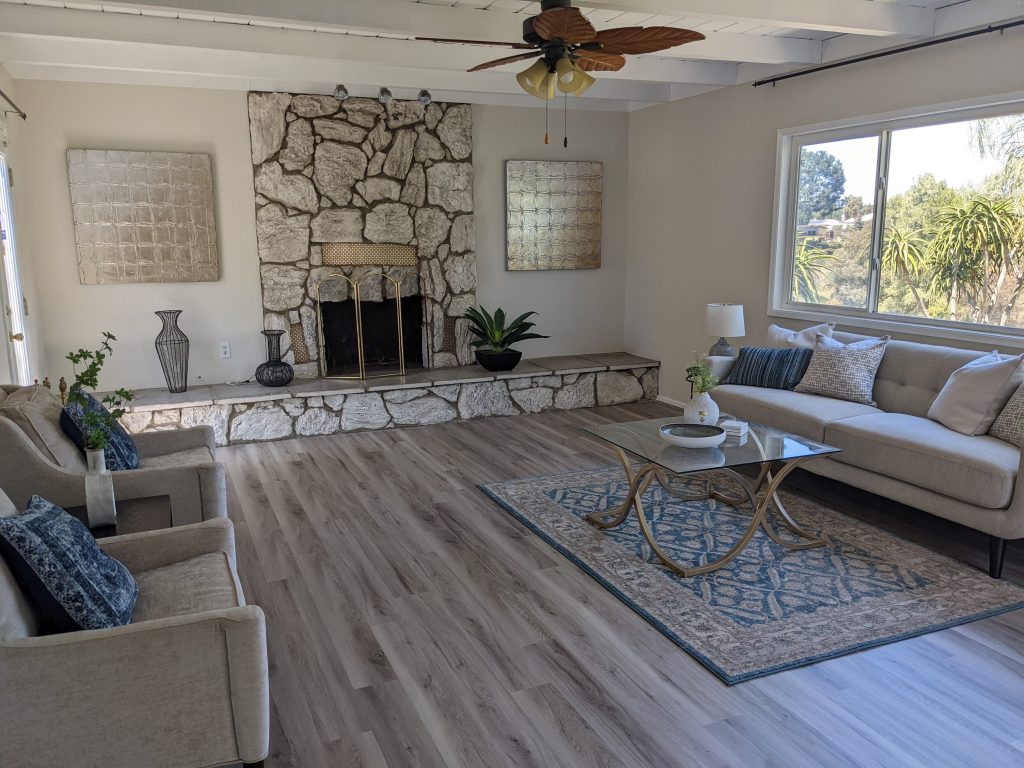
Are you looking for a reasonably-priced home in Calavera Hills? The last two sales of this model were $850,000 and $860,000! Wonderfully refreshed and full of natural light, this two-story townhome has new paint & carpet, new light fixtures and a brand new stove! Bedrooms on both floors too! This is in a preferred location near parking so you don’t have to lug your kids and groceries all over the complex to get home. The Crest is a delightful neighborhood with lower HOA fee and community pool & spa. Be a regular at the Calavera Hills Community Park nearby. Recent model-match sales were 2840 Hillsboro $850,000 on 3/7/22 and 2842 Hillsboro $860,000 on 4/27/22.
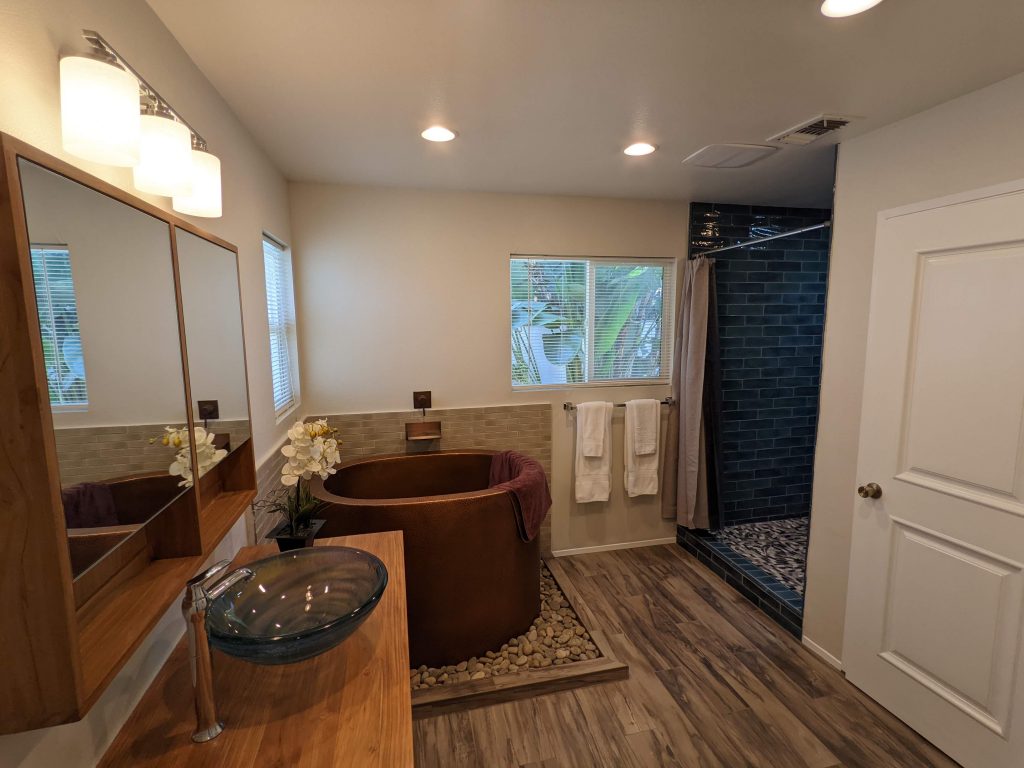
This is your chance to own a piece of paradise. With views that overlook the Tecolote Canyon, this home is perfect for those who love nature and want to enjoy the tranquility that it provides. This home has been lovingly taken care of by its current owner, and many upgrades have been made in recent years, including fresh paint both inside and out in the past month. The Main Bathroom was upgraded with a custom Ofuro bathtub and Japanese spa retreat decor, which cost $40,000+.
There is rampant speculation that home prices must come down to compensate for higher rates. But there is another solution.
Fewer sales.
We learned a couple of lessons during the peak covid days:
Sellers don’t have to sell – they can wait it out.
When they do, the market can survive with fewer sales.
Look at the NSDCC sales in the past months of May:
2018: 273
2019: 297
2020: 143
2021: 300
2022: 126 so far
We might not hit 200 sales this month, and while the doomers and mainstream media will be talking about how the demand has been crushed and there is no hope, will the sellers panic? Even if they aren’t receiving offers? Or not having any showings at all?
Have you seen anyone dump on price yet? Not really.
Are today’s sellers willing to keep reducing their price until they find what the market will bear? Doubt it – and after two price reductions (three tops) they will give up, rather than keep lowering the price. They can blame on ‘the market’, or on their realtor, and decide to try again next year.
Anybody who needs the money can borrow against their hefty equity positions or get a reverse mortgage. If they can’t make their payments, they can float for 6-12 months while their lender decides if they want to get back into the foreclosure business, which is California means you have to offer the borrower a loan modification before you can foreclose. It will be months, and probably years, before we see any real foreclosure activity – if any. If they have to, the non-payers can drag it out at least until next year, live for free, and just sell for less then.
Sellers might get a little antsy, but it will take more than that to give up hope of cashing in that big ticket. They have been dreaming for months about what they are going to do with all that money, and they aren’t going to give up on those dreams easily.
Price-wise, we will hang out in Plateau City.
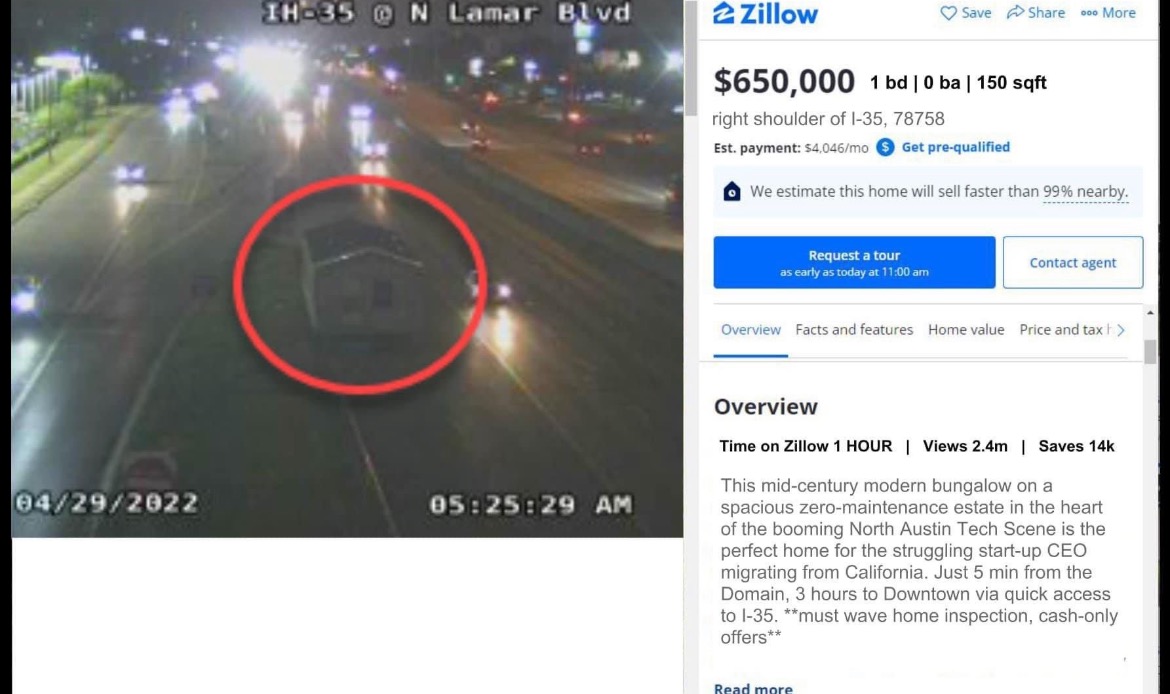
There will be an occasional big sale that keeps everyone optimistic – this will be the next one in South Carlsbad which was on our private site at $3,100,000 but hit the open market at $2,880,000, which should really rev the engines this weekend:
The new market conditions will bear some resemblance to the past, but to believe that real estate sales will be ‘getting back to normal’ some day would be full of false hope. Rob Dawg said it long ago – we need to abandon all previous assumptions.
Let’s start with the two things most likely to change:
Buyers are going to stop paying over the list price.
Buyers are going to stop making offers the minute a house hits the market.
The frenzy conditions that sellers have enjoyed over the last two years will now be in question, and take some finesse to navigate. If buyers are reluctant to pay over the list price, it means that they may even want to pay less than the list price. Then for some listings, there might not be any buyers – at least none willing to pay close to list.
What’s worse is that buyers and their agents won’t be comfortable making low offers, so they just won’t offer at all. Sellers who get no offers will only know that their price is wrong – they won’t know how wrong. Plus, they might not even get any showings, let alone offers.
What variables will make the difference between selling, and not selling?
Comps aren’t going to matter much. Just because there are high sales nearby doesn’t mean that tomorrow’s sellers are going to automatically get the same money or more – especially if the new listing has a defect or unusual feature.
The differences between schools is getting fuzzy. We have become a little too reliant on the online school reviews, and there are going to be parents who spread negative stuff around – and unfortunately, there might be some truth to it. No school is perfect, and the best education is a good upbringing at home. If that’s the case, then why pay larger-than-ever premiums to be in the ‘best’ school district? Some buyers will be attracted to the better home values further out in the suburbs.
Work-From-Home is here to stay. If you WFH and already considering private schools or taking a chance on the lesser-known public schools, then the need to pay a big premium to be closer to downtown won’t be as urgent and the outskirts will benefit. Plus, there is a new car-pool lane on the I-5! The homes that have multiple spaces to accommodate the work-from-home buyers will benefit.
The easy cure for higher prices & rates is buying a smaller house. Before buyers think about sacrificing on location, they will consider buying a smaller home – and most people can find a way to live with 3,000sf to 4,000sf. As a result, the big bombers aren’t going to get the same $/sf for square footage over 4,000sf unless they have larger yards with a pool. It means we should see 4,500sf and 5,500sf homes selling for about the same price – which is different than it’s been.
Smaller yards should get penalized. While a smaller house might work, those with tiny yards won’t be as appealing post-frenzy. At these prices, buyers will be reluctant to compromise on the most-important stuff, and having a decent yard is high on the list.
The homes that have everything going for them should continue to be popular and sell for a premium.
The rest? The price gap between the dogs and the creampuffs should widen, and market times extend dramatically as sellers and agents will be slow to react.
Sellers will be smart to spruce up their home more than they had planned, make sure their price is attractive, and hire a great realtor!
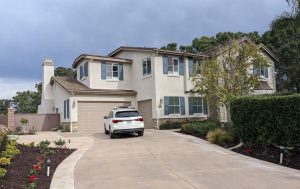
With the Crescent House now on the market for $23.5 million, you can’t really blame the sellers of this property for asking $6 million (lot size is 9,730sf):
I mentioned that we could be seeing a pause in the market, and for prospective home buyers, there are plenty of reasons to take a rest:
Mortgage rates starting with a 5, not a three.
The S&P 500 and Dow are down 15.9% and 11.3%, year-to-date.
The list prices of homes for sale are higher than comps.
There are very few superior homes coming to market.
It’s a good time for graduation/vacation season!
When I look at the current batch of unsold homes, I don’t see any surprises. Either they are inferior homes/locations, or the list price is too optimistic (or both). It’s natural to add a little extra mustard to a list price so the optimism isn’t a complete turnoff if the home has been upgraded nicely and is well presented.
Buyers taking their time and being more picky about what they will tolerate is a good thing for everyone. The sellers who do everything right (spruce-up, price attractively, and are easy to show and sell) will be rewarded, and those who don’t will languish.
It is a big change from the last two years when the frenzy caused buyers to jump for the inferior or overpriced homes AND pay over list for them too. Those days are gone.
If you see more than an occasional quality home not selling, then we have bigger problems. But for now, buyers could just be waiting for some quality inventory at a decent price!
Of the 109 houses that have closed escrow this month, only 22 of them sold for less than the list price. Eight percent sold have for list price or higher!
Happy to report that the new custom contemporary in Cardiff whose proceeds were going directly to the Rancho Coastal Humane Society did sell for $6,750,000 cash or $1,650,000 over it’s list price:
For those who have been waiting for prices to tumble, here you go!
This listed for $3,545,000 in January right when there was a flurry of $3,000,00-ish listings in and out of Encinitas Ranch. It took 76 days to finally find the buyer for this one – and it did close at a discount.
It sold for $3,520,000, which was a whopping $25,000 off the list price!
Home buyers who value their privacy don’t like seeing their home’s photo gallery advertised on Zillow after the sale is completed. Zillow has made it easier to remove those photos!
Here are the instructions:
To add or remove photos on your home’s property page, you must claim ownership of your home’s property page and navigate to the Edit Facts screen.
Sign in to your Zillow profile.
Click on the profile icon, then select Your Home from the menu option.
Click on the tile for your home to load the property page. If you have not already claimed your home on Zillow, please follow these steps.
Once you have claimed your home, click on the Edit Facts icon from the Owner View of the property page.
To add photos, click the Upload photos button under Photos & media.
You will be prompted to select photo files stored on your computer to upload.
To remove a photo, click on an individual photo and click Remove Photo.
To rearrange photos, click on the individual photo and hold the left mouse button down. Drag any photo to the desired place in the photo grouping order.
Save your changes by clicking the Save Changes button at the bottom of the page.
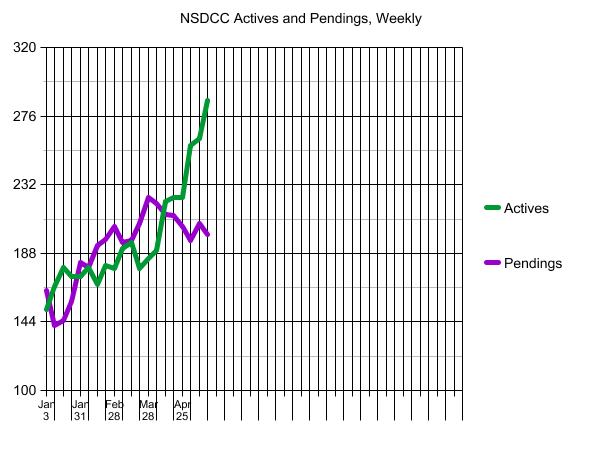
Everyone complained that we had no inventory….well, we have more now! But the 286 active listings today is still well under the 349 actives that we had last year at this time, and more listings should cause more sales.
We’ll see if the slight pause in the market can be attributed to the usual graduation-season malaise, or if a full-blown buyers’ strike is underway.
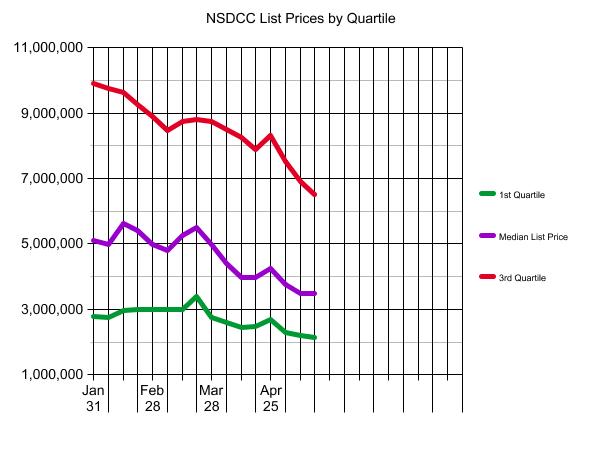
This isn’t the only measuring stick, but it appears that pricing has been settling down:
Most sellers are going to wait it out, or cancel their listing – neither of which will satisfy the buyers who are hoping for a major adjustment.
Trustindex verifies that the original source of the review is Google.
Jim & Donna Klinge helped us sell our home of 30 years in Ocean Hills. We were very happy with their service and would HIGHLY recommend them to anyone looking for an Honest, Knowledgeable, Skilled, Informed Efficient realty team. Both Jim & Donna were so helpful in different ways and complemented each others skills. Please refer to a more detailed review that we wrote on YELP. Thank You Both for all your help!!!
Jesse O'Hara
June 12, 2025
Trustindex verifies that the original source of the review is Google.
A+ thank you
Lisa Tuomi
June 11, 2025
Trustindex verifies that the original source of the review is Google.
Many years ago, we purchased a home in Carlsbad, using a realtor that was recommended to us - Jim Klinge. Fast forward to 2025, we recently had the privilege of selling 2 homes in Carlsbad, CA and didn't hesitate to reach out to Jim and Donna Klinge of Klinge Realty Group to guide us through the sales. The transactions were very different, each with its own unique situation, opportunities and challenges. From start to finish, Donna and Jim helped navigate the pre-sale preparation, the listing, showing of the house, buyer negotiations, the final close and all of the paperwork and decisions in between. What stands out with both transactions is the professionalism of Jim and Donna (and their team), wonderful communication (timely, relevant, concise), their deep understanding of market dynamics (setting realistic expectations), their access to top-notch contractors, and last, their ability to guide us across the finish line successfully. We wouldn't hesitate to use Jim and Donna in the future and highly recommend them for anyone looking to buy or sell a property in North San Diego County.
Jerry Meyer
March 28, 2025
Trustindex verifies that the original source of the review is Google.
We sold a home with Jim and Donna and from beginning to end they were consummate professionals. Their initial walk through the property resulted in a list of items to be repaired or updated. They supplied a list of vendors and job quotes to do the repairs and updates. We originally wanted to sell ‘as is’ and just get it over with. They gave us a selling price for ‘as is’ and options for doing a few updates/repairs to doing it all with the selling price for each option. We agreed to do all they suggested and we sold for the exact price they predicted. For every dollar spent we got back more than $2 back in the selling price. And they got that price in a rising interest rate environment! Donna and Jim are extremely detailed and guide you through ever aspect of the sale. There were no surprises thanks to their guidance. We couldn’t be more pleased with their representation.
Thank you Donna and Jim,
Jerry and Mary
Heather Quejada
March 27, 2025
Trustindex verifies that the original source of the review is Google.
We have known Jim & Donna Klinge for over a dozen years, having met them in Carlsbad where our children went to the same school. As long time North County residents, it was a no- brainer for us to have the Klinges be our eyes and ears for San Diego real estate in general and North County in particular. As my military career caused our family to move all over the country and overseas to Asia, Europe and the Pacific, we trusted Jim and Donna to help keep our house in Carlsbad rented with reliable and respectful tenants for over 10 years.
Naturally, when the time came to sell our beloved Carlsbad home to pursue a rural lifestyle in retirement out of California, we could think of no better team to represent us than Jim and Donna. They immediately went to work to update our house built in 2004 to current-day standards and trends — in 2 short months they transformed it into a literal modern-day masterpiece. We trusted their judgement implicitly and followed 100% of their recommended changes. When our house finally came on the market, there was a blizzard of serious interest, we had multiple offers by the third day and it sold in just 5 days after a frenzied bidding war for 20% above our asking price! The investment we made in upgrades recommended by Jim and Donna yielded a 4-fold return, in the process setting a new high water mark for a house sold in our community.
In our view, there are no better real estate professionals in all of San Diego than Jim and Donna Klinge. Buying or selling, you must run and beg Jim and Donna Klinge to represent you! Our family will never forget Jim, Donna, and their whole team at Compass — we are forever grateful to them.
Lou F
March 27, 2025
Trustindex verifies that the original source of the review is Google.
WeI had the pleasure of working with Klinge Realty Group to sell our home in Carmel Valley, and I cannot recommend them highly enough!
Jim and Donna demonstrated exceptional professionalism, offering expert guidance on market conditions and pricing strategy, which resulted in a quick and successful sale.
Communication was prompt and we were well-informed throughout the entire process.
For anyone looking for a dedicated and knowledgeable real estate team, look no further!
---
William Sams
March 25, 2025
Trustindex verifies that the original source of the review is Google.
Donna and Jim Klinge of Klinge Realty Group have our highest possible recommendation. From Donna and Jim’s first visit to our house through closing their advice and counsel was candid and honest in all dealings. They kept us fully informed throughout the process. The house sold less than three days after listing with a two-week closing. My wife and I have sold several houses during our lives. This was by far the best experience. Klinge Reality is a premium service realtor. You can’t make a better choice for someone to sell your home fast and for top dollar.
Emily Hernandez
December 29, 2024
Trustindex verifies that the original source of the review is Google.
Donna and Jim provided exceptional support and professionalism throughout the entire process. We couldn't have been happier with their efforts. They made our house shine, and thanks to their expertise, it sold above the listing price in the very first weekend! Truly a fantastic experience from start to finish.
Jesus Adrian Sahagun
November 11, 2024
Trustindex verifies that the original source of the review is Google.
This year has been difficult on our family, mainly due to having to sell our home. Thankfully we knew God had a plan for us and working with the Klinge team was a key part of it. It was an obvious decision to work with them again after such an amazing experience when purchasing the same home we needed to sell. The challenge was, how will we do this in so little time with so much going on? Jim and Donna held our hand every step of the way. Whenever an unexpected issue arose they found and provided a solution. Never once did we feel pressured to make a decision and the Klinges were always reassuring after providing the information that the decision was ours to make. Despite the curve balls, they never panicked and exemplified the “can do” attitude, making us feel optimistic and taken care of. Their expertise and professionalism was superb. But of all the reasons to work with the Klinges, the most impactful and valuable is their compassion and genuine care for their clients. We pray that we can one day purchase our forever home and you better believe that Jim and Donna will be representing us - as long as they will have us of course. Thank you again Klinge team! Your execution, experience, and care are unmatched.
SABIHA PASHA
July 23, 2024
Trustindex verifies that the original source of the review is Google.
Jim and Donna were fantastic! Jim understanding my needs, recommending potential places, pointing out the pros and cons of each property was invaluable. Then when the offer was accepted Donna’s organized guidance through the inspections, paperwork etc made the whole process seem effortless.
So grateful that I had them on my side!