Buyers thought this was a holiday weekend, and sellers didn’t!
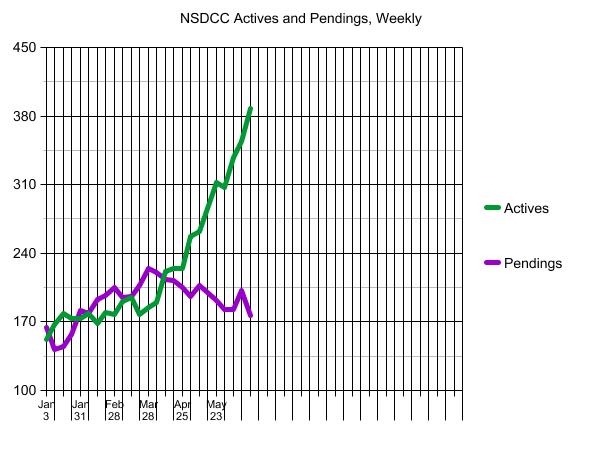
It was the week that the actives-to-pendings ratio between La Jolla and Carlsbad crossed back over the ideal 2:1 range, which is what we have observed to be the sign of a healthy market in the past.
Last week: 354/202, or 1.75
This week: 388/177, or 2.19
Here is the breakdown by price range:
NSDCC Actives and Pendings
Price Range
Active Listings
Pending Listings
A/P
0-$1.5M
46
22
2.1
$1.5-$2.0M
57
41
1.4
$2.0-$3.0M
91
59
1.5
$3.0-$4.0M
52
26
2.0
$4.0M+
148
35
4.2
The high-end firmly believes that it takes longer to sell the uber-expensive homes, so they are happy to wait for their magic moment – and typically have the resources to do so.
I wrote offers for buyers around the $2,000,000 range, and both listing agents claimed to have multiple offers. It may take longer to reach an accepted offer these days as listing agents wait for better deals to arrive, so let’s check back on the pendings in a couple of days.
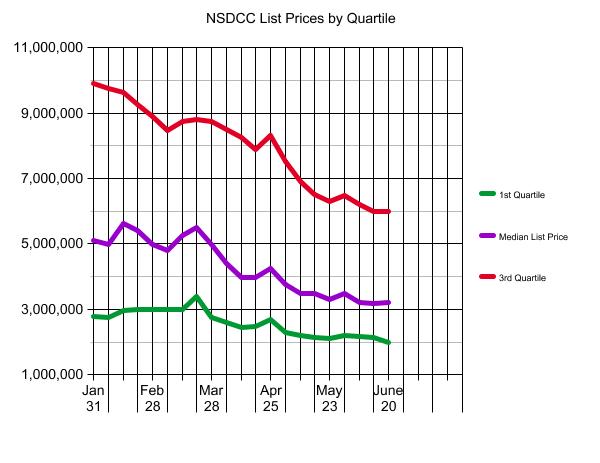
This is what Plateau City looks like – plenty of unsolds preferring to sit, than reduce.
Buyers and sellers will be tempted to sit out the rest of the year, and the resulting environment could actually get quite boring as we’re all standing around watching sales drop.
We just need to survive until the 2023 Selling Season, because the market will really get sorted out!
“A father doesn’t tell you that he loves you. He shows you.” —Dimitri the Stoneheart
“A good father is one of the most unsung, unpraised, unnoticed, and yet one of the most valuable assets in our society.” – Billy Graham
“Dads are most ordinary men turned by love into heroes, adventurers, story-tellers and singers of song.” – Pam Brown
“My father gave me the most valuable gift anyone could give another person. He believed in me”.
Jim Valvano
“When my father didn’t have my hand, he had my back.” – Linda Poindexter
“In my career, there’s many things I’ve won and many things I’ve achieved but for me, my greatest achievement is my children and my family.”
David Beckham
“Any fool can have a child, but that doesn’t make you a father. It’s the courage to raise a child that makes a father.” – Barack Obama
“A father carries pictures where his money used to be.” – Steve Martin
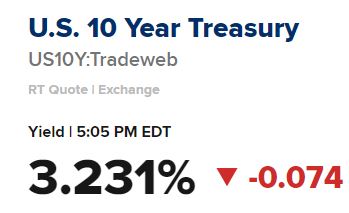
Over the last few decades, the 30-yr fixed mortgage rate has run at 1.75% over the 10-yr yield – which if true today, it would put us at 5.0%, instead of 6.0%. Here’s what the MND thinks about the bond yields:
As for Treasuries, yields are now high enough as to be pricing in virtually all of the expected Fed rate hikes over the next year. Once that happens, the only way for them to go much higher is for the data to deteriorate further. Bottom line: if we can avoid upside inflation surprises like last Friday’s, we may have just seen the highest rates of the year.
If the bond yields settle down (the 10-year was 3.48% on Monday), and bring in more MBS buyers, then maybe the mortgage companies can give up the extra 1% spread they are sitting on today. Our chances of survival will be much more likely with 5% mortgage rates, then 6%!
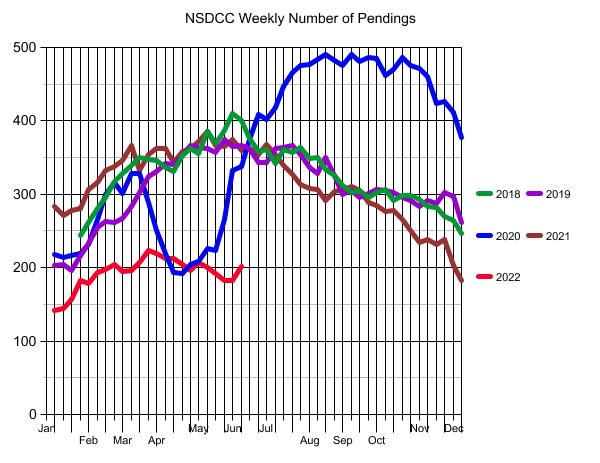
The California Association of Realtors said that the number of pendings has been falling.
They don’t give any other details or interpretations, so what will casual readers conclude?
The market must be coming apart!
Thanks C.A.R.!
But because pendings and sales are directly related to inventory, we must consider the impact of having fewer homes for sale. Look how dramatically the inventory has dropped recently, and yet we still had a good amount of sales, relatively:
NSDCC Detached-Homes
Year
Total Listings, Jan 1 to May 31
Total Sales, Jan 1 to May 31
Sales/Listings
2018
2,222
1,112
50%
2019
2,273
1,099
48%
2020
1,855
871
47%
2021
1,780
1,322
74%
2022
1,349
946
70%
In 2021, the frenzy was so hot that every house was selling, and the lower inventory wasn’t as obvious because the sales count was tremendous. But now that the number of homes for sale has really dried up, the impact on pendings and sales is more noticeable – at least for those who are willing to look that far.
This year has been really great! The rest of the year will probably be less great. It might even get back to 2018-2019 levels, which is fine – that’s the way it always was. We could handle worse if we had to.
This is our third look this year at a house in the Ranch of Carlsbad – the other two closed over $4,000,000 (one famously at $1,000,000 over list). This property didn’t sell in the first month, probably due to the interior looking somewhat original and in the Ranch – where lots are at least a half-acre – buyers expect more usable yard. The listing went live on April 7th at $3,400,000, they lowered it a month later to $3,250,000, and then it went pending on May 27th. It closed three weeks later for $3,175,000, which is a modest 2% discount off list.
Seeing how the government got us into this, let’s note that they are willing to carry some of the burden of higher mortgage rates. At today’s rates, buyers can write off twice as much mortgage interest!
Signed in 2017, the Tax Cuts and Jobs Act (TCJA) changed individual income tax by lowering the mortgage deduction limit to loans of $750,000 and under.
Let’s compare the amount of interest that is deductible in the first year:
$750,000 @ 3% = $22,285.85
$750,000 @ 6% = $44,749.47
The 30-year fixed-rate mortgage payment for $750,000 @ 6% is $4,496.63. To qualify, a buyer would have to earn approximately $200,000 per year, which would put them in the 32% tax bracket.
It means today’s buyer would pay about $7,188 less in federal tax in the first year, or ~$600 per month.
The difference between the 3% and 6% mortgage payments is $1,334 per month. With the additional $600 per month in tax savings, it means Uncle Sam picks up about 45% of the difference!
Now he’s done it. Chairman Powell’s remarks yesterday (and my comments at bottom):
Rates were very low. A good place to start is rates were very very low for quite a while because of the pandemic and you know the need to do everything we could to support the economy when unemployment was 14% and the true unemployment rate was well higher than that. So …
And that … that was a, uh, rates were low and now they are coming back up to more normal or above levels. So … in the meantime, while rates were low and while demand was really high … obviously demand for housing changed from wanting to live in urban areas to some extent to living in single family homes in the suburbs. Famously. And so, the demand was just suddenly much higher.
So we saw prices moving up very very strongly for the last couple of years.
So that changes now. And rates have moved up. We are well aware that mortgage rates have moved up a lot. And you are seeing a changing housing market. We are watching it to see what will happen.
How much will it really affect residential investment? Not really sure.
How much will it affect housing prices? Not really sure. Obviously, we are watching that quite carefully. You’d think over time … There is a tremendous amount of supply in the housing market of unfinished homes … and as those come online …
Whereas the supply of finished homes, inventory of finished homes for sale is incredibly low. Historically low. So it’s a very tight market. So prices might keep going up for a while, even in a world where rates are up. So it’s a complicated situation and we watch it very carefully.
I’d say if you are homebuyer, somebody or a young person looking to buy a home, you need a bit of a reset. We need to get to back to a place where supply and demand are back together and where inflation is down low again, and mortgage rates are low again.
This will be a process were by ideally, we do our work in a way were the housing market settles in a new place. And housing and credit availability are at appropriate levels.
Good grief!
One of the most powerful players in the world is making moves that will negatively affect every American, and he’s not sure how it will turn out? Did you ask anyone? Did you seek advice from anybody who is actively involved with the real estate market (not economists) to get some opinions?
Certainly, someone from the real estate industry will help him out….like Larry:
Oh, ok great. In response to her question about whether home prices will go down, he said we should produce more oil to reduce gas prices and lower inflation so mortgage rates could come down and make homes more affordable. Thanks for clearing that up, Larry!
What nobody is considering is that SELLERS GET A VOTE. If potential home sellers think that the Fed is trying to tank the real estate market, then they won’t sell now – they will wait for better days ahead.
I talk to buyers and sellers every day. I’ve knocked 1,000+ doors this year in search of potential home sellers, and haven’t gotten a single listing. The ridiculously high price they can get today isn’t enough to get them to sell. If they think that we’ve past the peak, they really won’t move!
Buyers need a reset, alright. But this won’t be it!
Trustindex verifies that the original source of the review is Google.
Jim & Donna Klinge helped us sell our home of 30 years in Ocean Hills. We were very happy with their service and would HIGHLY recommend them to anyone looking for an Honest, Knowledgeable, Skilled, Informed Efficient realty team. Both Jim & Donna were so helpful in different ways and complemented each others skills. Please refer to a more detailed review that we wrote on YELP. Thank You Both for all your help!!!
Jesse O'Hara
June 12, 2025
Trustindex verifies that the original source of the review is Google.
A+ thank you
Lisa Tuomi
June 11, 2025
Trustindex verifies that the original source of the review is Google.
Many years ago, we purchased a home in Carlsbad, using a realtor that was recommended to us - Jim Klinge. Fast forward to 2025, we recently had the privilege of selling 2 homes in Carlsbad, CA and didn't hesitate to reach out to Jim and Donna Klinge of Klinge Realty Group to guide us through the sales. The transactions were very different, each with its own unique situation, opportunities and challenges. From start to finish, Donna and Jim helped navigate the pre-sale preparation, the listing, showing of the house, buyer negotiations, the final close and all of the paperwork and decisions in between. What stands out with both transactions is the professionalism of Jim and Donna (and their team), wonderful communication (timely, relevant, concise), their deep understanding of market dynamics (setting realistic expectations), their access to top-notch contractors, and last, their ability to guide us across the finish line successfully. We wouldn't hesitate to use Jim and Donna in the future and highly recommend them for anyone looking to buy or sell a property in North San Diego County.
Jerry Meyer
March 28, 2025
Trustindex verifies that the original source of the review is Google.
We sold a home with Jim and Donna and from beginning to end they were consummate professionals. Their initial walk through the property resulted in a list of items to be repaired or updated. They supplied a list of vendors and job quotes to do the repairs and updates. We originally wanted to sell ‘as is’ and just get it over with. They gave us a selling price for ‘as is’ and options for doing a few updates/repairs to doing it all with the selling price for each option. We agreed to do all they suggested and we sold for the exact price they predicted. For every dollar spent we got back more than $2 back in the selling price. And they got that price in a rising interest rate environment! Donna and Jim are extremely detailed and guide you through ever aspect of the sale. There were no surprises thanks to their guidance. We couldn’t be more pleased with their representation.
Thank you Donna and Jim,
Jerry and Mary
Heather Quejada
March 27, 2025
Trustindex verifies that the original source of the review is Google.
We have known Jim & Donna Klinge for over a dozen years, having met them in Carlsbad where our children went to the same school. As long time North County residents, it was a no- brainer for us to have the Klinges be our eyes and ears for San Diego real estate in general and North County in particular. As my military career caused our family to move all over the country and overseas to Asia, Europe and the Pacific, we trusted Jim and Donna to help keep our house in Carlsbad rented with reliable and respectful tenants for over 10 years.
Naturally, when the time came to sell our beloved Carlsbad home to pursue a rural lifestyle in retirement out of California, we could think of no better team to represent us than Jim and Donna. They immediately went to work to update our house built in 2004 to current-day standards and trends — in 2 short months they transformed it into a literal modern-day masterpiece. We trusted their judgement implicitly and followed 100% of their recommended changes. When our house finally came on the market, there was a blizzard of serious interest, we had multiple offers by the third day and it sold in just 5 days after a frenzied bidding war for 20% above our asking price! The investment we made in upgrades recommended by Jim and Donna yielded a 4-fold return, in the process setting a new high water mark for a house sold in our community.
In our view, there are no better real estate professionals in all of San Diego than Jim and Donna Klinge. Buying or selling, you must run and beg Jim and Donna Klinge to represent you! Our family will never forget Jim, Donna, and their whole team at Compass — we are forever grateful to them.
Lou F
March 27, 2025
Trustindex verifies that the original source of the review is Google.
WeI had the pleasure of working with Klinge Realty Group to sell our home in Carmel Valley, and I cannot recommend them highly enough!
Jim and Donna demonstrated exceptional professionalism, offering expert guidance on market conditions and pricing strategy, which resulted in a quick and successful sale.
Communication was prompt and we were well-informed throughout the entire process.
For anyone looking for a dedicated and knowledgeable real estate team, look no further!
---
William Sams
March 25, 2025
Trustindex verifies that the original source of the review is Google.
Donna and Jim Klinge of Klinge Realty Group have our highest possible recommendation. From Donna and Jim’s first visit to our house through closing their advice and counsel was candid and honest in all dealings. They kept us fully informed throughout the process. The house sold less than three days after listing with a two-week closing. My wife and I have sold several houses during our lives. This was by far the best experience. Klinge Reality is a premium service realtor. You can’t make a better choice for someone to sell your home fast and for top dollar.
Emily Hernandez
December 29, 2024
Trustindex verifies that the original source of the review is Google.
Donna and Jim provided exceptional support and professionalism throughout the entire process. We couldn't have been happier with their efforts. They made our house shine, and thanks to their expertise, it sold above the listing price in the very first weekend! Truly a fantastic experience from start to finish.
Jesus Adrian Sahagun
November 11, 2024
Trustindex verifies that the original source of the review is Google.
This year has been difficult on our family, mainly due to having to sell our home. Thankfully we knew God had a plan for us and working with the Klinge team was a key part of it. It was an obvious decision to work with them again after such an amazing experience when purchasing the same home we needed to sell. The challenge was, how will we do this in so little time with so much going on? Jim and Donna held our hand every step of the way. Whenever an unexpected issue arose they found and provided a solution. Never once did we feel pressured to make a decision and the Klinges were always reassuring after providing the information that the decision was ours to make. Despite the curve balls, they never panicked and exemplified the “can do” attitude, making us feel optimistic and taken care of. Their expertise and professionalism was superb. But of all the reasons to work with the Klinges, the most impactful and valuable is their compassion and genuine care for their clients. We pray that we can one day purchase our forever home and you better believe that Jim and Donna will be representing us - as long as they will have us of course. Thank you again Klinge team! Your execution, experience, and care are unmatched.
SABIHA PASHA
July 23, 2024
Trustindex verifies that the original source of the review is Google.
Jim and Donna were fantastic! Jim understanding my needs, recommending potential places, pointing out the pros and cons of each property was invaluable. Then when the offer was accepted Donna’s organized guidance through the inspections, paperwork etc made the whole process seem effortless.
So grateful that I had them on my side!