Buyers thought this was a holiday weekend, and sellers didn’t!
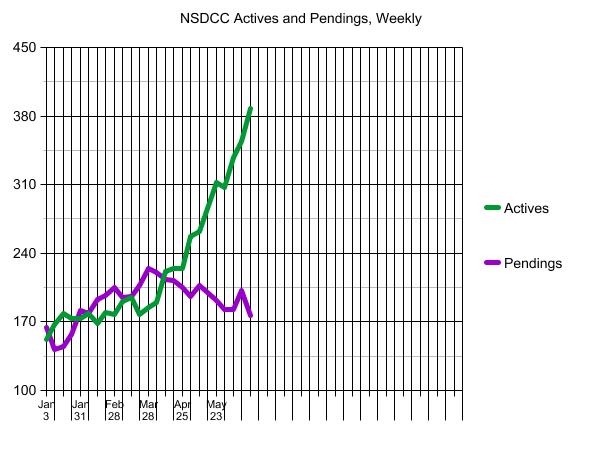
It was the week that the actives-to-pendings ratio between La Jolla and Carlsbad crossed back over the ideal 2:1 range, which is what we have observed to be the sign of a healthy market in the past.
Last week: 354/202, or 1.75
This week: 388/177, or 2.19
Here is the breakdown by price range:
NSDCC Actives and Pendings
| Price Range |
Active Listings |
Pending Listings |
A/P |
| 0-$1.5M |
46 |
22 |
2.1 |
| $1.5-$2.0M |
57 |
41 |
1.4 |
| $2.0-$3.0M |
91 |
59 |
1.5 |
| $3.0-$4.0M |
52 |
26 |
2.0 |
| $4.0M+ |
148 |
35 |
4.2 |
The high-end firmly believes that it takes longer to sell the uber-expensive homes, so they are happy to wait for their magic moment – and typically have the resources to do so.
I wrote offers for buyers around the $2,000,000 range, and both listing agents claimed to have multiple offers. It may take longer to reach an accepted offer these days as listing agents wait for better deals to arrive, so let’s check back on the pendings in a couple of days.
This is what Plateau City looks like – plenty of unsolds preferring to sit, than reduce.
~~~~~~~~~~~~~~~~~~~~~~~~~~~~~~~~~~~
The $0 – $1,500,000 Market:
| Date |
NSDCC Active Listings |
Avg. LP/sf |
Avg. DOM |
# of Pendings |
| Jan 3, 2022 |
9 |
$832/sf |
35 |
36 |
| Jan 10 |
9 |
$766/sf |
28 |
29 |
| Jan 17 |
13 |
$773/sf |
26 |
27 |
| Jan 24 |
9 |
$818/sf |
15 |
29 |
| Jan 31 |
14 |
$752/sf |
14 |
31 |
| Feb 7 |
13 |
$774/sf |
12 |
32 |
| Feb 14 |
11 |
$826/sf |
12 |
35 |
| Feb 21 |
7 |
$889/sf |
17 |
38 |
| Feb 28 |
12 |
$888/sf |
17 |
33 |
| Mar 7 |
9 |
$1,017/sf |
21 |
33 |
| Mar 14 |
14 |
$847/sf |
18 |
31 |
| Mar 21 |
8 |
$912/sf |
26 |
36 |
| Mar 28 |
10 |
$914/sf |
25 |
28 |
| Apr 4 |
10 |
$782/sf |
33 |
34 |
| Apr 11 |
19 |
$733/sf |
21 |
36 |
| Apr 18 |
16 |
$795/sf |
28 |
34 |
| Apr 25 |
18 |
$891/sf |
27 |
30 |
| May 2 |
22 |
$822/sf |
23 |
31 |
| May 9 |
24 |
$887/sf |
17 |
46 |
| May 16 |
25 |
$783/sf |
22 |
25 |
| May 23 |
29 |
$782/sf |
23 |
29 |
| May 30 |
30 |
$782/sf |
24 |
28 |
| Jun 6 |
34 |
$763/sf |
25 |
28 |
| Jun 13 |
33 |
$802/sf |
29 |
29 |
| Jun 20 |
48 |
$774/sf |
28 |
22 |
The $1,500,000 – $2,000,000 Market:
| Date |
NSDCC Active Listings |
Avg. LP/sf |
Avg. DOM |
# of Pendings |
| Jan 3, 2022 |
8 |
$842/sf |
52 |
36 |
| Jan 10 |
13 |
$751/sf |
28 |
29 |
| Jan 17 |
16 |
$736/sf |
33 |
27 |
| Jan 24 |
16 |
$801/sf |
17 |
27 |
| Jan 31 |
15 |
$696/sf |
14 |
34 |
| Feb 7 |
15 |
$765/sf |
17 |
34 |
| Feb 14 |
10 |
$726/sf |
19 |
38 |
| Feb 21 |
19 |
$715/sf |
15 |
39 |
| Feb 28 |
9 |
$660/sf |
12 |
46 |
| Mar 7 |
16 |
$789/sf |
15 |
46 |
| Mar 14 |
17 |
$837/sf |
8 |
44 |
| Mar 21 |
18 |
$867/sf |
11 |
43 |
| Mar 28 |
14 |
$838/sf |
15 |
48 |
| Apr 4 |
18 |
$762/sf |
25 |
42 |
| Apr 11 |
23 |
$774/sf |
15 |
39 |
| Apr 18 |
22 |
$792/sf |
17 |
41 |
| Apr 25 |
18 |
$810/sf |
20 |
41 |
| May 2 |
27 |
$809/sf |
17 |
37 |
| May 9 |
33 |
$837/sf |
17 |
46 |
| May 16 |
39 |
$793/sf |
19 |
44 |
| May 23 |
43 |
$793/sf |
22 |
44 |
| May 30 |
36 |
$843/sf |
23 |
36 |
| Jun 6 |
43 |
$817/sf |
23 |
41 |
| Jun 13 |
49 |
$845/sf |
24 |
42 |
| Jun 20 |
57 |
$817/sf |
24 |
41 |
The $2,000,000 – $3,000,000 Market:
| Date |
NSDCC Active Listings |
Avg. LP/sf |
Avg. DOM |
# of Pendings |
| Jan 3, 2022 |
18 |
$1,080/sf |
127 |
43 |
| Jan 10 |
23 |
$1,038/sf |
85 |
37 |
| Jan 17 |
26 |
$1,044/sf |
80 |
41 |
| Jan 24 |
28 |
$1,015/sf |
37 |
42 |
| Jan 31 |
22 |
$949/sf |
38 |
47 |
| Feb 7 |
26 |
$919/sf |
29 |
42 |
| Feb 14 |
22 |
$997/sf |
37 |
49 |
| Feb 21 |
21 |
$966/sf |
33 |
54 |
| Feb 28 |
26 |
$905/sf |
32 |
57 |
| Mar 7 |
29 |
$922/sf |
28 |
57 |
| Mar 14 |
20 |
$852/sf |
26 |
58 |
| Mar 21 |
17 |
$928/sf |
26 |
60 |
| Mar 28 |
34 |
$927/sf |
12 |
65 |
| Apr 4 |
32 |
$927/sf |
20 |
69 |
| Apr 11 |
44 |
$910/sf |
17 |
62 |
| Apr 18 |
48 |
$997/sf |
19 |
66 |
| Apr 25 |
42 |
$1,092/sf |
18 |
73 |
| May 2 |
54 |
$995/sf |
19 |
70 |
| May 9 |
61 |
$910/sf |
20 |
73 |
| May 16 |
64 |
$977/sf |
22 |
69 |
| May 23 |
82 |
$953/sf |
25 |
59 |
| May 30 |
78 |
$951/sf |
27 |
56 |
| Jun 6 |
94 |
$963/sf |
27 |
58 |
| Jun 13 |
98 |
$961/sf |
28 |
70 |
| Jun 20 |
91 |
$935/sf |
32 |
59 |
The $3,000,000 – $4,000,000 Market:
| Date |
NSDCC Active Listings |
Avg. LP/sf |
Avg. DOM |
# of Pendings |
| Jan 3, 2022 |
19 |
$1,230/sf |
90 |
26 |
| Jan 10 |
22 |
$1,210/sf |
76 |
25 |
| Jan 17 |
19 |
$1,207/sf |
86 |
23 |
| Jan 24 |
17 |
$1,129/sf |
92 |
24 |
| Jan 31 |
21 |
$1,172/sf |
70 |
22 |
| Feb 7 |
19 |
$1,169/sf |
67 |
25 |
| Feb 14 |
19 |
$1,234/sf |
65 |
28 |
| Feb 21 |
21 |
$1,279/sf |
69 |
28 |
| Feb 28 |
22 |
$1,214/sf |
64 |
25 |
| Mar 7 |
27 |
$1,295/sf |
60 |
24 |
| Mar 14 |
27 |
$1,201/sf |
65 |
27 |
| Mar 21 |
23 |
$1,282/sf |
69 |
31 |
| Mar 28 |
25 |
$1,253/sf |
67 |
30 |
| Apr 4 |
30 |
$1,199/sf |
61 |
27 |
| Apr 11 |
32 |
$1,174/sf |
62 |
31 |
| Apr 18 |
33 |
$1,216/sf |
68 |
31 |
| Apr 25 |
33 |
$1,219/sf |
63 |
33 |
| May 2 |
37 |
$1,164/sf |
50 |
36 |
| May 9 |
33 |
$1,132/sf |
57 |
32 |
| May 16 |
40 |
$1,119/sf |
53 |
32 |
| May 23 |
40 |
$1,135/sf |
57 |
27 |
| May 30 |
40 |
$1,178/sf |
61 |
28 |
| Jun 6 |
43 |
$1,224/sf |
56 |
28 |
| Jun 13 |
48 |
$1,184/sf |
52 |
28 |
| Jun 20 |
52 |
$1,117/sf |
53 |
26 |
The $4,000,000+ Market:
| Date |
NSDCC Active Listings |
Avg. LP/sf |
Avg. DOM |
# of Pendings |
| Jan 3, 2022 |
100 |
$1,884/sf |
128 |
30 |
| Jan 10 |
105 |
$1,864/sf |
113 |
29 |
| Jan 17 |
109 |
$1,763/sf |
110 |
34 |
| Jan 24 |
105 |
$2,130/sf |
114 |
42 |
| Jan 31 |
102 |
$2,114/sf |
118 |
53 |
| Feb 7 |
109 |
$2,000/sf |
108 |
50 |
| Feb 14 |
108 |
$2,005/sf |
109 |
47 |
| Feb 21 |
113 |
$2,008/sf |
103 |
43 |
| Feb 28 |
111 |
$1,991/sf |
101 |
47 |
| Mar 7 |
115 |
$1,904/sf |
91 |
39 |
| Mar 14 |
121 |
$1,893/sf |
95 |
43 |
| Mar 21 |
116 |
$1,905/sf |
97 |
44 |
| Mar 28 |
104 |
$1,966/sf |
97 |
59 |
| Apr 4 |
103 |
$1,929/sf |
97 |
56 |
| Apr 11 |
106 |
$1,906/sf |
97 |
55 |
| Apr 18 |
108 |
$1,874/sf |
100 |
51 |
| Apr 25 |
116 |
$1,829/sf |
97 |
38 |
| May 2 |
117 |
$1,781/sf |
95 |
32 |
| May 9 |
116 |
$1,831/sf |
96 |
36 |
| May 16 |
124 |
$1,854/sf |
91 |
39 |
| May 23 |
125 |
$1,855/sf |
92 |
36 |
| May 30 |
129 |
$1,706/sf |
93 |
39 |
| Jun 6 |
131 |
$1,740/sf |
89 |
33 |
| Jun 13 |
132 |
$1,793/sf |
86 |
38 |
| Jun 20 |
148 |
$1,772/sf |
84 |
35 |
NSDCC Weekly New Listings and New Pendings
| Week |
New Listings |
New Pendings |
Total Actives |
Total Pendings |
| Jan 3, 2022 |
17 |
14 |
152 |
164 |
| Jan 10 |
39 |
18 |
167 |
142 |
| Jan 17 |
34 |
29 |
179 |
145 |
| Jan 24 |
41 |
40 |
173 |
157 |
| Jan 31 |
43 |
40 |
173 |
182 |
| Feb 7 |
43 |
38 |
179 |
179 |
| Feb 14 |
44 |
49 |
168 |
193 |
| Feb 21 |
51 |
38 |
180 |
197 |
| Feb 28 |
39 |
39 |
179 |
205 |
| Mar 7 |
54 |
37 |
191 |
195 |
| Mar 14 |
48 |
51 |
195 |
196 |
| Mar 21 |
39 |
46 |
178 |
207 |
| Mar 28 |
53 |
50 |
185 |
224 |
| Apr 4 |
46 |
40 |
190 |
220 |
| Apr 11 |
61 |
39 |
221 |
213 |
| Apr 18 |
41 |
46 |
224 |
212 |
| Apr 25 |
50 |
43 |
224 |
205 |
| May 2 |
76 |
37 |
256 |
196 |
| May 9 |
59 |
46 |
262 |
207 |
| May 16 |
78 |
48 |
286 |
200 |
| May 23 |
61 |
42 |
312 |
192 |
| May 30 |
54 |
44 |
307 |
183 |
| Jun 6 |
70 |
31 |
338 |
183 |
| Jun 13 |
60 |
41 |
354 |
202 |
| Jun 20 |
71 |
25 |
388 |
177 |


From an industry insider:
We believe that in five plus years, cash offers are going to be the standard in the marketplace, and that’s the direction the entire industry is going.
Cash offers are an advantage in a competitive market. Don’t really need them in a regular market, especially when they cost extra.