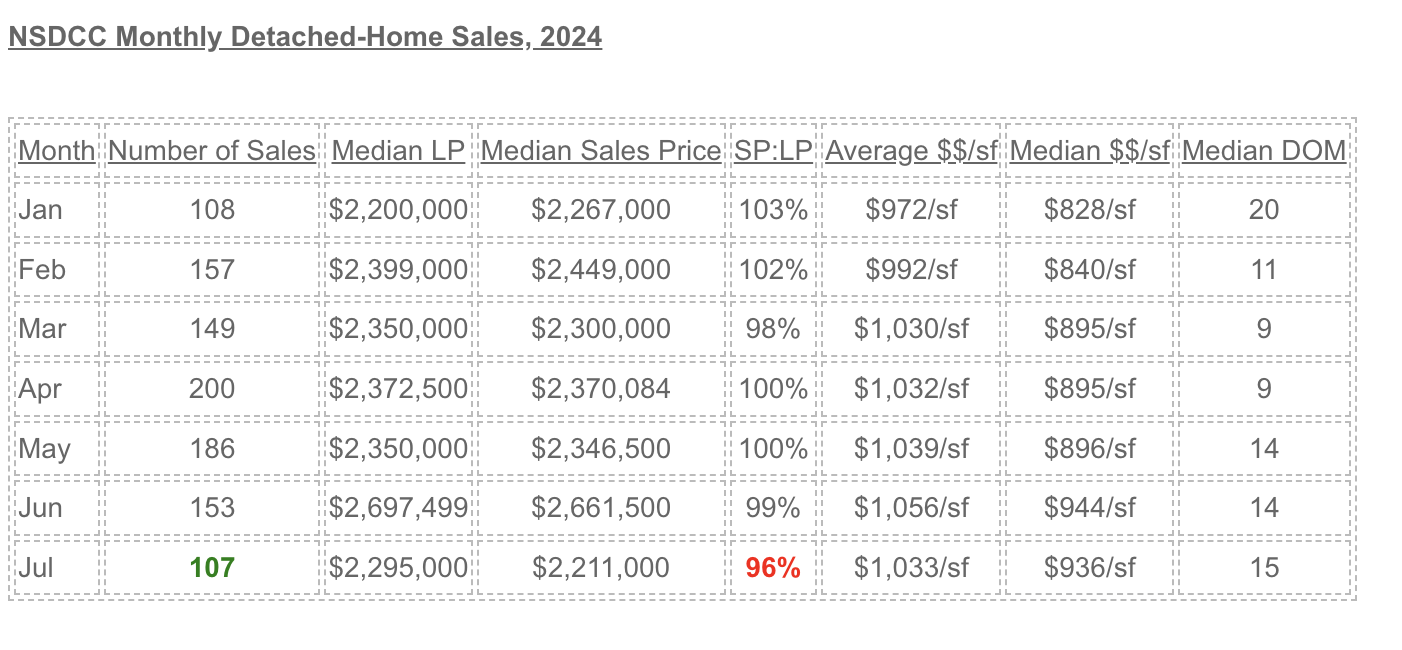
The other day I popped off about how the market was deteriorating and we’d be lucky to see 100+ monthly sales the rest of the way in 2024. What do I know? Here is the sales data for this month so far:
There are two solid weeks left in July – could we get to 200 sales this month?
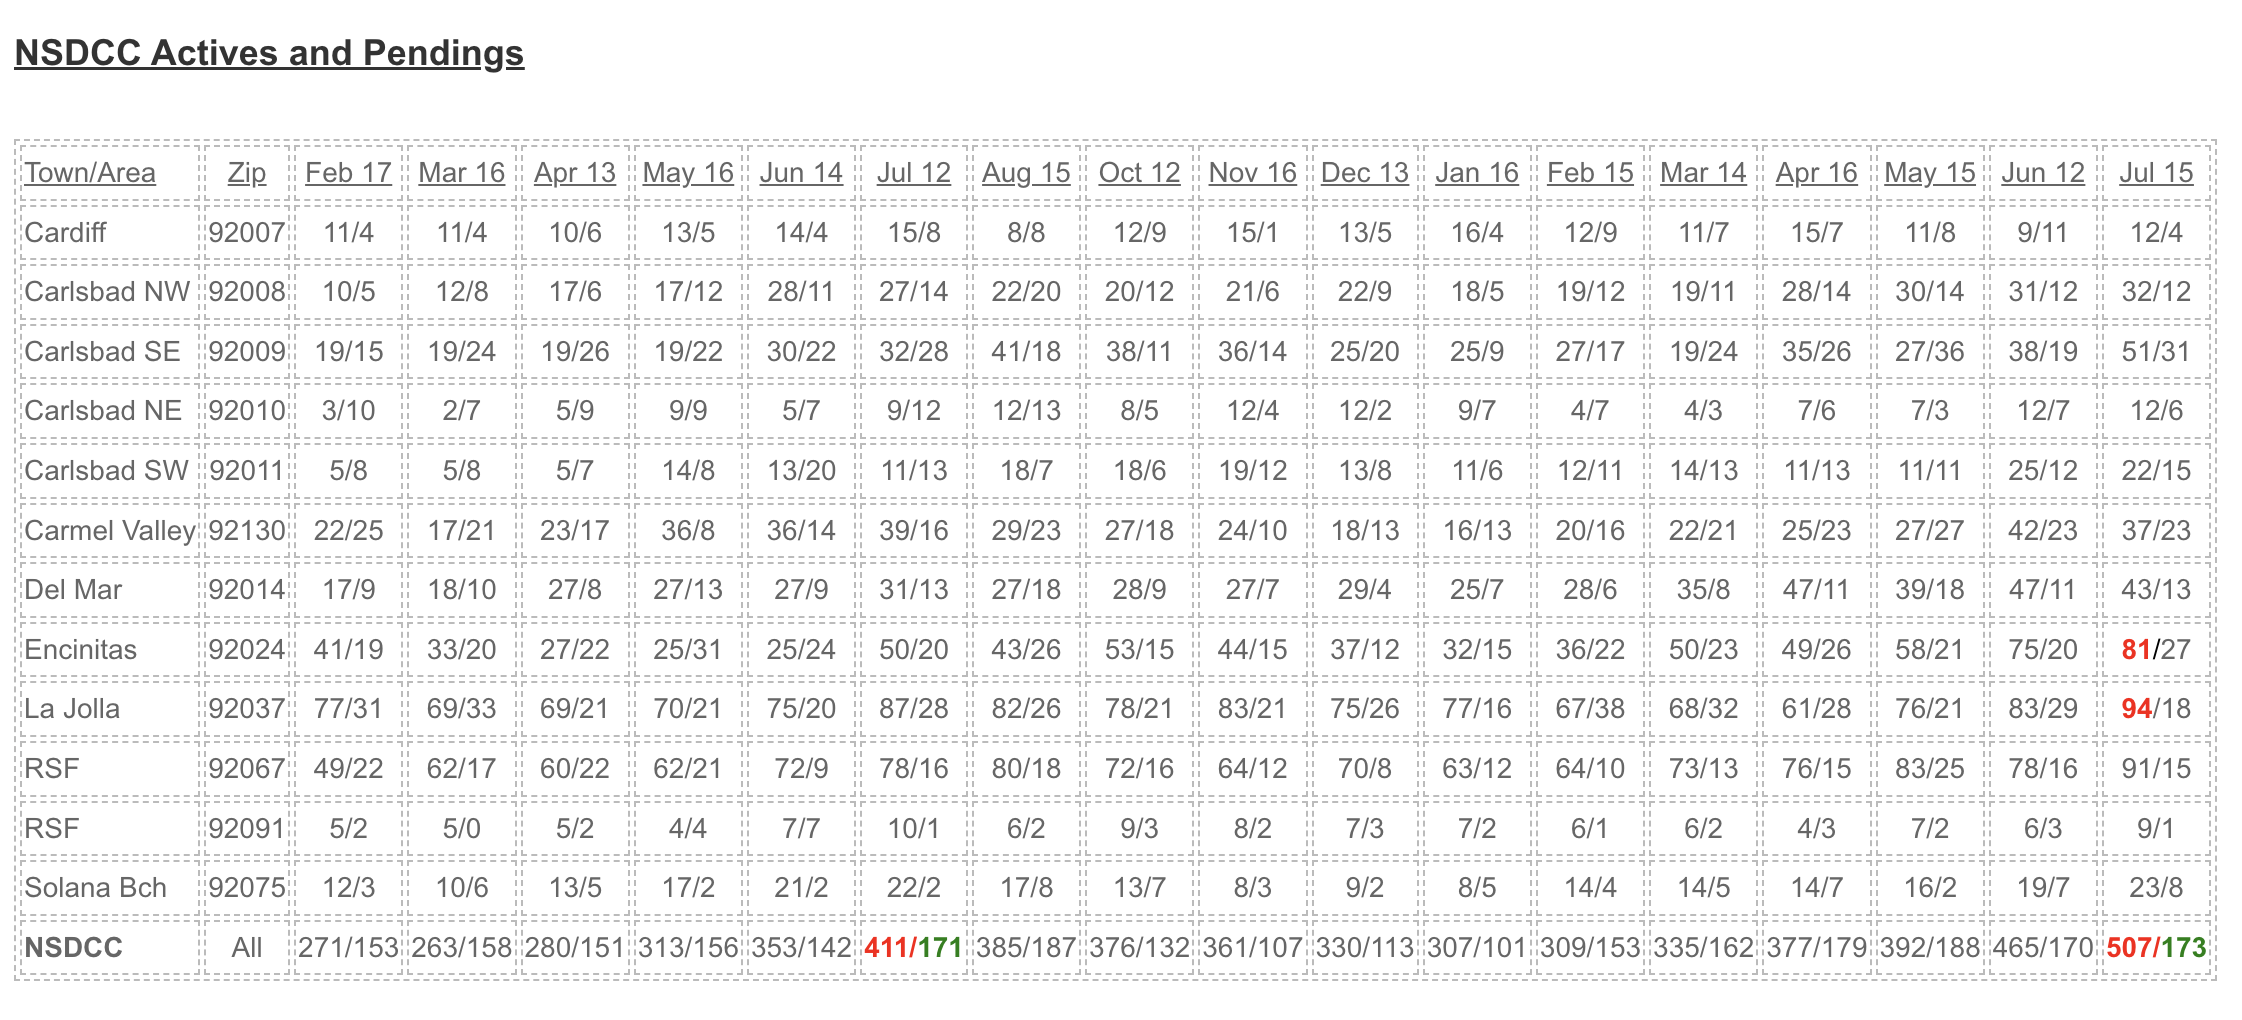
If so, it will leave the pendings drawer a little light – we’re down to 169 homes in escrow today. But there are 505 actives, and when the coming-soons are included, the count is up to 528 detached-homes for buyers to choose from!
The June median list and sales prices were outliers – the rest of the pricing data looks steady, though the buyers are looking for discounts now – and judging by the 96%, the sellers are obliging!
My new listing (below) went over list price though, and I have buyers in a 5-offer bidding war on a different home right now so there is plenty of hot action:
This house for sale is down the street from the one I sold in October, 2022 for $2,250,000 and I said then that I didn’t think another home would sell in this neighborhood for less than $2,000,000. None have closed under $2M since then, and the last two sales were both closed in July at $2,125,000 for a Centex, not Davidson home that backed to the power lines and $2,444,000 across the street from this one.
Florida and San Antonio look cheap and getting cheaper!
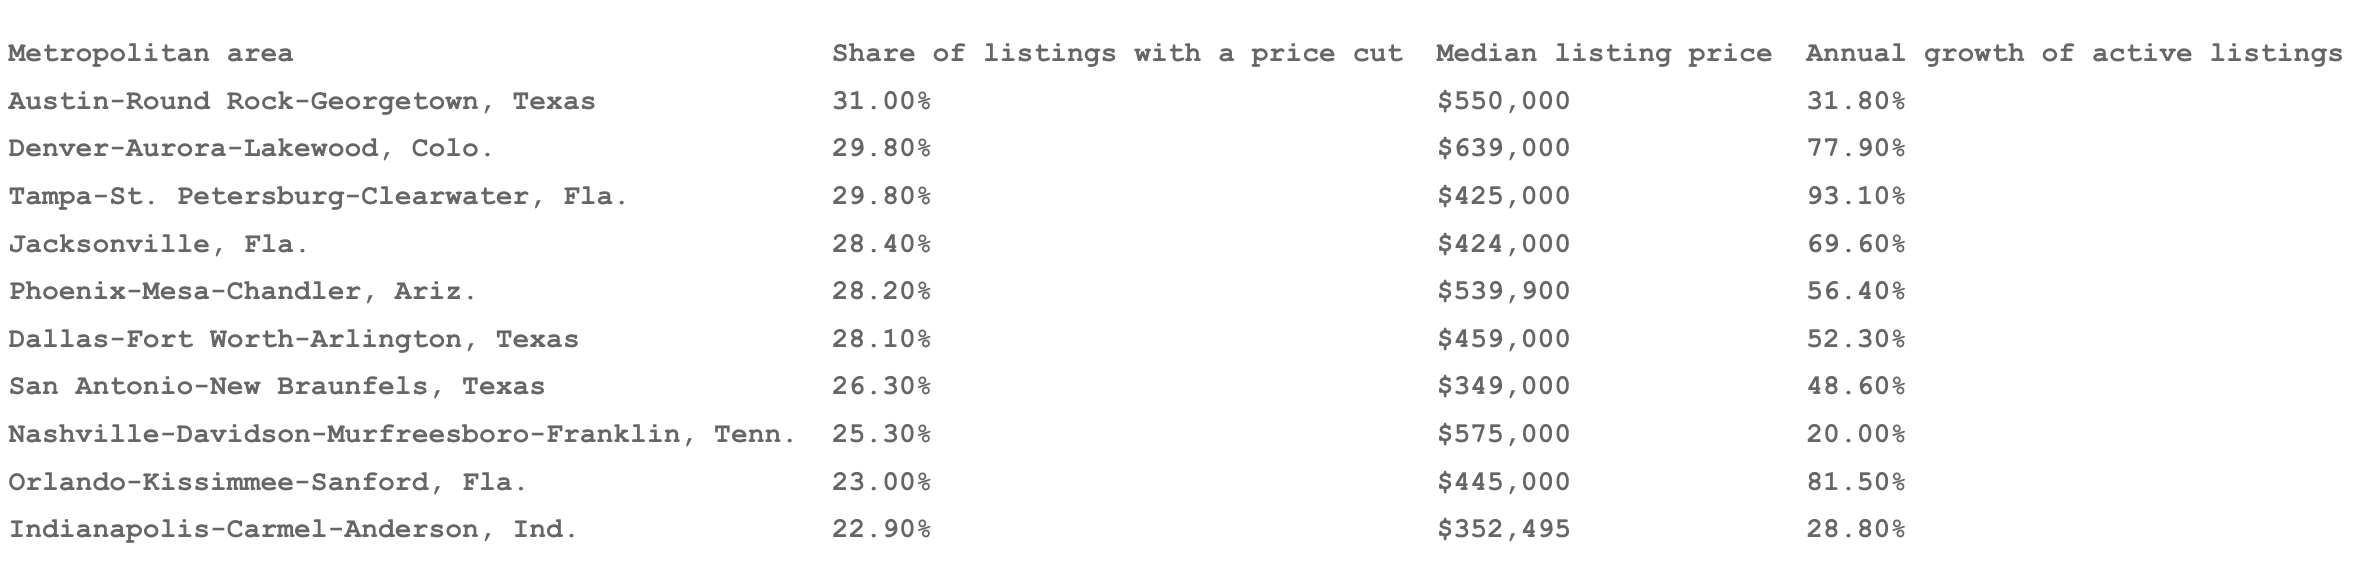
Forty-seven out of 50 metropolitan areas in the U.S. saw an uptick in for-sale listings with price cuts this June as compared with last year, the company said. The biggest annual increases were in Tampa and Jacksonville, Fla., and in Denver, Colo.
The drop in home prices comes during one of the most expensive housing markets in U.S. history. Mortgage rates remain close to 7%, and home prices in May hit an all-time high, with the median price for a home hitting $419,300.
But buyers in the South are seeing a relatively cooler market, due to higher levels of inventory.
Among the largest 50 metropolitan areas in the U.S., those that had the highest share of homes with lowered prices were Austin-Round Rock-Georgetown, Texas; Denver-Aurora-Lakewood, Colo.; and Tampa-St. Petersburg-Clearwater, Fla.
The median listing price in Austin fell by 5.2% from last June. In Denver it fell by 6%, and in Tampa by 4.5%.
Tampa was also the place that saw the highest growth in housing supply from last year. In June, the inventory of homes for sale in Tampa grew by 93% as compared with last year. Tampa was followed by Orlando, where housing inventory grew by 82%. The South as a whole saw listings grow by 49% from a year ago.
Nationally, the share of homes with a price cut was 18.3% in June, Realtor.com said.
I left this story in the comment section in June when Winstanley was pending – it closed yesterday so we can finish the saga. Surfrider had asked when I knew the market had changed, and I filed this response:
It was in mid-May.
Example:
Here the timing was perfect – they hit the market in early March. They listed for $2,985,000, and boom, it gets bid up to $3,100,000. I did a video so you can compare too:
On May 21st, I saw it on broker preview, and the listing agents asked me what I thought. I usually never answer because most agents can’t handle the truth and just get defensive and want to argue instead. But these agents were long-timers so I thought they might appreciate my feedback.
I said that it felt like the market had shifted, and it was going to get harder to sell homes from now on. I told them about Penfield, and how I thought they had gotten lucky. The agents didn’t jump up and agree with me, but I could tell that they had their reservations too. All good agents feel it.
Their listing on Winstanley was priced at $3,199,000, and three weeks after I saw them, they lowered the price to $3,049,000. It went pending four days later.
Even though Winstanley had 500sf more square feet and a better kitchen (Penfield’s kitchen cabinets were painted), it will end up selling for less. If they wouldn’t have lowered their price early, they could still be sitting around unsold too!
Here’s the end of story:
Winstanley closed for $2,900,000, which was $200,000 less than the inferior house on Penfield, and then this smaller house around the corner closed for $2,800,000. So just when the Penfield sale made the neighbors think their homes were worth somewhere into the $3-millions, two sales indicate otherwise only three months later.
Both of those recent sellers bought their house in 2005 and paid in the $1,300,000s.
This could happen in any neighborhood too. Existing homeowners have so much equity that if buyers lowball them by a couple of hundred thousand dollars, they can easily make the deal if they want to. The time of the year is one of the critical components too.
It’s how you can lose 5% or 10% of your imagined equity in a matter of weeks – poof, just like that.
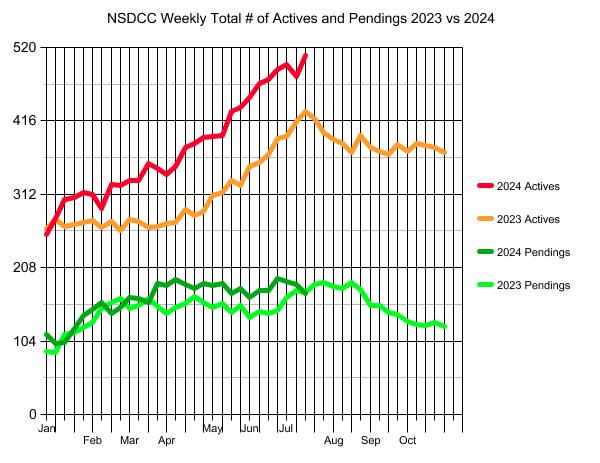
The numbers were fairly steady through the May reading…..but the number of unsold listings have jumped in most areas now (with Encinitas and La Jolla at, or near, all-time highs). The current inventory of 507 actives is 23% higher than last July!
Rancho Santa Fe is on its way back to its old pattern of having 10x the number of actives vs. pendings.
The second half of 2024 is probably going to be relatively unsuccessful for the current sellers who have been on the market for 30+ days – they aren’t priced to move now, and it’s unlikely they will adjust enough to be an attractive buy (which would probably take a discount of -10% or more).
If they all have to come back next year….plus those who decided to wait out the political circus….plus the usual sellers, the 2025 inventory could feel like a real surge. I already have three different sellers who are choosing to wait until 2025 to put their home on the market!
NSDCC Total Number of Listings and Median List Price, First Half of the Year:
2019: 2,722, $1,550,000
2020: 2,324, $1,650,000
2021: 2,266, $1,899,000
2022: 1,812, $2,350,000
2023: 1,468, $2,500,000
2024: 1,663, $2,715,000
If the number of listings explodes next year, these price gains are going to need to mellow out.
The number of NSDCC active listings blew right through the 500 mark, and the count is now up to 509 unsolds. The number of pendings had stayed above last year’s count primarily because there have been more homes for sale.
But it looks like all the quality homes have been taken now, and pendings’ count started decelerating three weeks ago. There will be very few hot buys listed over the next 4-5 months, so buyers will have to earn it by lowballing the existing inventory if they want to move this year.
My prediction that the political circus would be a big distraction to home sales didn’t include an assassination attempt! But if both candidates make good on their promise to lower the vitriol, it would be good for home sales, especially if mortgage rates keep coming down.
But it will take a massive surge in price reductions this week to create a late-summer rally. It’s going to be too easy for buyers to pack it in for 2024, and hope that next year brings lower prices and rates.
When is the best time to buy? When nobody else is!
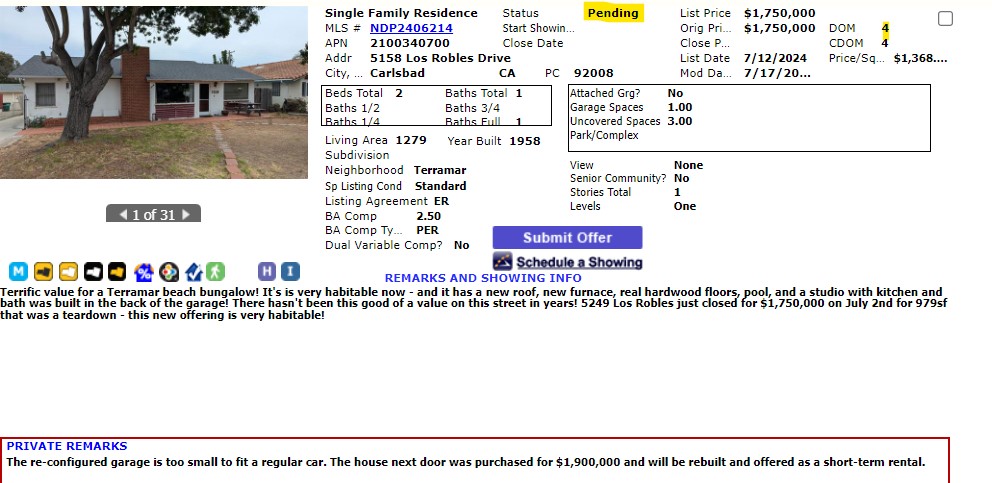
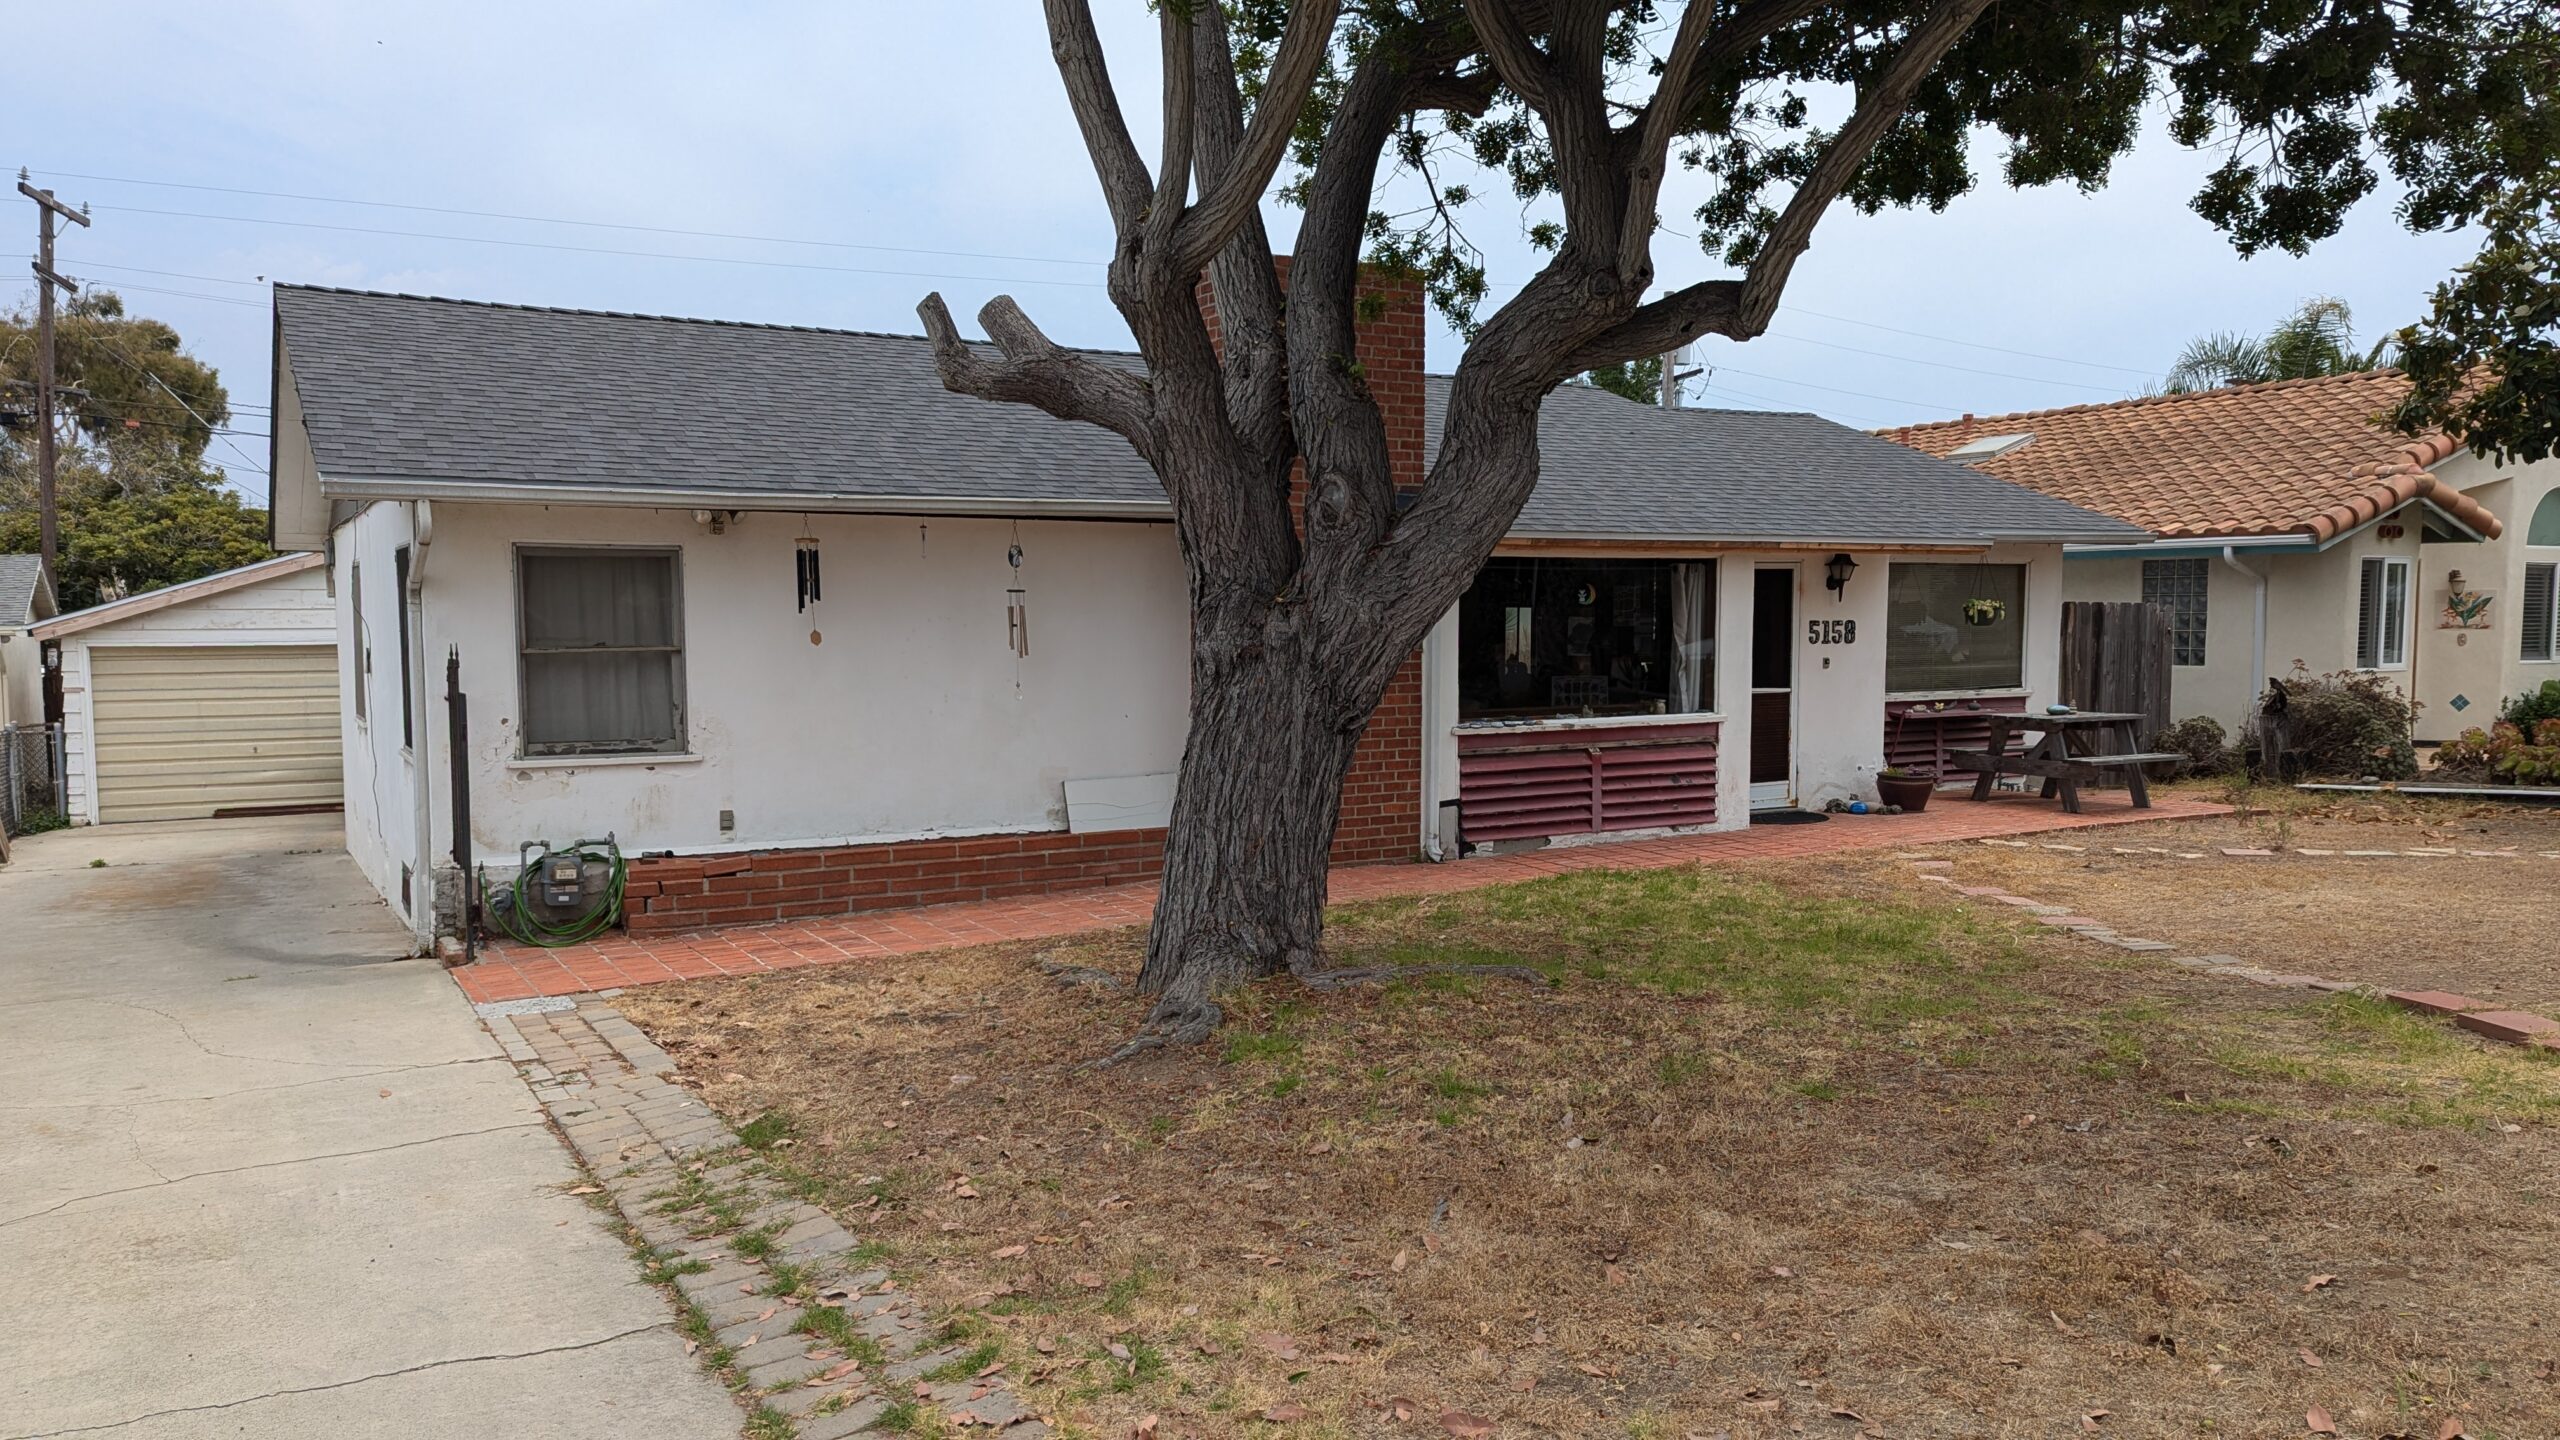
This is a terrific value for a Terramar beach bungalow! The original bungalow is very habitable now – it has a new roof, new furnace, real hardwood floors, and pool plus a studio with kitchen and bath was built in the back of the garage! There hasn’t been this good of a value on this street in years! 5249 Los Robles just closed for $1,750,000 on July 2nd for 979sf that was a teardown – this new offering is very habitable!
Georgetown, Texas, is the fastest-growing city in the U.S. It’s largely thanks to baby boomers.
Thousands of them have settled in an enormous planned community called Sun City Texas: 5,421 acres of single-family homes clustered around pools, fitness centers and pickleball courts, reserved mostly for buyers 55 and older. The hottest party is the yearly Mardi Gras parade and ball. The median age is 73.
“We’re not dead yet,” said Suzanne Herndon, 70, who moved to Sun City in 2021.
Cities are often focused on attracting young families, or hip remote workers. But Sun City residents have turned out to be the best economic stimulus Georgetown could ask for. The city’s operating budget is flush. Its rainy day fund is brimming. Stores, restaurants, hospitals and health clinics add hundreds of jobs every year. Of Georgetown’s 96,000 residents, about 17,000 live in Sun City.
Georgetown Mayor Josh Schroeder couldn’t be more pleased. The seniors moving into Sun City are active and eager to spend. “It’s like they’re at college except they don’t have to go to class and they have $3 million in the bank,” said Schroeder, who at a spry 47 isn’t eligible for Sun City. “It’s almost like a cruise ship on land.”