by Jim the Realtor | Jun 29, 2021 | Same-House Sales |
San Diego has had positive gains straight through the Covid-19 era, and now we have back-to-back months of +3.3% improvements, which has to be about the max the index can go up in a month.
We are right behind Phoenix, whose non-seasonally-adjusted index in April rose 22.3% YoY to our +21.6%.
Let’s go San Diego, we can take them, and be number one in the nation! Maybe next month!
San Diego Non-Seasonally-Adjusted CSI changes
| Observation Month |
SD CSI |
M-o-M chg |
Y-o-Y chg |
| Jan ’20 |
264.04 |
+0.2% |
+5.1% |
| Feb |
265.34 |
+0.5% |
+4.6% |
| Mar |
269.63 |
+1.6% |
+5.2% |
| Apr |
272.48 |
+1.1% |
+5.8% |
| May |
273.51 |
+0.4% |
+5.2% |
| June |
274.91 |
+0.5% |
+5.0% |
| July |
278.00 |
+1.1% |
+5.4% |
| Aug |
283.06 |
+1.8% |
+7.6% |
| Sep |
288.11 |
+1.8% |
+9.4% |
| Oct |
292.85 |
+1.6% |
+11.5% |
| Nov |
295.64 |
+1.0% |
+12.3% |
| Dec |
297.52 |
+0.6% |
+13.0% |
| Jan ’21 |
301.72 |
+1.4% |
+14.3% |
| Feb |
310.62 |
+2.9% |
+17.1% |
| Mar |
320.81 |
+3.3% |
+19.1% |
| Apr |
331.47 |
+3.3% |
+21.6% |
From cnbc:
Home prices in April saw an annual gain of 14.6% in April, up from a 13.3% increase in March, according to the S&P CoreLogic Case-Shiller National Home Price Index.
Among larger cities covered by the index, the 10-city composite was up 14.4% year over year, up from 12.9% the previous month. The 20-city composite was 14.9% higher, up from 13.4% in March.
“April’s performance was truly extraordinary. The 14.6% gain in the National Composite is literally the highest reading in more than 30 years of S&P CoreLogic Case-Shiller data,” said Craig Lazzara, managing director and global head of index investment strategy at S&P DJI.
Not only did home prices rise in all 20 cities, but the price gains accelerated in all as well and were in the top quartile of performance historically.
Five cities – Charlotte, Cleveland, Dallas, Denver and Seattle – saw their largest annual gains ever.
“We have previously suggested that the strength in the U.S. housing market is being driven in part by reaction to the COVID pandemic, as potential buyers move from urban apartments to suburban homes. April’s data continue to be consistent with this hypothesis,” added Lazzara.
Price gains have been expanding for the last eleven months, as buyer demand continues to outstrip supply. The inventory of homes for sale rose slightly in May compared with April, but was still 21% lower than May 2020, according to the National Association of Realtors.
Home sales have been falling for the past few months, due both to low supply, especially at the entry level of the market, and very high prices. Single-family housing starts have also slipped, as homebuilders try to keep up with a heavy backlog of demand amid high prices for land, labor and materials.
There has been growing talk of a price bubble in the housing market, but the fundamentals of today’s market say otherwise.
“Although home price growth is reaching new highs, the risk of price declines has fallen far below pre-pandemic and summer 2006 levels, when homes prices last peaked. This is likely because favorable mortgage rates and income growth continue to keep the ratio of mortgage payments to monthly household income much lower today,” said Selma Hepp, deputy chief economist at CoreLogic.
“Consequently, elevated buyer demand, coupled with lacking for-sale inventories, will continue putting pressure on prices — which are likely to remain at double-digit increases through the third quarter of 2020,” she added.
There is, however, a growing divide between the haves and have-nots in housing.
Sales activity is gaining dramatically on the higher end of the market but falling on the low end as more buyers are priced out. Some blame the Federal Reserve for keeping mortgage rates artificially low, through its bond-buying program. Record low rates last year helped juice the homebuying boom, but those rates, now slightly higher, cannot offset the huge price gains.
“So much for the Fed’s all-inclusive monetary policy where lower income people now can’t afford housing,” wrote Peter Boockvar, chief investment officer at Bleakley Advisory Group.
~~~~~~~~~~~~~~~~~~~~~~~~~~~~~~~~~~~~~~
by Jim the Realtor | Jun 6, 2021 | 2021, Frenzy, Same-House Sales |
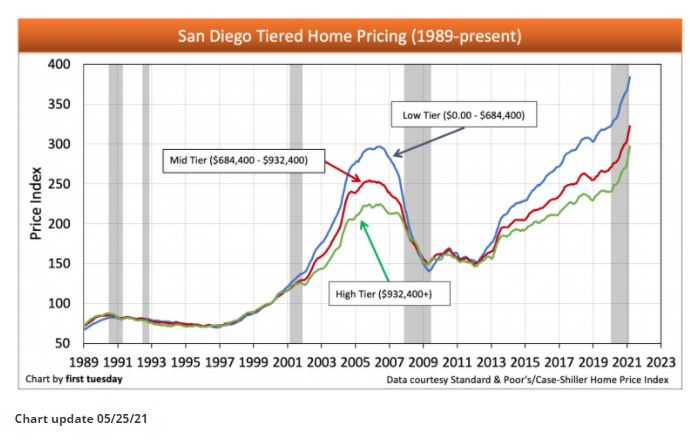
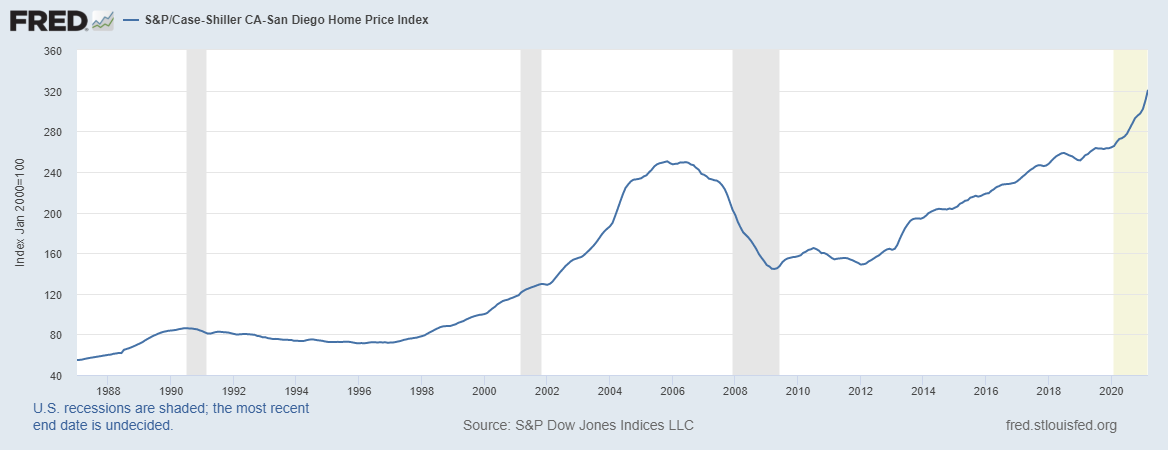
This graph is charting the local Case-Shiller Index. The latest reading is from March, so these trends are reflecting the first quarter of 2021 – which means these lines will be going straight up for at least another 2-3 readings before there is any chance of a change.
The editors expect a collapse in prices next year, though they are coming to the wrong conclusions:
https://journal.firsttuesday.us/california-tiered-home-pricing-2/1592/
Can we learn anything from history?
The 2003-2007 era was goosed by increasingly-easier financing each year, so using those years as a gauge wouldn’t be accurate (financing has never been so tough to get now).
But the 2013 frenzy lasted for about a year – as long as we’ve been on fire now.
Are we due for a cooling off? Today, there are listings on the fringes that aren’t selling as fast, or at all.
But the red-hot newer tract homes with decent yards and pools will continue to attract a crowd, as will the single-story homes – probably straight through the 2022 selling season.
Get Good Help!
by Jim the Realtor | May 26, 2021 | Bubble Talk, Same-House Sales |
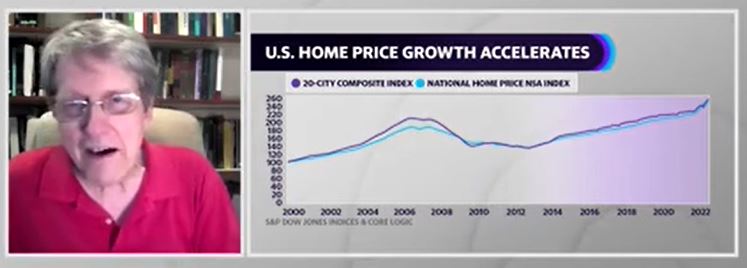
The housing market is hot as home prices continue to rise, but Nobel Prize winning economist Robert Shiller predicts prices will eventually drop. “They’ll come back down, not overnight, but enough to cause some pain,” Shiller told Yahoo Finance Live.
The latest S&P CoreLogic Case-Shiller national home price index posted a 13.2% annual gain in March, the fastest pace prices have risen in more than 15 years. Last week, the National Association of Realtors (NAR) reported the median existing-home price in April was $341,600, up 19.1% from April 2020.
“This is not a market that collapses overnight,” Shiller said. “It’s less short run volatile than the stock market. But you can see that we’re seeing price increases now that haven’t quite been realized since those years just before the financial crisis.”
Shiller said there is no “clean explanation” why the housing market is so hot. He expects it to continue another year or two driven by low interest rates and the COVID-19 pandemic work-from-home revolution.
But Shiller cautions that people are also driven by narratives and market sentiment. It’s a topic he wrote about in his book “Narrative Economics: How Stories Go Viral and Drive Major Economic Events.”
“I think it is some kind of irrational exuberance,” he said. “People are having fun, and they will as long as prices keep going up.” He said today’s housing market looks similar to 2003. “There is excitement and people are talking and some people are bidding way more than the asking price and that becomes a narrative or a story.”
But he tempers his comparison saying the current housing craze is different from the mortgage crisis that caused the last housing bubble to burst.
“So it’s not the same as 2003,” Shiller said. “It could be stronger. I think we have better protections, we have better supervision of lenders. So I don’t know if we should be worried about 2007, 2008, 2009 happening again.”
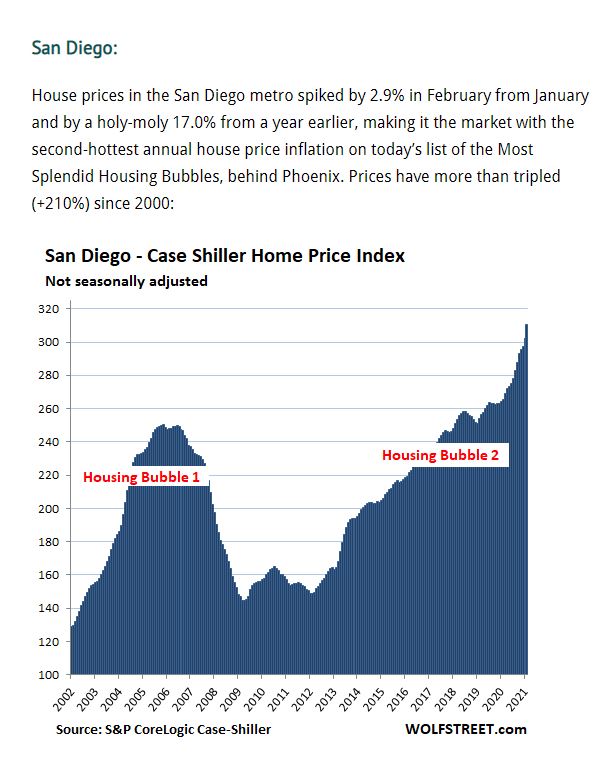
The current run up in prices, according to Shiller, “is disquieting” and he cites Phoenix as an example. “The biggest increase over the last year was Phoenix and home prices have gone up 20% in one year,” he said.
Shiller points out that demand in the housing market gets all the headlines while supply tries to catch up. Record prices for lumber, he says, are driving up prices for newly built homes. “The builders might be building to profit from these high prices now. But, it hasn’t happened yet,” said Shiller and that has him worried.
Shiller helped create the CME S&P Case Shiller home price index futures 15 years ago so people could hedge their risk during housing markets like this one. “So our futures market is now predicting big increases over the next year or more but it’s not certain,” he said.
“It kind of reminds me of the spirit that ended after World War II,” Shiller said. “There was a spending spree by people. They were jubilant the war was over,” he said comparing the mood of the country then to the mood now as the United States emerges from coronavirus pandemic.
https://finance.yahoo.com/news/robert-shiller-home-prices-to-fall-and-cause-some-pain-103750858.html
by Jim the Realtor | May 25, 2021 | Jim's Take on the Market, Same-House Sales
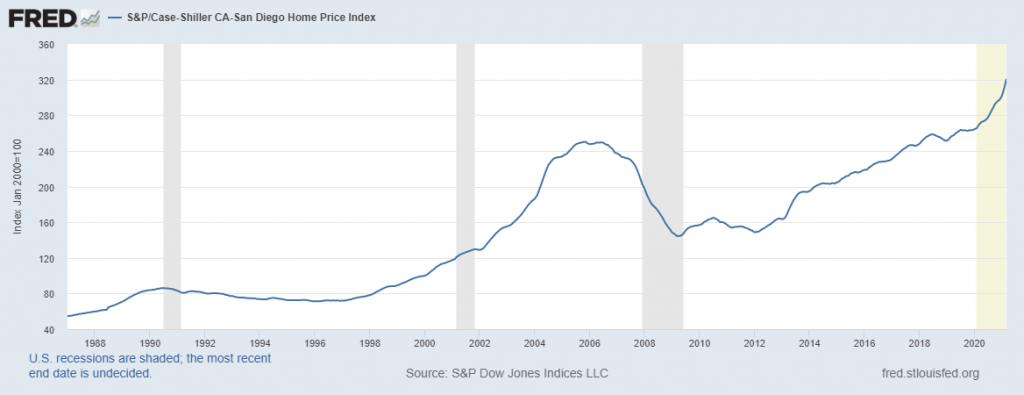
San Diego has had positive gains straight through the Covid-19 era, and we are really ramping up in 2021 with a 3.3% monthly gain in March! We kept our #2 spot in the nation, and are right behind Phoenix:
San Diego Non-Seasonally-Adjusted CSI changes
| Observation Month |
SD CSI |
M-o-M chg |
Y-o-Y chg |
| Jan ’20 |
264.04 |
+0.2% |
+5.1% |
| Feb |
265.34 |
+0.5% |
+4.6% |
| Mar |
269.63 |
+1.6% |
+5.2% |
| Apr |
272.48 |
+1.1% |
+5.8% |
| May |
273.51 |
+0.4% |
+5.2% |
| June |
274.91 |
+0.5% |
+5.0% |
| July |
278.00 |
+1.1% |
+5.4% |
| Aug |
283.06 |
+1.8% |
+7.6% |
| Sep |
288.11 |
+1.8% |
+9.4% |
| Oct |
292.85 |
+1.6% |
+11.5% |
| Nov |
295.64 |
+1.0% |
+12.3% |
| Dec |
297.52 |
+0.6% |
+13.0% |
| Jan ’21 |
301.72 |
+1.4% |
+14.3% |
| Feb |
310.62 |
+2.9% |
+17.1% |
| Mar |
320.81 |
+3.3% |
+19.1% |
From cnbc:
Home prices in March were 13.2% higher in March, compared with March 2020, according to the S&P CoreLogic Case-Shiller National Home Price Index. That’s up from the 12% annual gain in February, and it marks the 10th straight month of accelerating home prices.
The March gain is the largest since December 2005 and is one of the largest in the index’s 30-year history. Prices are being pushed higher by incredibly strong competition in the market. High demand is butting up against near record-low supply, resulting in bidding wars for the vast majority of listings.
The 10-city composite rose 12.8% year over year, up from 11.7% in the previous month. The 20-city composite increased 13.3%, up from 12% in February.
Cities with the strongest price gains continue to be Phoenix, San Diego and Seattle. Phoenix sits at the top with 20% year-over-year price increase, followed by San Diego with a 19.1% increase and Seattle prices rising 18.3%. All 20 cities reported higher price increases in the year ending March 2021 versus the year ending February 2021.
“These data are consistent with the hypothesis that Covid has encouraged potential buyers to move from urban apartments to suburban homes,” said Craig Lazzara, managing director and global head of index investment strategy at S&P DJI.
“This demand may represent buyers who accelerated purchases that would have happened anyway over the next several years. Alternatively, there may have been a secular change in preferences, leading to a permanent shift in the demand curve for housing,” he added.
Mortgage rates began rising during this period, with the average rate on the 30-year fixed just below 3% in February and then ending March at around 3.4%, according to Mortgage News Daily. Higher mortgage rates cut into purchasing power and usually put a chill on home prices, but clearly unusual competition in the market is overwhelming the usual mechanics of the market.
Only 1.16 million homes were on the market in April, a 20% drop year over year, according to the National Association of Realtors. The continued shortage of homes, especially at the lower end of the market, forecasts that home prices will not cool off any time soon.
Sales are beginning to weaken, and prices usually follow, but again, the usual trends are not dependable in this very unusual housing market.
by Jim the Realtor | May 24, 2021 | Bubble Talk, Market Buzz, Same-House Sales |
Shiller has been too conservative on his predictions because he’s an ivory-tower guy. If he were to talk to potential home sellers, he’d find that there aren’t many – if any – who have to move so badly that they would sell for “substantially lower” prices. The next phase after the frenzy will be the stagnant/plateau stage where the demand thins out and sellers wait for that perfect nuclear family with 2.2 kids to come along some day.
Nobel prize-winning economist Robert Shiller is worried a bubble is forming in some of the market’s hottest trades. He’s notably concerned about housing, stocks and cryptocurrencies, where he sees a “Wild West” mentality among investors.
“We have a lot of upward momentum now. So, waiting a year probably won’t bring house prices down,” Shiller said.
According to Shiller, current home price action is also reminiscent of 2003, two years before the slide began. He notes the dip happened gradually and ultimately crashed around the 2008 financial crisis.
“If you go out three or five years, I could imagine they’d [prices] be substantially lower than they are now, and maybe that’s a good thing,” he added. “Not from the standpoint of a homeowner, but it’s from the standpoint of a prospective homeowner. It’s a good thing. If we have more houses, we’re better off.”
by Jim the Realtor | Apr 28, 2021 | Sales and Price Check, Same-House Sales
Our seasonally-adjusted Case-Shiller Index rose more in one month than any other U.S. metro area!
The increase in the three-month annual percentage was nearly 22%, and it doesn’t include March and April which have been hotter.
The San Diego index was still positive during the initial Covid months (but muted), so it’s safe to say that the year-over-year percentage increase for the next few readings will be substantially higher than February’s.
Could San Diego end up with 30% appreciation in 2021?
It looks feasible today!
by Jim the Realtor | Apr 27, 2021 | 2021, Same-House Sales |
San Diego had positive gains straight through the Covid-19 era:
San Diego Non-Seasonally-Adjusted CSI changes
| Observation Month |
SD CSI |
M-o-M chg |
Y-o-Y chg |
| January ’19 |
251.30 |
-0.2% |
+1.3% |
| Feb |
253.69 |
+0.9% |
+1.1% |
| Mar |
256.40 |
+1.1% |
+1.2% |
| Apr |
257.63 |
+0.5% |
+0.8% |
| May |
260.08 |
+1.0% |
+1.1% |
| June |
261.90 |
+0.7% |
+1.3% |
| July |
263.66 |
+0.7% |
+2.0% |
| Aug |
263.23 |
-0.2% |
+2.3% |
| Sep |
263.26 |
0% |
+2.8% |
| Oct |
262.56 |
-0.2% |
+2.7% |
| Nov |
263.18 |
+0.2% |
+3.9% |
| Dec |
263.51 |
+0.1% |
+4.7% |
| Jan ’20 |
264.04 |
+0.2% |
+5.1% |
| Feb |
265.34 |
+0.5% |
+4.6% |
| Mar |
269.63 |
+1.6% |
+5.2% |
| Apr |
272.48 |
+1.1% |
+5.8% |
| May |
273.51 |
+0.4% |
+5.2% |
| June |
274.91 |
+0.5% |
+5.0% |
| July |
278.00 |
+1.1% |
+5.4% |
| Aug |
283.06 |
+1.8% |
+7.6% |
| Sep |
288.11 |
+1.8% |
+9.4% |
| Oct |
292.85 |
+1.6% |
+11.5% |
| Nov |
295.64 |
+1.0% |
+12.3% |
| Dec |
297.52 |
+0.6% |
+13.0% |
| Jan ’21 |
301.72 |
+1.4% |
+14.3% |
| Feb |
310.62 |
+2.9% |
+17.1% |
The index should continue to rise more than 2% month-over-month over the next few readings.
Wifey did this for me because I left this morning before the new number was released. We’re heading for more than 20% appreciation this year! San Diego jumped into the #2 slot for the whole country too! From cnbc:
The cities with the largest gains continue to be Phoenix, San Diego and Seattle. Prices in Phoenix gained 17.4% year over year, followed by San Diego with a 17% increase and Seattle with a 15.4% increase. Nineteen of the 20 cities reported stronger price gains in the year ended February 2021 versus the year ended January.
Even as vaccines are distributed more widely and Americans start to emerge back into the economy, the desire for larger living spaces with more outdoor amenities appears not to be waning.
“This demand may represent buyers who accelerated purchases that would have happened anyway over the next several years,” said Lazzara. “Alternatively, there may have been a secular change in preferences, leading to a permanent shift in the demand curve for housing. Future data will be required to analyze this question.”
by Jim the Realtor | Mar 30, 2021 | 2021, Frenzy, Same-House Sales |
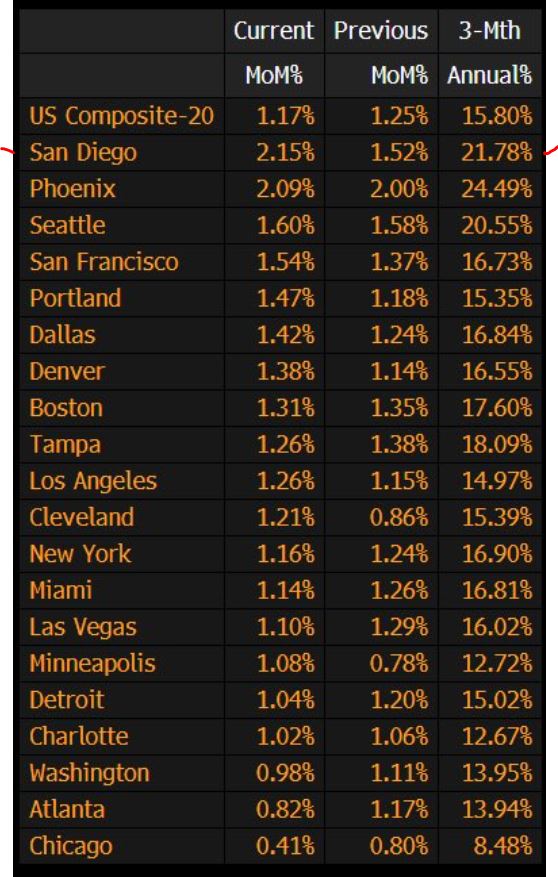
It’s more than just the trendy areas – it’s red-hot everywhere.
Every metro area on the list is having substantial gains in their index, which means there has been a psychological shift happening coast-to-coast on how human beings feel about their homes. With the real-estate-selling business being one of the last totally-free markets left, it’s going to run wild for a while.
The #1 market, Phoenix, hit +1.9% month-over-month, which is incredible for a January reading.
It should put them on track for a +20% to +25% annual gain in 2021, and we won’t be far behind.
I think we might catch them!
San Diego had positive gains straight through the Covid-19 era last year, and now we have 2% monthly gains in our sights for the next few months. Look how that compares to the 2019 readings:
San Diego Non-Seasonally-Adjusted CSI changes
| Observation Month |
SD CSI |
M-o-M chg |
Y-o-Y chg |
| January ’19 |
251.30 |
-0.2% |
+1.3% |
| Feb |
253.69 |
+0.9% |
+1.1% |
| Mar |
256.40 |
+1.1% |
+1.2% |
| Apr |
257.63 |
+0.5% |
+0.8% |
| May |
260.08 |
+1.0% |
+1.1% |
| June |
261.90 |
+0.7% |
+1.3% |
| July |
263.66 |
+0.7% |
+2.0% |
| Aug |
263.23 |
-0.2% |
+2.3% |
| Sep |
263.26 |
0% |
+2.8% |
| Oct |
262.56 |
-0.2% |
+2.7% |
| Nov |
263.18 |
+0.2% |
+3.9% |
| Dec |
263.51 |
+0.1% |
+4.7% |
| Jan ’20 |
264.04 |
+0.2% |
+5.1% |
| Feb |
265.34 |
+0.5% |
+4.6% |
| Mar |
269.63 |
+1.6% |
+5.2% |
| Apr |
272.48 |
+1.1% |
+5.8% |
| May |
273.51 |
+0.4% |
+5.2% |
| June |
274.91 |
+0.5% |
+5.0% |
| July |
278.00 |
+1.1% |
+5.4% |
| Aug |
283.06 |
+1.8% |
+7.6% |
| Sep |
288.11 |
+1.8% |
+9.4% |
| Oct |
292.85 |
+1.6% |
+11.5% |
| Nov |
295.64 |
+1.0% |
+12.3% |
| Dec |
297.52 |
+0.6% |
+13.0% |
| Jan ’21 |
301.72 |
+1.4% |
+14.3% |
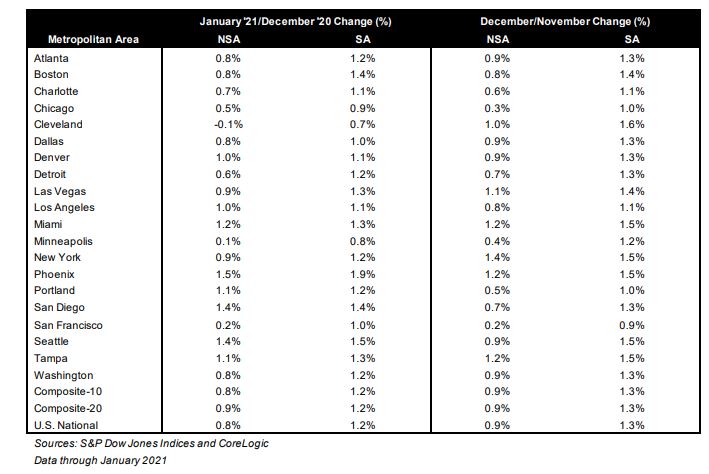
From S&P
“The strong price gains that we observed in the last half of 2020 continued into the f irst month of the new year. In January 2021, the National Composite Index rose by 11.2% compared to its year-ago levels,” says Craig J. Lazzara,Managing Director and Global Head of Index Investment Strategy at S&P DJI. “The trend of accelerating prices that began in June 2020 has now reached its eighth month and is also reflected in the 10- and 20-City Composites (up 10.9% and 11.1%, respectively). The market’s strength is broadly-based: all 20 cities rose, and all 20 cities gained more in the 12 months ended in January 2021 than they had gained in the 12 months ended in December 2020.
“January’s performance is particularly impressive in historical context. The National Composite’s 11.2% gain is the highest recorded since February 2006, just one month shy of 15 years ago. In more than 30 years of S&P CoreLogic Case-Shiller data, January’s year-over-year change is comfortably in the top decile. That strength is reflected across all 20 cities. January’s price gains in every city are above that city’s median level, and rank in the top quartile of all reports in 18 cities.
“January’s data remain consistent with the view that COVID has encouraged potential buyers to move from urban apartments to suburban homes. This demand may represent buyers who accelerated purchases that would have happened anyway over the next several years. Alternatively, there may have been a secular change in preferences, leading to a shift in the demand curve for housing. Future data will be required to analyze this question
“Phoenix’s 15.8% increase led all cities for the 20th consecutive month, with Seattle (+14.3%) and San Diego (+14.2%) close behind. Although prices were strongest in the West (+11.7%), gains were impressive in every region.”
~~~~~~~~~~~~~~~~~~~~~~~~~~~~~~~~~~~~~~~~~
by Jim the Realtor | Feb 23, 2021 | Jim's Take on the Market, Same-House Sales
I guessed that we might have +10% in both sales and pricing this year, but so far that is way too conservative. It’s not just the pricing that’s on the run – the sales are cooking too:
NSDCC Closed Sales Jan 1 – Feb 15
| Year |
# of Sales |
Median Sales Price |
| 2020 |
254 |
$1,394,775 |
| 2021 |
296 |
$1,692,500 |
| % Change, YoY |
+17% |
+22% |
The Case-Shiller Index should really take off in the coming months – maybe San Diego will get to #1 in USA!
San Diego Non-Seasonally-Adjusted CSI changes:
| Observation Month |
SD CSI |
M-o-M chg |
Y-o-Y chg |
| January ’19 |
251.30 |
-0.2% |
+1.3% |
| Feb |
253.69 |
+0.9% |
+1.1% |
| Mar |
256.40 |
+1.1% |
+1.2% |
| Apr |
257.63 |
+0.5% |
+0.8% |
| May |
260.08 |
+1.0% |
+1.1% |
| June |
261.90 |
+0.7% |
+1.3% |
| July |
263.66 |
+0.7% |
+2.0% |
| Aug |
263.23 |
-0.2% |
+2.3% |
| Sep |
263.26 |
0% |
+2.8% |
| Oct |
262.56 |
-0.2% |
+2.7% |
| Nov |
263.18 |
+0.2% |
+3.9% |
| Dec |
263.51 |
+0.1% |
+4.7% |
| Jan ’20 |
264.04 |
+0.2% |
+5.1% |
| Feb |
265.34 |
+0.5% |
+4.6% |
| Mar |
269.63 |
+1.6% |
+5.2% |
| Apr |
272.48 |
+1.1% |
+5.8% |
| May |
273.51 |
+0.4% |
+5.2% |
| June |
274.91 |
+0.5% |
+5.0% |
| July |
278.00 |
+1.1% |
+5.4% |
| Aug |
283.06 |
+1.8% |
+7.6% |
| Sep |
288.11 |
+1.8% |
+9.4% |
| Oct |
292.85 |
+1.6% |
+11.5% |
| Nov |
295.64 |
+1.0% |
+12.3% |
| Dec |
297.52 |
+0.6% |
+13.0% |
From cnbc:
December is usually the slowest month for the housing market, but price gains didn’t slow down one bit in 2020. In fact, they rose at the fastest pace in seven years.
Home prices nationally increased 10.4% compared with December 2019, according to the S&P CoreLogic Case-Shiller Home Price Indices. That is the strongest annual growth rate in over six years, and a significantly stronger gain than in November, when prices were up 9.5%. It also ranks as one of the largest annual gains in the more than 30-year history of the index.
The 10-city composite annual increase was 9.8%, up from 8.9% in November. The 20-city composite posted a 10.1% gain, up from 9.2% in the previous month. Detroit was excluded, due to Covid-related data collection issues.
“2020?s 10.4% gain marks the best performance of housing prices in a calendar year since 2013,” said Craig Lazzara, managing director and global head of index investment strategy at S&P Dow Jones Indices. “From the perspective of more than 30 years of S&P CoreLogic Case-Shiller data, December’s year-over-year change ranks within the top decile of all reports.”
Phoenix, Seattle, and San Diego continued to show the strongest price gains among the 19 cities surveyed. Prices in Phoenix rose 14.4% year-over-year price. In Seattle, they rose 13.6% and San Diego saw a 13.0% increase. Eighteen of the 19 cities reported higher price increases in the 12 months ending December 2020 versus the 12 months ending November 2020.
“These data are consistent with the view that Covid has encouraged potential buyers to move from urban apartments to suburban homes. This may indicate a secular shift in housing demand, or may simply represent an acceleration of moves that would have taken place over the next several years anyway,” added Lazzara.
Home prices began to see big gains last summer, as Covid-driven demand from the stay-at-home culture descended on the housing market. Record low supply combined with record low mortgage rates caused bidding wars on homes across the nation.
Mortgage rates turned sharply higher last week, which will cut into affordability going forward into the 2021 spring market. Prices generally lag sales, so if sales do suffer, it is unlikely the market will see significant cooling of prices for several months.
~~~~~~~~~~~~~~~~~~~~~~~~~~~~~~~~~~~~~~~~~
by Jim the Realtor | Jan 26, 2021 | Frenzy, Sales and Price Check, Same-House Sales |
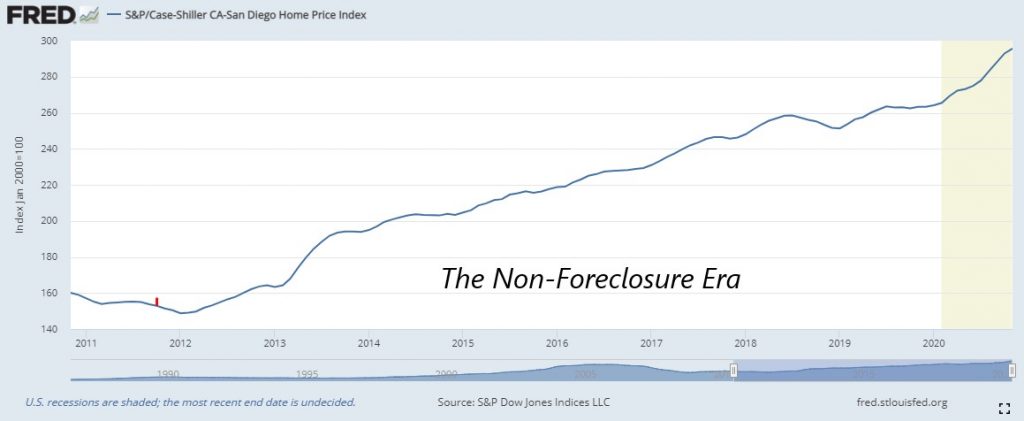
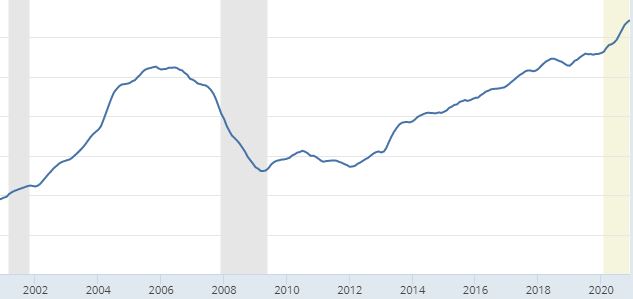
It was in June, 2011 that Ben Bernanke said at a live press conference: We have told the banks to handle their REOs…..long pause………..in an economy-supportive way. Oops. What he was GOING to say was “we have told the banks not to flood the market with REOs.”
Since then, foreclosures dried up, mortgage rates came down, and the local home prices have gone up steadily. Today’s pricing curve looks similar to 2013 – if it repeats, then prices should flatten out this summer. But who knows – there is heavy demand, and few sellers have been lured by these prices!
San Diego Non-Seasonally-Adjusted CSI changes:
| Observation Month |
SD CSI |
M-o-M chg |
Y-o-Y chg |
| January ’19 |
251.30 |
-0.2% |
+1.3% |
| Feb |
253.69 |
+0.9% |
+1.1% |
| Mar |
256.40 |
+1.1% |
+1.2% |
| Apr |
257.63 |
+0.5% |
+0.8% |
| May |
260.08 |
+1.0% |
+1.1% |
| June |
261.90 |
+0.7% |
+1.3% |
| July |
263.66 |
+0.7% |
+2.0% |
| Aug |
263.23 |
-0.2% |
+2.3% |
| Sep |
263.26 |
0% |
+2.8% |
| Oct |
262.56 |
-0.2% |
+2.7% |
| Nov |
263.18 |
+0.2% |
+3.9% |
| Dec |
263.51 |
+0.1% |
+4.7% |
| Jan ’20 |
264.04 |
+0.2% |
+5.1% |
| Feb |
265.34 |
+0.5% |
+4.6% |
| Mar |
269.63 |
+1.6% |
+5.2% |
| Apr |
272.48 |
+1.1% |
+5.8% |
| May |
273.51 |
+0.4% |
+5.2% |
| June |
274.91 |
+0.5% |
+5.0% |
| July |
278.00 |
+1.1% |
+5.4% |
| Aug |
283.06 |
+1.8% |
+7.6% |
| Sep |
288.11 |
+1.8% |
+9.4% |
| Oct |
292.85 |
+1.6% |
+11.5% |
| Nov |
295.64 |
+1.0% |
+12.3% |
From cnbc:
Phoenix, Seattle and San Diego continued to show the strongest price appreciation of all the major markets in November. Phoenix led the way with a 13.8% year-over-year price increase, followed by Seattle with a 12.7% increase and San Diego with a 12.3% increase. All 19 cities reported higher price increases in the year ending November versus the end of October.
“Our 2021 outlook expects an eventual moderation to price gains as home construction ramps up and the widespread availability of COVID vaccines bring more flexible sellers back to the housing market, but it will be some time before these changes bring relief,” said Danielle Hale, chief economist with realtor.com.
https://www.cnbc.com/2021/01/26/november-home-prices-rose-9point5percent-one-of-the-highest-gains-on-record-case-shiller-says.html
~~~~~~~~~~~~~~~~~~~~~~~~~~~~~~~~~~