by Jim the Realtor | Feb 16, 2022 | Forecasts, Sales and Price Check, Same-House Sales |
This guy has been drunk on the doom juice for so long that he must never get out of his bunker!
If he did, he would see the overwhelming demand for every new listing, even though underwriting standards are strict and rates are going up. Of the 140 NSDCC sales last month, 36% were all-cash.
https://journal.firsttuesday.us/san-diego-housing-indicators-2/29246/
Here’s what he said in July when the YoY changes were lower:
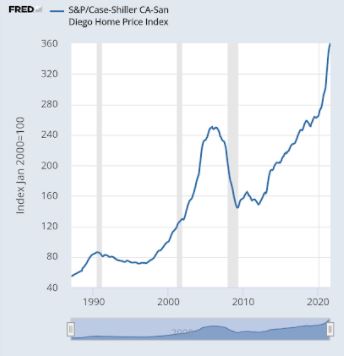
https://www.bubbleinfo.com/2021/07/08/san-diego-home-pricing-by-tier/
by Jim the Realtor | Jan 25, 2022 | Same-House Sales
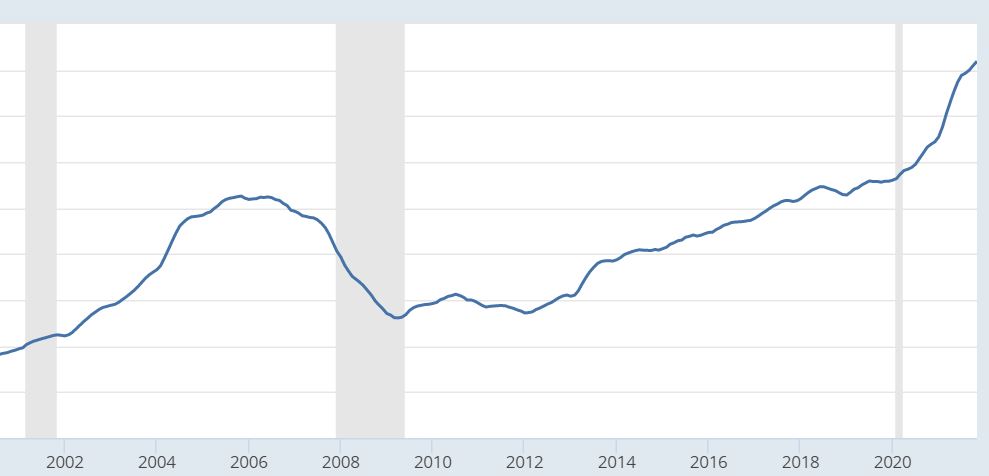
We can see how MoM pricing started to slow at end of summer, only to have it pick up again in 4Q21:
San Diego Non-Seasonally-Adjusted CSI changes
| Observation Month |
SD CSI |
M-o-M chg |
Y-o-Y chg |
| Jan ’20 |
264.04 |
+0.2% |
+5.1% |
| Feb |
265.34 |
+0.5% |
+4.6% |
| Mar |
269.63 |
+1.6% |
+5.2% |
| Apr |
272.48 |
+1.1% |
+5.8% |
| May |
273.51 |
+0.4% |
+5.2% |
| Jun |
274.91 |
+0.5% |
+5.0% |
| Jul |
278.00 |
+1.1% |
+5.4% |
| Aug |
283.06 |
+1.8% |
+7.6% |
| Sep |
288.11 |
+1.8% |
+9.4% |
| Oct |
292.85 |
+1.6% |
+11.5% |
| Nov |
295.64 |
+1.0% |
+12.3% |
| Dec |
297.52 |
+0.6% |
+13.0% |
| Jan ’21 |
301.72 |
+1.4% |
+14.3% |
| Feb |
310.62 |
+2.9% |
+17.1% |
| Mar |
320.81 |
+3.3% |
+19.1% |
| Apr |
331.47 |
+3.3% |
+21.6% |
| May |
341.05 |
+2.9% |
+24.7% |
| Jun |
349.78 |
+2.6% |
+27.2% |
| Jul |
355.33 |
+1.6% |
+27.8% |
| Aug |
357.11 |
+0.5% |
+26.2% |
| Sep |
359.88 |
+0.8% |
+24.9% |
| Oct |
363.80 |
+1.1% |
+24.2% |
| Nov |
367.62 |
+1.1% |
+24.3% |
Mortgage rates didn’t move much in October and November, holding between 3% and 3.25% for the average on the popular 30-year fixed. While that was slightly higher than the early summer levels, it was still historically low and considerably lower than where rates are now. Rates are now about 75 basis points above year-ago levels. Low rates over the last two years have given buyers more purchasing power and consequently fueled today’s sky-high prices.
“We should soon begin to see the impact of increasing mortgage rates on home prices,” added Lazzara.
A recent report from Realtor.com found that 14 out of the top 50 largest U.S. cities experienced listing price declines over the prior year in December.
by Jim the Realtor | Jan 3, 2022 | Same-House Sales |
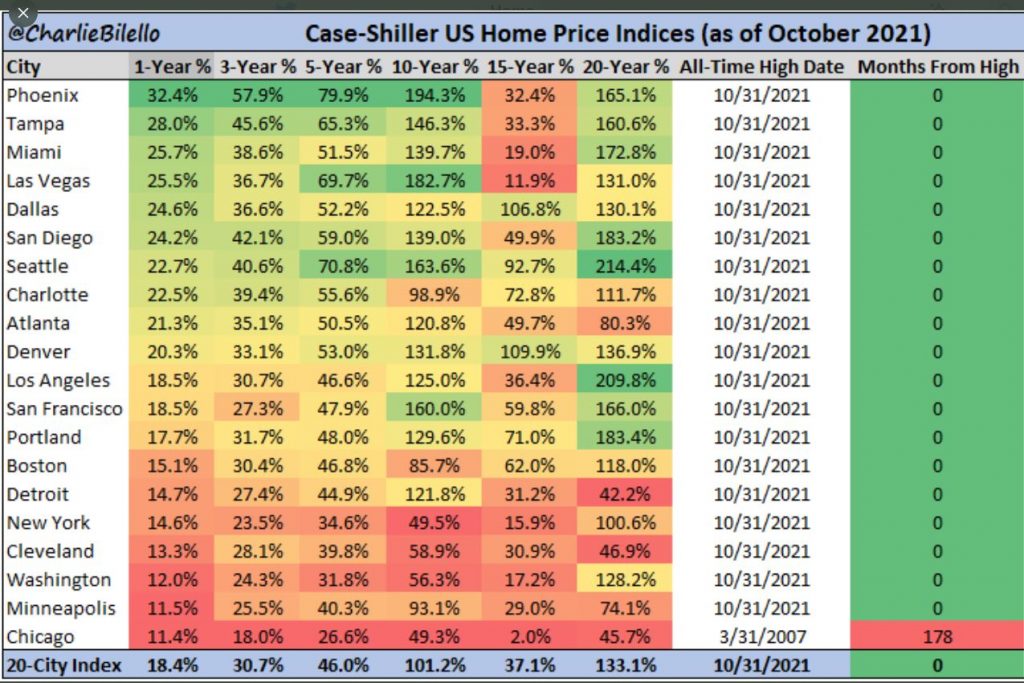
I saw this on Greg’s twitter, and thanks to Charlie too. On the ground it seems like the market is wildly out of control, but looking at this chart it looks like we’re just one of the pack.
Does it give buyers any comfort to know that the price explosion is happening everywhere?
by Jim the Realtor | Dec 28, 2021 | Same-House Sales |
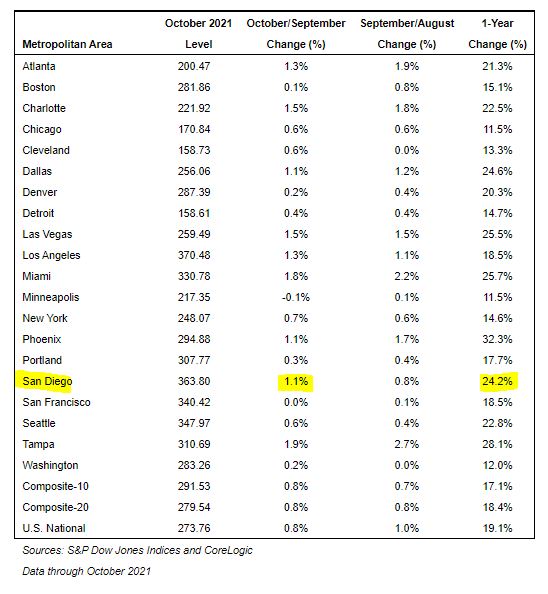
San Diego fell out of the top three cities for annual change – we’re down to #6 for October. But we have the highest home prices of those six cities! Though every region had double-digit YoY gains, a few cities (Boston, Denver, Minneapolis, Portland, San Francisco, and Washington) look like they’ve pulled into Plateau City.
Remember a year ago when we hit +11.5% YoY and thought we’ve never had it so good?
San Diego Non-Seasonally-Adjusted CSI changes
| Observation Month |
SD CSI |
M-o-M chg |
Y-o-Y chg |
| Jan ’20 |
264.04 |
+0.2% |
+5.1% |
| Feb |
265.34 |
+0.5% |
+4.6% |
| Mar |
269.63 |
+1.6% |
+5.2% |
| Apr |
272.48 |
+1.1% |
+5.8% |
| May |
273.51 |
+0.4% |
+5.2% |
| Jun |
274.91 |
+0.5% |
+5.0% |
| Jul |
278.00 |
+1.1% |
+5.4% |
| Aug |
283.06 |
+1.8% |
+7.6% |
| Sep |
288.11 |
+1.8% |
+9.4% |
| Oct |
292.85 |
+1.6% |
+11.5% |
| Nov |
295.64 |
+1.0% |
+12.3% |
| Dec |
297.52 |
+0.6% |
+13.0% |
| Jan ’21 |
301.72 |
+1.4% |
+14.3% |
| Feb |
310.62 |
+2.9% |
+17.1% |
| Mar |
320.81 |
+3.3% |
+19.1% |
| Apr |
331.47 |
+3.3% |
+21.6% |
| May |
341.05 |
+2.9% |
+24.7% |
| Jun |
349.78 |
+2.6% |
+27.2% |
| Jul |
355.33 |
+1.6% |
+27.8% |
| Aug |
357.11 |
+0.5% |
+26.2% |
| Sep |
359.88 |
+0.8% |
+24.9% |
| Oct |
363.80 |
+1.1% |
+24.2% |
“In October 2021, U.S. home prices moved substantially higher, but at a decelerating rate,” says Craig J. Lazzara, Managing Director at S&P DJI. “The National Composite Index rose 19.1% from year-ago levels, and the 10- and 20-City Composites gained 17.1% and 18.4%, respectively. In all three cases, October’s gains were below September’s, and September’s gains were below August’s. That said, October’s 19.1% gain in the National Composite is the fourth-highest reading in the 34 years covered by our data. (The top three were the three months immediately preceding October.)
“We continue to see very strong growth at the city level. All 20 cities saw price increases in the year ended October 2021. October’s increase ranked in the top quintile of historical experience for 19 cities, and in the top decile for 17 of them. As was the case last month, however, in 14 of 20 cities, prices decelerated – i.e., increased by less in October than they had done in September.
“Phoenix’s 32.3% increase led all cities for the 29th consecutive month. Tampa (+28.1%) and Miami (+25.7%) continued in second and third place in October, narrowly edging out Las Vegas, Dallas, and San Diego. Prices were strongest in the South and Southeast (both +24.4%), but every region continued to log double-digit gains.
“We have previously suggested that the strength in the U.S. housing market is being driven in part by a change in locational preferences as households react to the COVID pandemic. More data will be required to understand whether this demand surge represents an acceleration of purchases that would have occurred over the next several years, or reflects a more permanent secular change.”
by Jim the Realtor | Nov 30, 2021 | 2021, Frenzy, Same-House Sales |
‘Deceleration’ at +24.9% YoY compared to when our market was just ramping up for the year-end frenzy of 2020? I’ll take it!
San Diego Non-Seasonally-Adjusted CSI changes
| Observation Month |
SD CSI |
M-o-M chg |
Y-o-Y chg |
| Jan ’20 |
264.04 |
+0.2% |
+5.1% |
| Feb |
265.34 |
+0.5% |
+4.6% |
| Mar |
269.63 |
+1.6% |
+5.2% |
| Apr |
272.48 |
+1.1% |
+5.8% |
| May |
273.51 |
+0.4% |
+5.2% |
| Jun |
274.91 |
+0.5% |
+5.0% |
| Jul |
278.00 |
+1.1% |
+5.4% |
| Aug |
283.06 |
+1.8% |
+7.6% |
| Sep |
288.11 |
+1.8% |
+9.4% |
| Oct |
292.85 |
+1.6% |
+11.5% |
| Nov |
295.64 |
+1.0% |
+12.3% |
| Dec |
297.52 |
+0.6% |
+13.0% |
| Jan ’21 |
301.72 |
+1.4% |
+14.3% |
| Feb |
310.62 |
+2.9% |
+17.1% |
| Mar |
320.81 |
+3.3% |
+19.1% |
| Apr |
331.47 |
+3.3% |
+21.6% |
| May |
341.05 |
+2.9% |
+24.7% |
| Jun |
349.78 |
+2.6% |
+27.2% |
| Jul |
355.33 |
+1.6% |
+27.8% |
| Aug |
357.11 |
+0.5% |
+26.2% |
| Sep |
359.88 |
+0.8% |
+24.9% |
“If I had to choose only one word to describe September 2021?s housing price data, the word would be ‘deceleration,’ says Craig Lazzara, managing director at S&P Dow Jones Indices. “Housing prices continued to show remarkable strength in September, though the pace of price increases declined slightly.”
Extremely tight inventory, as well as heavy investor activity in the housing market, is keeping prices elevated. While the gains are falling, it is unlikely that prices will drop dramatically as they did during the housing crash. The fundamentals of supply and demand still favor an expensive market.
“The market has cooled since the beginning of the year, when dozens of competing bids, contingency waivers and price escalation clauses made home shopping a struggle, especially for first-time buyers. A growing number of homeowners are preparing to list in the next six months, hinting at an uncharacteristically active winter season,” said George Ratiu, manager of economic research at Realtor.com.
by Jim the Realtor | Oct 26, 2021 | Same-House Sales
Lower volume could keep the index elevated. We had 382 sales last October, and today we’re at 189 for the month with four days to go plus late-reporters. We should end up with about the same as in 2019 (240).
San Diego Non-Seasonally-Adjusted CSI changes
| Observation Month |
SD CSI |
M-o-M chg |
Y-o-Y chg |
| Jan ’20 |
264.04 |
+0.2% |
+5.1% |
| Feb |
265.34 |
+0.5% |
+4.6% |
| Mar |
269.63 |
+1.6% |
+5.2% |
| Apr |
272.48 |
+1.1% |
+5.8% |
| May |
273.51 |
+0.4% |
+5.2% |
| Jun |
274.91 |
+0.5% |
+5.0% |
| Jul |
278.00 |
+1.1% |
+5.4% |
| Aug |
283.06 |
+1.8% |
+7.6% |
| Sep |
288.11 |
+1.8% |
+9.4% |
| Oct |
292.85 |
+1.6% |
+11.5% |
| Nov |
295.64 |
+1.0% |
+12.3% |
| Dec |
297.52 |
+0.6% |
+13.0% |
| Jan ’21 |
301.72 |
+1.4% |
+14.3% |
| Feb |
310.62 |
+2.9% |
+17.1% |
| Mar |
320.81 |
+3.3% |
+19.1% |
| Apr |
331.47 |
+3.3% |
+21.6% |
| May |
341.05 |
+2.9% |
+24.7% |
| Jun |
349.78 |
+2.6% |
+27.2% |
| Jul |
355.33 |
+1.6% |
+27.8% |
| Aug |
357.11 |
+0.5% |
+26.2% |
“Persistently strong demand among traditional homebuyers has been amplified by an increase in demand among investors this summer,” said Selma Hepp, deputy chief economist at CoreLogic. “While strong home price appreciation rates are narrowing the pool of buyers, particularly first-time buyers, the depth of the supply and demand imbalance and robust demand among higher-income earners will continue to push prices higher.”
by Jim the Realtor | Oct 20, 2021 | Forecasts, Sales and Price Check, Same-House Sales |
https://journal.firsttuesday.us/san-diego-housing-indicators-2/29246/
~~~~~~~~~~~~~~~~~~~~~~~~~~~~~~~~~~~~~~~~~~~~~~~~~~~~~~~~~
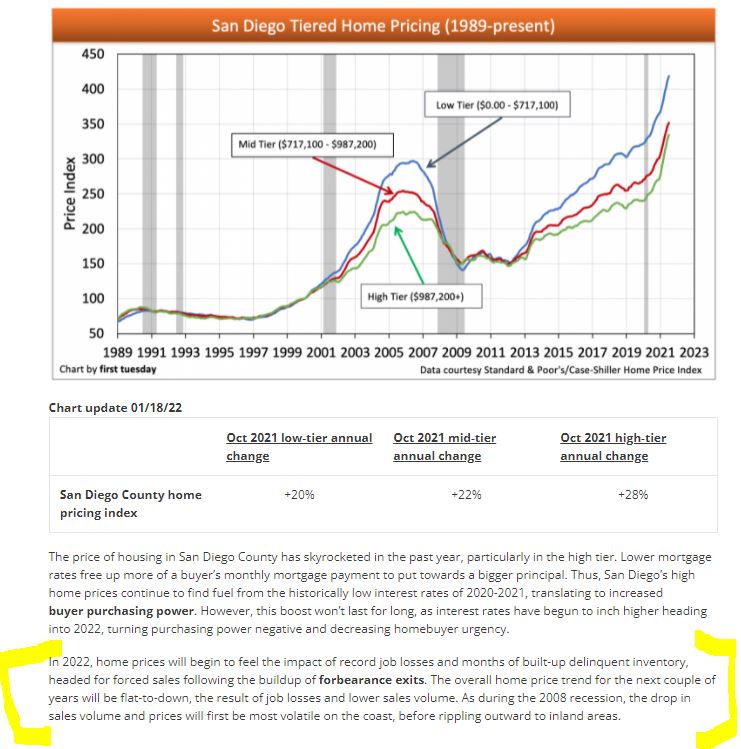
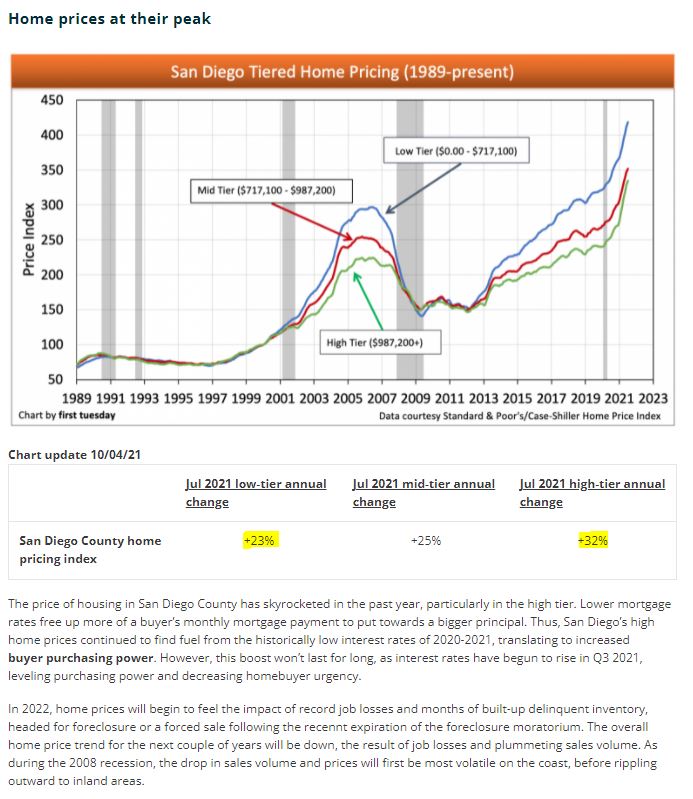
With the supply and demand so out of balance on the lower-end, it’s incredible to see that the high-end is out-performing with faster appreciation. It looks like big money is throwing its weight around!
Note this guy’s negativity in the second paragraph.
I guarantee you that he is going to be wrong, wrong, wrong.
by Jim the Realtor | Sep 28, 2021 | Same-House Sales |
The soft landing continued in July, with the month-over-month increase being half of what it was in April. The YoY set another recent high, but wasn’t the all-time record. In July and August, 2004 the local index rose 33% YoY.
San Diego Non-Seasonally-Adjusted CSI changes
| Observation Month |
SD CSI |
M-o-M chg |
Y-o-Y chg |
| Jan ’20 |
264.04 |
+0.2% |
+5.1% |
| Feb |
265.34 |
+0.5% |
+4.6% |
| Mar |
269.63 |
+1.6% |
+5.2% |
| Apr |
272.48 |
+1.1% |
+5.8% |
| May |
273.51 |
+0.4% |
+5.2% |
| Jun |
274.91 |
+0.5% |
+5.0% |
| Jul |
278.00 |
+1.1% |
+5.4% |
| Aug |
283.06 |
+1.8% |
+7.6% |
| Sep |
288.11 |
+1.8% |
+9.4% |
| Oct |
292.85 |
+1.6% |
+11.5% |
| Nov |
295.64 |
+1.0% |
+12.3% |
| Dec |
297.52 |
+0.6% |
+13.0% |
| Jan ’21 |
301.72 |
+1.4% |
+14.3% |
| Feb |
310.62 |
+2.9% |
+17.1% |
| Mar |
320.81 |
+3.3% |
+19.1% |
| Apr |
331.47 |
+3.3% |
+21.6% |
| May |
341.05 |
+2.9% |
+24.7% |
| Jun |
349.78 |
+2.6% |
+27.2% |
| Jul |
355.33 |
+1.6% |
+27.8% |
“We have previously suggested that the strength in the U.S. housing market is being driven in part by a reaction to the COVID pandemic, as potential buyers move from urban apartments to suburban homes. July’s data are consistent with this hypothesis.”
“This demand surge may simply represent an acceleration of purchases that would have occurred anyway over the next several years. Alternatively, there may have been a secular change in locational preferences, leading to a permanent shift in the demand curve for housing. More time and data will be required to analyze this question.”
“Phoenix’s 32.4% increase led all cities for the 26th consecutive month, with San Diego (+27.8%) and Seattle (+25.5%) not far behind. As has been the case for the last several months, prices were strongest in the Southwest (+24.2%) and West (+23.7%), but every region logged double-digit gains and recorded all-time high rate increases.”
by Jim the Realtor | Aug 31, 2021 | Same-House Sales |
Remember when we were impressed that our Case-Shiller Index was going up 3% to 5% per year?
How do you like +27.2% YoY?
The month-over-month increase was the lowest since January, so it will interesting to see if pricing starts to plateau. With inventory so low, the pricing statistics could continue upward.
San Diego Non-Seasonally-Adjusted CSI changes
| Observation Month |
SD CSI |
M-o-M chg |
Y-o-Y chg |
| Jan ’20 |
264.04 |
+0.2% |
+5.1% |
| Feb |
265.34 |
+0.5% |
+4.6% |
| Mar |
269.63 |
+1.6% |
+5.2% |
| Apr |
272.48 |
+1.1% |
+5.8% |
| May |
273.51 |
+0.4% |
+5.2% |
| Jun |
274.91 |
+0.5% |
+5.0% |
| Jul |
278.00 |
+1.1% |
+5.4% |
| Aug |
283.06 |
+1.8% |
+7.6% |
| Sep |
288.11 |
+1.8% |
+9.4% |
| Oct |
292.85 |
+1.6% |
+11.5% |
| Nov |
295.64 |
+1.0% |
+12.3% |
| Dec |
297.52 |
+0.6% |
+13.0% |
| Jan ’21 |
301.72 |
+1.4% |
+14.3% |
| Feb |
310.62 |
+2.9% |
+17.1% |
| Mar |
320.81 |
+3.3% |
+19.1% |
| Apr |
331.47 |
+3.3% |
+21.6% |
| May |
341.05 |
+2.9% |
+24.7% |
| Jun |
349.78 |
+2.6% |
+27.2% |
Phoenix, San Diego, and Seattle reported the strongest price increases of the 20 cities. Prices in Phoenix increased 29.3% year-over-year. In San Diego they rose 27.1%, and in Seattle they were up 25.0%. All 20 cities reported higher price increases in the year ending June 2021 versus the year ending May 2021.
“The last several months have been extraordinary not only in the level of price gains, but in the consistency of gains across the country,” said Craig Lazzara, managing director and global head of index investment strategy at S&P DJI. “In June, all 20 cities rose, and all 20 gained more in the 12 months ended in June than they had gained in the 12 months ended in May.”
Prices in just about every city in the 20-city index, except for Chicago, are at all-time highs, he said, as are the national composition and the 10- and 20-city indices.
Peter Boockvar, chief investment officer at Bleakley Advisory group, said prices are rising at “a really out of control pace that is unsustainable and unhealthy.”
Home sales, however, have started to cool. Signed contracts on existing homes dropped in July, according to the National Association of Realtors. Prices usually lag sales by about six months, so that could be a sign that price gains will stop accelerating as they have been for over a year.
“According to new Ally Home data, 45% of buyers say they have delayed purchasing a home due to market conditions, with 29% citing high home prices and 20% indicating homes selling too quickly as factors in this delay,” says Glenn Brunker, president of Ally Home.
https://www.cnbc.com/2021/08/31/home-prices-surged-in-june-shattering-another-record-sp-case-shiller-says.html
by Jim the Realtor | Jul 27, 2021 | Same-House Sales |
Phoenix edged us out again for the top spot in May, but the San Diego CSI went up 12.4% between February and May, which looks like a record for four months of appreciation – and at these prices!
San Diego Non-Seasonally-Adjusted CSI changes
| Observation Month |
SD CSI |
M-o-M chg |
Y-o-Y chg |
| Jan ’20 |
264.04 |
+0.2% |
+5.1% |
| Feb |
265.34 |
+0.5% |
+4.6% |
| Mar |
269.63 |
+1.6% |
+5.2% |
| Apr |
272.48 |
+1.1% |
+5.8% |
| May |
273.51 |
+0.4% |
+5.2% |
| June |
274.91 |
+0.5% |
+5.0% |
| July |
278.00 |
+1.1% |
+5.4% |
| Aug |
283.06 |
+1.8% |
+7.6% |
| Sep |
288.11 |
+1.8% |
+9.4% |
| Oct |
292.85 |
+1.6% |
+11.5% |
| Nov |
295.64 |
+1.0% |
+12.3% |
| Dec |
297.52 |
+0.6% |
+13.0% |
| Jan ’21 |
301.72 |
+1.4% |
+14.3% |
| Feb |
310.62 |
+2.9% |
+17.1% |
| Mar |
320.81 |
+3.3% |
+19.1% |
| Apr |
331.47 |
+3.3% |
+21.6% |
| May |
341.05 |
+2.9% |
+24.7% |
“Housing price growth set a record for the second consecutive month in May 2021,” says Craig J. Lazzara, Managing Director and Global Head of Index Investment Strategy at S&P DJI. “The National Composite Index marked its twelfth consecutive month of accelerating prices with a 16.6% gain from year-ago levels, up from 14.8% in April. This acceleration is also reflected in the 10- and 20-City Composites (up 16.4% and 17.0%, respectively)”.
The market’s strength continues to be broadly-based: all 20 cities rose, and all 20 gained more in the 12 months ended in May than they had gained in the 12 months ended in April. Prices in 18 of our 20 cities now stand at all time highs, as do the National Composite and both the 10- and 20-City indices.
“A month ago, I described April’s performance as “truly extraordinary,” and this month I find myself running out of superlatives. The 16.6% gain is the highest reading in more than 30 years of S&P CoreLogic Case-Shiller data. As was the case last month, five cities – Charlotte, Cleveland, Dallas, Denver, and Seattle – joined the National Composite in recording their all-time highest 12-month gains. Price gains in all 20 cities were in the top quartile of historical performance; in 17 cities, price gains were in top decile”.
“We have previously suggested that the strength in the U.S. housing market is being driven in part by reaction to the COVID pandemic, as potential buyers move from urban apartments to suburban homes. May’s data continue to be consistent with this hypothesis. This demand surge may simply represent an acceleration of purchases that would have occurred anyway over the next several years. Alternatively, there may have been a secular change in locational preferences, leading to a permanent shift in the demand curve for housing. More time and data will be required to analyze this question”.
“Phoenix’s 25.9% increase led all cities for the 24th consecutive month, with San Diego (+24.7%) and Seattle (+23.4%) close behind. As was the case last month, prices were strongest in the West (+19.9%) and Southwest (+19.8%), but every region logged double-digit gains.”


