
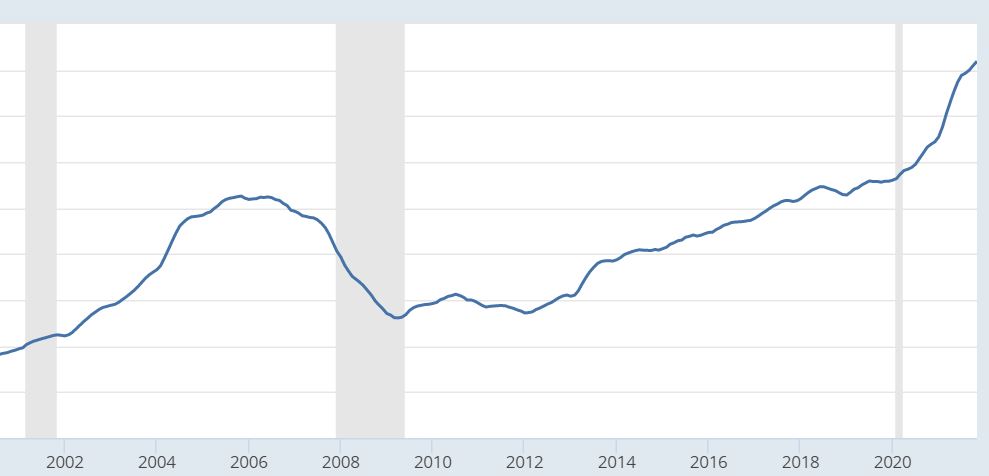
We can see how MoM pricing started to slow at end of summer, only to have it pick up again in 4Q21:
San Diego Non-Seasonally-Adjusted CSI changes
| Observation Month | |||
| Jan ’20 | |||
| Feb | |||
| Mar | |||
| Apr | |||
| May | |||
| Jun | |||
| Jul | |||
| Aug | |||
| Sep | |||
| Oct | |||
| Nov | |||
| Dec | |||
| Jan ’21 | |||
| Feb | |||
| Mar | |||
| Apr | |||
| May | |||
| Jun | |||
| Jul | |||
| Aug | |||
| Sep | |||
| Oct | |||
| Nov |
Mortgage rates didn’t move much in October and November, holding between 3% and 3.25% for the average on the popular 30-year fixed. While that was slightly higher than the early summer levels, it was still historically low and considerably lower than where rates are now. Rates are now about 75 basis points above year-ago levels. Low rates over the last two years have given buyers more purchasing power and consequently fueled today’s sky-high prices.
“We should soon begin to see the impact of increasing mortgage rates on home prices,” added Lazzara.
A recent report from Realtor.com found that 14 out of the top 50 largest U.S. cities experienced listing price declines over the prior year in December.


