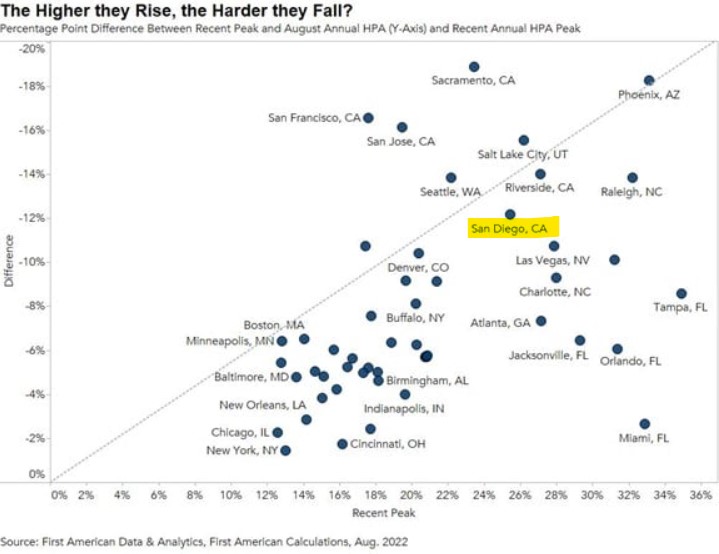
The local Case-Shiller index is due tomorrow, and expectations are for a 2% drop from June. First American has their own repeat-sales index which is already showing a 12% decline in San Diego pricing (above).
While the -12% over six months is probably a surprise to people who think pricing is downward sticky, it’s different this time. In the past, the home-equity positions were much smaller, and many sellers had hold out just to have enough for a steak dinner at closing.
None of today’s sellers need to hold out. All of them could sell today for what the market will bear, if they could just get out of their own way. Yes, it’s true that they may have plans for all the money and need to sell for their price, and those sellers should just wait it out.
This could be over before you know it.
Is there a specific marker for home buyers to know when it’s time to buy? Or is it just when prices go down?
Is the -12% enough to get the attention of the highly-motivated buyers – those who don’t own a house yet?
Or will they just look up in March/April and say, “Close enough!”
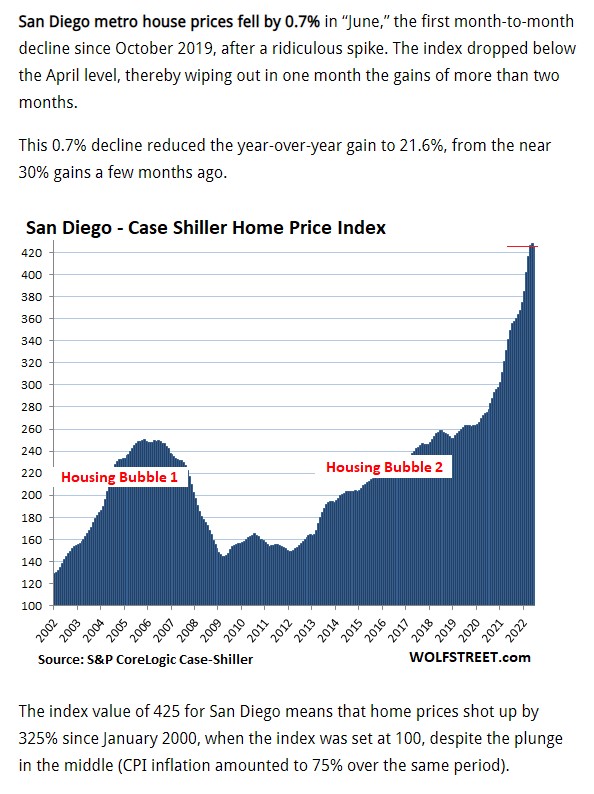
Everyone is throwing around the ‘deceleration’ word like it means something. But the only number that matters is the month-over-month change, which went DOWN for the first time since October 2019 – but it only went down that one month. The local index dropped 2.8% between July, 2018 and January, 2019, and we’ll probably see more than that this year.
Homes still won’t be affordable for most, and there won’t be many for sale as the Big Standoff of 2023 sets up.
San Diego Non-Seasonally-Adjusted CSI changes
Observation Month
SD CSI
M-o-M chg
Y-o-Y chg
Jan ’20
264.04
+0.2%
+5.1%
Feb
265.34
+0.5%
+4.6%
Mar
269.63
+1.6%
+5.2%
Apr
272.48
+1.1%
+5.8%
May
273.51
+0.4%
+5.2%
Jun
274.91
+0.5%
+5.0%
Jul
278.00
+1.1%
+5.4%
Aug
283.06
+1.8%
+7.6%
Sep
288.11
+1.8%
+9.4%
Oct
292.85
+1.6%
+11.5%
Nov
295.64
+1.0%
+12.3%
Dec
297.52
+0.6%
+13.0%
Jan ’21
301.72
+1.4%
+14.3%
Feb
310.62
+2.9%
+17.1%
Mar
320.81
+3.3%
+19.1%
Apr
331.47
+3.3%
+21.6%
May
341.05
+2.9%
+24.7%
Jun
349.78
+2.6%
+27.2%
Jul
355.33
+1.6%
+27.8%
Aug
357.11
+0.5%
+26.2%
Sep
359.88
+0.8%
+24.9%
Oct
363.80
+1.1%
+24.2%
Nov
367.62
+1.1%
+24.3%
Dec
374.48
+1.8%
+25.9%
Jan ’22
383.92
+2.5%
+27.2%
Feb
401.45
+4.6%
+29.2%
Mar
416.64
+3.8%
+29.9%
Apr
426.08
+2.3%
+28.5%
May
428.32
+0.5%
+25.6%
Jun
425.26
-0.7%
+21.6%
“It’s important to bear in mind that deceleration and decline are two entirely different things, and that prices are still rising at a robust clip,” wrote Craig Lazzara, managing director at S&P Dow Jones Indices in a release. “June’s growth rates for all three composites are at or above the 95th percentile of historical experience. For the first six months of 2022, in fact, the National Composite is up 10.6%.”
In the last 35 years, only four complete years have witnessed increases that large, he added.
Another report last week showed home prices declined 0.77% from June to July. It was the first monthly fall in nearly three years, according to Black Knight, a mortgage software, data and analytics firm.
While the drop may seem small, it is the largest single-month decline in prices since January 2011. It is also the second-worst July performance dating back to 1991, behind the 0.9% decline in July 2010, during the Great Recession.
Home prices are softening due to rising mortgage rates, making an already expensive housing market even more so. Sales of both new and existing homes have been dropping for several months, leading some economists to call a housing recession.
“We’ve noted previously that mortgage financing has become more expensive as the Federal Reserve ratchets up interest rates, a process that continued as our June data were gathered. As the macroeconomic environment continues to be challenging, home prices may well continue to decelerate,” said Lazzara.
Last month I guessed we’ll be 400+ at the end of the year, or about the same as February. If our local Case-Shiller Index drops 0.5% per month for the next seven readings, we’d still be in positive territory for 2022. We haven’t had a negative MoM reading since December, 2018.
San Diego Non-Seasonally-Adjusted CSI changes
Observation Month
SD CSI
M-o-M chg
Y-o-Y chg
Jan ’20
264.04
+0.2%
+5.1%
Feb
265.34
+0.5%
+4.6%
Mar
269.63
+1.6%
+5.2%
Apr
272.48
+1.1%
+5.8%
May
273.51
+0.4%
+5.2%
Jun
274.91
+0.5%
+5.0%
Jul
278.00
+1.1%
+5.4%
Aug
283.06
+1.8%
+7.6%
Sep
288.11
+1.8%
+9.4%
Oct
292.85
+1.6%
+11.5%
Nov
295.64
+1.0%
+12.3%
Dec
297.52
+0.6%
+13.0%
Jan ’21
301.72
+1.4%
+14.3%
Feb
310.62
+2.9%
+17.1%
Mar
320.81
+3.3%
+19.1%
Apr
331.47
+3.3%
+21.6%
May
341.05
+2.9%
+24.7%
Jun
349.78
+2.6%
+27.2%
Jul
355.33
+1.6%
+27.8%
Aug
357.11
+0.5%
+26.2%
Sep
359.88
+0.8%
+24.9%
Oct
363.80
+1.1%
+24.2%
Nov
367.62
+1.1%
+24.3%
Dec
374.48
+1.8%
+25.9%
Jan ’22
383.92
+2.5%
+27.2%
Feb
401.45
+4.6%
+29.2%
Mar
416.64
+3.8%
+29.9%
Apr
426.08
+2.3%
+28.5%
May
428.32
+0.5%
+25.6%
Housing data for May 2022 continued strong, as price gains decelerated slightly from very high levels,” says Craig J. Lazzara, Managing Director at S&P DJI. “The National Composite Index rose by 19.7% for the 12 months ended May, down from April’s 20.6% year-over-year gain. We see a similar pattern in the 10-City Composite (up 19.0% in May vs. 19.6% in April) and in the 20-City Composite (+20.5% vs. +21.2%). Despite this deceleration, growth rates are still extremely robust, with all three composites at or above the 98th percentile historically.
My guess is we’ll be 400+ at the end of the year, or about the same as February. A flat-pricing environment is the easiest of all the choices for buyers and sellers – just sell for the same amount as the last guy.
San Diego Non-Seasonally-Adjusted CSI changes
Observation Month
SD CSI
M-o-M chg
Y-o-Y chg
Jan ’20
264.04
+0.2%
+5.1%
Feb
265.34
+0.5%
+4.6%
Mar
269.63
+1.6%
+5.2%
Apr
272.48
+1.1%
+5.8%
May
273.51
+0.4%
+5.2%
Jun
274.91
+0.5%
+5.0%
Jul
278.00
+1.1%
+5.4%
Aug
283.06
+1.8%
+7.6%
Sep
288.11
+1.8%
+9.4%
Oct
292.85
+1.6%
+11.5%
Nov
295.64
+1.0%
+12.3%
Dec
297.52
+0.6%
+13.0%
Jan ’21
301.72
+1.4%
+14.3%
Feb
310.62
+2.9%
+17.1%
Mar
320.81
+3.3%
+19.1%
Apr
331.47
+3.3%
+21.6%
May
341.05
+2.9%
+24.7%
Jun
349.78
+2.6%
+27.2%
Jul
355.33
+1.6%
+27.8%
Aug
357.11
+0.5%
+26.2%
Sep
359.88
+0.8%
+24.9%
Oct
363.80
+1.1%
+24.2%
Nov
367.62
+1.1%
+24.3%
Dec
374.48
+1.8%
+25.9%
Jan ’22
383.92
+2.5%
+27.2%
Feb
401.45
+4.6%
+29.2%
Mar
416.64
+3.8%
+29.9%
Apr
426.08
+2.3%
+28.5%
Home price increases slowed ever so slightly in April, but it is the first potential sign of a cooling in prices.
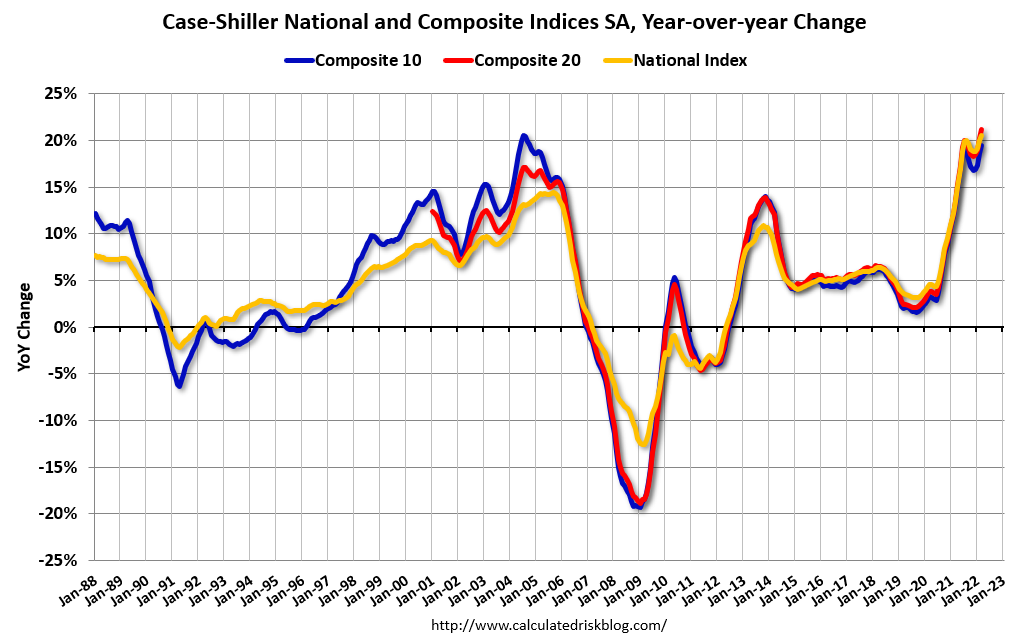
Prices rose 20.4% nationally in April compared with the same month a year ago, according to the S&P CoreLogic Case-Shiller Index. In March, home prices grew 20.6%. The last slight deceleration was in November of last year.
The 10-city composite annual increase was 19.7%, up from 19.5% in March. The 20-city composite posted a 21.2% annual gain, up from 21.1% in the previous month.
In a change from the last five months, when most of the 20 cities saw month-to-month price gains, only nine cities saw prices rise faster in April than they had done in March. Cities in the South continued to see the strongest monthly gains, including Charlotte, North Carolina; Tampa, Florida; Atlanta, Dallas and Miami.
“April 2022 showed initial (although inconsistent) signs of a deceleration in the growth rate of U.S. home prices,” Craig Lazzara, managing director at S&P DJI, wrote in a release. “We continue to observe very broad strength in the housing market, as all 20 cities notched double-digit price increases for the 12 months ended in April. April’s price increase ranked in the top quintile of historical experience for every city, and in the top decile for 19 of them.”
Tampa, Miami and Phoenix continued to lead the pack with the strongest price gains. Tampa home prices were up, with a stunning 35.8% year-over-year price increase, followed by Miami, with a 33.3% increase, and Phoenix, with a 31.3% increase. Nine of the 20 cities reported higher price increases in the year ending April 2022 versus the year ending March 2022.
Cities with the smallest gains, although still in double digits, were Minneapolis, Washington and Chicago.
Not only are these price gains for April, but the index is a three-month moving average. The average rate on the 30-year fixed mortgage just crossed the 5% mark in April after rising from around 3% in January. By June it had crossed 6%.
“We noted last month that mortgage financing has become more expensive as the Federal Reserve ratchets up interest rates, a process that had only just begun when April data were gathered,” said Lazzara. “A more challenging macroeconomic environment may not support extraordinary home price growth for much longer.”
The housing market is already cooling, with slower sales and reports of price drops among some sellers. The supply of homes for sale has also increased steadily, as more listings come on the market and homes already on it sit longer. Active inventory last week was 21% higher than it was the same week one year ago, according to Realtor.com.
“For buyers and sellers, the road ahead will require more flexibility in pricing, brushing up on negotiation skills, and acknowledging that market conditions today are different than even six months ago,” said George Ratiu, senior economist at Realtor.com.
Mortgage rates didn’t get into the fives until early April, and up until then, the frenzied-out buyers were grabbing something at any price. The June index will show the full effect, which we’ll get at the end of August.
San Diego Non-Seasonally-Adjusted CSI changes
Observation Month
SD CSI
M-o-M chg
Y-o-Y chg
Jan ’20
264.04
+0.2%
+5.1%
Feb
265.34
+0.5%
+4.6%
Mar
269.63
+1.6%
+5.2%
Apr
272.48
+1.1%
+5.8%
May
273.51
+0.4%
+5.2%
Jun
274.91
+0.5%
+5.0%
Jul
278.00
+1.1%
+5.4%
Aug
283.06
+1.8%
+7.6%
Sep
288.11
+1.8%
+9.4%
Oct
292.85
+1.6%
+11.5%
Nov
295.64
+1.0%
+12.3%
Dec
297.52
+0.6%
+13.0%
Jan ’21
301.72
+1.4%
+14.3%
Feb
310.62
+2.9%
+17.1%
Mar
320.81
+3.3%
+19.1%
Apr
331.47
+3.3%
+21.6%
May
341.05
+2.9%
+24.7%
Jun
349.78
+2.6%
+27.2%
Jul
355.33
+1.6%
+27.8%
Aug
357.11
+0.5%
+26.2%
Sep
359.88
+0.8%
+24.9%
Oct
363.80
+1.1%
+24.2%
Nov
367.62
+1.1%
+24.3%
Dec
374.48
+1.8%
+25.9%
Jan ’22
383.92
+2.5%
+27.2%
Feb
401.45
+4.6%
+29.2%
Mar
416.64
+3.8%
+29.9%
“Those of us who have been anticipating a deceleration in the growth rate of U.S. home prices will have to wait at least a month longer,” says Craig Lazzara, managing director at S&P DJI. “All 20 cities saw double-digit price increases for the 12 months ended in March, and price growth in 17 cities accelerated relative to February’s report.”
The expectation is that prices will begin to ease, since home sales have been falling now for several months. Demand, however, is still high, and real estate agents report that they are still seeing multiple offers for homes that are priced well. More supply is also coming on the market, as sellers worry they will miss out on the last days of the hot market.
“Mortgages are becoming more expensive as the Federal Reserve has begun to ratchet up interest rates, suggesting that the macroeconomic environment may not support extraordinary home price growth for much longer. Although one can safely predict that price gains will begin to decelerate, the timing of the deceleration is a more difficult call,” added Lazzara.
In recent weeks, the housing market has shifted, said Danielle Hale, chief economist for Realtor.com. “As buyer confidence sags and weighs down demand, real estate markets will re-balance, eventually tilting away from the heavy advantage that recent home sellers have enjoyed.”
(The San Diego seasonally-adjusted index was 416.51)
The February month-over-month increase was the highest ever, but it feels like ancient history:
San Diego Non-Seasonally-Adjusted CSI changes
Observation Month
SD CSI
M-o-M chg
Y-o-Y chg
Jan ’20
264.04
+0.2%
+5.1%
Feb
265.34
+0.5%
+4.6%
Mar
269.63
+1.6%
+5.2%
Apr
272.48
+1.1%
+5.8%
May
273.51
+0.4%
+5.2%
Jun
274.91
+0.5%
+5.0%
Jul
278.00
+1.1%
+5.4%
Aug
283.06
+1.8%
+7.6%
Sep
288.11
+1.8%
+9.4%
Oct
292.85
+1.6%
+11.5%
Nov
295.64
+1.0%
+12.3%
Dec
297.52
+0.6%
+13.0%
Jan ’21
301.72
+1.4%
+14.3%
Feb
310.62
+2.9%
+17.1%
Mar
320.81
+3.3%
+19.1%
Apr
331.47
+3.3%
+21.6%
May
341.05
+2.9%
+24.7%
Jun
349.78
+2.6%
+27.2%
Jul
355.33
+1.6%
+27.8%
Aug
357.11
+0.5%
+26.2%
Sep
359.88
+0.8%
+24.9%
Oct
363.80
+1.1%
+24.2%
Nov
367.62
+1.1%
+24.3%
Dec
374.48
+1.8%
+25.9%
Jan ’22
383.92
+2.5%
+27.2%
Feb
401.45
+4.6%
+29.2%
“U.S. home prices continued to advance at a very rapid pace in February,” says Craig J. Lazzara, Managing Director at S&P DJI. “The National Composite Index recorded a gain of 19.8% for the 12 months ended February 2022; the 10- and 20-City Composites rose 18.6% and 20.2%, respectively. All three composites reflect an acceleration of price growth relative to January’s level.
“The macroeconomic environment is evolving rapidly and may not support extraordinary home price growth for much longer. The post-COVID resumption of general economic activity has stoked inflation, and the Federal Reserve has begun to increase interest rates in response. We may soon begin to see the impact of increasing mortgage rates on home prices.”
(The San Diego seasonally-adjusted index was 404.45)
The prognosticators said prices would soften in 2022, but instead they have ‘reaccelerated’. Now the guessers are expecting the higher mortgage rates to slow down the runaway train – see below.
San Diego Non-Seasonally-Adjusted CSI changes
Observation Month
SD CSI
M-o-M chg
Y-o-Y chg
Jan ’20
264.04
+0.2%
+5.1%
Feb
265.34
+0.5%
+4.6%
Mar
269.63
+1.6%
+5.2%
Apr
272.48
+1.1%
+5.8%
May
273.51
+0.4%
+5.2%
Jun
274.91
+0.5%
+5.0%
Jul
278.00
+1.1%
+5.4%
Aug
283.06
+1.8%
+7.6%
Sep
288.11
+1.8%
+9.4%
Oct
292.85
+1.6%
+11.5%
Nov
295.64
+1.0%
+12.3%
Dec
297.52
+0.6%
+13.0%
Jan ’21
301.72
+1.4%
+14.3%
Feb
310.62
+2.9%
+17.1%
Mar
320.81
+3.3%
+19.1%
Apr
331.47
+3.3%
+21.6%
May
341.05
+2.9%
+24.7%
Jun
349.78
+2.6%
+27.2%
Jul
355.33
+1.6%
+27.8%
Aug
357.11
+0.5%
+26.2%
Sep
359.88
+0.8%
+24.9%
Oct
363.80
+1.1%
+24.2%
Nov
367.62
+1.1%
+24.3%
Dec
374.48
+1.8%
+25.9%
Jan ’22
383.92
+2.5%
+27.2%
Our 383.92 is the non-adjusted; the seasonally adjusted index was 389.19 in January! From cnbc:
After cooling off ever so slightly toward the end of last year, home price gains reaccelerated in January.
Home prices nationally rose 19.2% year-over-year in January, up from 18.9% in December, according to the S%P CoreLogic Case-Shiller Index. The 10-city Composite annual increase was 17.5%, up from 17.1% in the previous month. The 20-city composite rose 19.1%, up from 18.6% in December.
Phoenix, Tampa and Miami saw the biggest annual gains at 32.6%, 30.8% and 28.1%, respectively. Sixteen of the 20 cities reported higher price increases in the year ending January 2022 versus the year ending December 2021.
Washington, D.C., Minneapolis and Chicago saw the smallest annual gain, although they were all still up double digits from a year ago.
Tight supply and strong demand appear to be outweighing rising mortgage rates, which would usually take some of the heat out of housing.
While the index is a three-month running average, mortgage rates began to climb in January. The average rate on the 30-year fixed ended 2021 at around 3.25% and ended January at 3.68% according to Mortgage News Daily. It is now flirting with 5%.
“The macroeconomic environment is evolving rapidly. Declining COVID cases and a resumption of general economic activity has stoked inflation, and the Federal Reserve has begun to increase interest rates in response. We may soon begin to see the impact of increasing mortgage rates on home prices,” said Craig Lazzara, managing director at S&P Dow Jones Indices.
Higher mortgage rates have already started to affect sales in the first months of the year. Pending home sales, which measure signed contracts on existing homes, have now fallen for four straight months, according to the National Association of Realtors.
“The monthly payment for a median-priced home has jumped 30% in the past year, far outpacing even fast-rising consumer prices, up almost 8% from a year ago,” said George Ratiu, senior economist at Realtor.com in a release. “While the small number of homes-for-sale will keep upward pressure on prices as we move through the Spring buying season, I expect conditions to undergo noticeable adjustments in the months ahead.”
It’s early, and the final February sales count will probably wind up around 165-170, which is in line with years prior to 2021. However, the pricing is nuts – and related to the number of homes for sale!
Year
February Listings
# of Sales
Median List Price
Median Sales Price
Median DOM
2017
395
172
$1,299,900
$1,270,000
51
2018
358
162
$1,290,000
$1,275,000
13
2019
361
174
$1,275,000
$1,275,000
33
2020
360
184
$1,434,000
$1,376,500
29
2021
313
224
$1,719,500
$1,758,000
14
2022
193
156
$2,149,500
$2,386,500
9
LAST MONTH, THE MEDIAN SALES PRICE WAS 11% HIGHER THAN THE MEDIAN LIST PRICE!
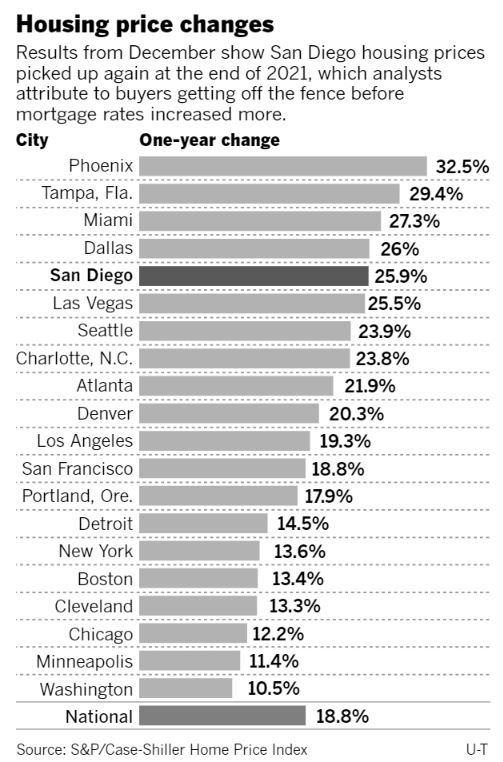
San Diego had the fifth highest year-over-year gain in 2021, behind metros with much lower price points (Phoenix, Tampa, Miami, and Dallas).
Our month-over-month gain in December was #1 nationwide (tied with Miami).
San Diego Non-Seasonally-Adjusted CSI changes
Observation Month
SD CSI
M-o-M chg
Y-o-Y chg
Jan ’20
264.04
+0.2%
+5.1%
Feb
265.34
+0.5%
+4.6%
Mar
269.63
+1.6%
+5.2%
Apr
272.48
+1.1%
+5.8%
May
273.51
+0.4%
+5.2%
Jun
274.91
+0.5%
+5.0%
Jul
278.00
+1.1%
+5.4%
Aug
283.06
+1.8%
+7.6%
Sep
288.11
+1.8%
+9.4%
Oct
292.85
+1.6%
+11.5%
Nov
295.64
+1.0%
+12.3%
Dec
297.52
+0.6%
+13.0%
Jan ’21
301.72
+1.4%
+14.3%
Feb
310.62
+2.9%
+17.1%
Mar
320.81
+3.3%
+19.1%
Apr
331.47
+3.3%
+21.6%
May
341.05
+2.9%
+24.7%
Jun
349.78
+2.6%
+27.2%
Jul
355.33
+1.6%
+27.8%
Aug
357.11
+0.5%
+26.2%
Sep
359.88
+0.8%
+24.9%
Oct
363.80
+1.1%
+24.2%
Nov
367.62
+1.1%
+24.3%
Dec
374.48
+1.8%
+25.9%
The experts have run out of superlatives, and roll out the same old explanations to describe the uptick in December – which was really the third month of the ramp-up into 2022:
Home prices rose 18.8% in 2021, according to the S&P CoreLogic Case-Shiller US National Home Price Index, the biggest increase in 34 years of data and substantially ahead of 2020’s 10.4% gain.
All regions saw price gains last year, but were strongest in the South and the Southeast, each up over 25%. Phoenix, Tampa and Miami reported the highest annual gains among the 20 cities in the index in December. Phoenix led the way for the 31st consecutive month with prices in December 32.5% over the year before. It was followed by Tampa with a 29.4% increase, and Miami with a 27.3% increase.
“We continue to see very strong growth at the city level,” said Craig J. Lazzara, Managing Director at S&P DJI. “All 20 cities saw price increases in 2021, and prices in all 20 are at their all-time highs.”
Over the past several months home prices have been rising at very high, but decelerating rates, said Lazzara. But that deceleration paused in December.
Lazzara said that strength in the US housing market is being driven in part by a change in location preferences as households react to the pandemic.
A persistent low inventory of homes dropped to record low levels in December, according to the National Association of Realtors. In the face of continued strong demand, prices were pushed higher. Newly constructed homes are in the pipeline, but a long-running shortage in supply combined with the lingering effects of the pandemic mean it will take years to meet demand.
“More data will be required to understand whether this demand surge simply represents an acceleration of purchases that would have occurred over the next several years rather than a more permanent secular change,” Lazzara said. “In the short term, we should soon begin to see the impact of increasing mortgage rates on home prices.”
Mortgage rates, which had risen only gradually since August, began to abruptly climb in late December closing in on the 4% threshold for a 30-year fixed-rate mortgage.
“Home prices continued to surpass expectations in December, but a marked change may be ahead for growth as rising mortgage rates eat into homebuyer purchasing power,” said Danielle Hale, Realtor.com’s chief economist. “While typical asking prices continue to accelerate, the pace of median sales price growth has slowed, signaling a potential gap between what buyers are willing and able to pay and what sellers are hoping to net.
Higher mortgage rates have added more than $200 to the monthly cost of a typical for-sale home since December 2020 — when rates were at all-time lows — with more than half of that increase occurring over the past eight weeks, Hale said.
“With home prices expected to continue rising, even at a slower pace, affordability will increasingly challenge 2022 buyers as a decade-long underbuilding trend has left the housing market 5.8 million homes short of household growth,” said Hale. “At the same time, we expect pandemic trends like workplace flexibility and competitive labor market conditions to give workers the boost in income and wider search areas they need to navigate a still-challenging housing market successfully.”
This guy has been drunk on the doom juice for so long that he must never get out of his bunker!
If he did, he would see the overwhelming demand for every new listing, even though underwriting standards are strict and rates are going up. Of the 140 NSDCC sales last month, 36% were all-cash.