
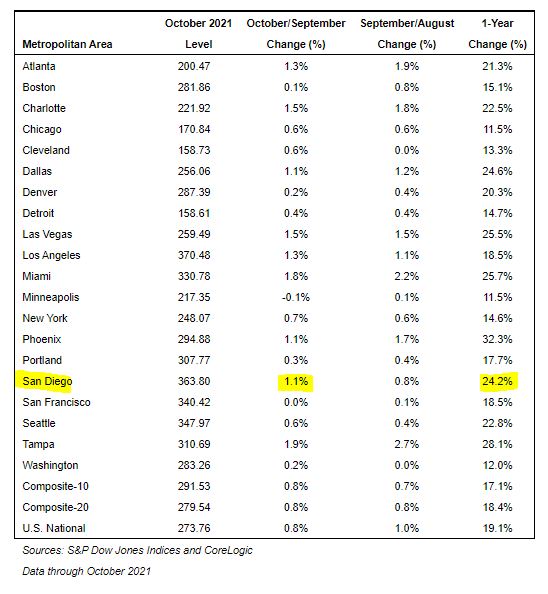
San Diego fell out of the top three cities for annual change – we’re down to #6 for October. But we have the highest home prices of those six cities! Though every region had double-digit YoY gains, a few cities (Boston, Denver, Minneapolis, Portland, San Francisco, and Washington) look like they’ve pulled into Plateau City.
Remember a year ago when we hit +11.5% YoY and thought we’ve never had it so good?
San Diego Non-Seasonally-Adjusted CSI changes
| Observation Month | |||
| Jan ’20 | |||
| Feb | |||
| Mar | |||
| Apr | |||
| May | |||
| Jun | |||
| Jul | |||
| Aug | |||
| Sep | |||
| Oct | |||
| Nov | |||
| Dec | |||
| Jan ’21 | |||
| Feb | |||
| Mar | |||
| Apr | |||
| May | |||
| Jun | |||
| Jul | |||
| Aug | |||
| Sep | |||
| Oct |
“In October 2021, U.S. home prices moved substantially higher, but at a decelerating rate,” says Craig J. Lazzara, Managing Director at S&P DJI. “The National Composite Index rose 19.1% from year-ago levels, and the 10- and 20-City Composites gained 17.1% and 18.4%, respectively. In all three cases, October’s gains were below September’s, and September’s gains were below August’s. That said, October’s 19.1% gain in the National Composite is the fourth-highest reading in the 34 years covered by our data. (The top three were the three months immediately preceding October.)
“We continue to see very strong growth at the city level. All 20 cities saw price increases in the year ended October 2021. October’s increase ranked in the top quintile of historical experience for 19 cities, and in the top decile for 17 of them. As was the case last month, however, in 14 of 20 cities, prices decelerated – i.e., increased by less in October than they had done in September.
“Phoenix’s 32.3% increase led all cities for the 29th consecutive month. Tampa (+28.1%) and Miami (+25.7%) continued in second and third place in October, narrowly edging out Las Vegas, Dallas, and San Diego. Prices were strongest in the South and Southeast (both +24.4%), but every region continued to log double-digit gains.
“We have previously suggested that the strength in the U.S. housing market is being driven in part by a change in locational preferences as households react to the COVID pandemic. More data will be required to understand whether this demand surge represents an acceleration of purchases that would have occurred over the next several years, or reflects a more permanent secular change.”


CoreLogic Deputy Chief Economist Selma Hepp said, “While the U.S. S&P CoreLogic Case-Shiller index continued to slow in October, up 19.1 percent but down from 20 percent peak annual gain two months prior, home prices are still increasing at double-digit rates in all metros reported by the index. The slowing of home prices is most notable in colder and more expensive areas, as well as middle-tier priced homes where homebuyers may have less wiggle room in their budgets. Low-tier priced homes are still in higher demand as entry-level buyers and investors continue to compete for the very limited supply. This suggests that 2022 will be another year of strong home price growth, averaging 7 percent for the year – which is slower than 2021 but still above the 5 percent average increase seen between 2010 and 2020.”
All three of the indices posted the same monthly gains before seasonal adjustment, 0.8 percent. After adjustment, the U.S. National Index was up 1.0 percent, and the 10-City and 20-City Composites posted increases of 0.8 percent and 0.9 percent, respectively. Eighteen of the 20 cities reported increases before seasonal adjustments and all 20 cities did so after adjustments.