

Lower volume could keep the index elevated. We had 382 sales last October, and today we’re at 189 for the month with four days to go plus late-reporters. We should end up with about the same as in 2019 (240).
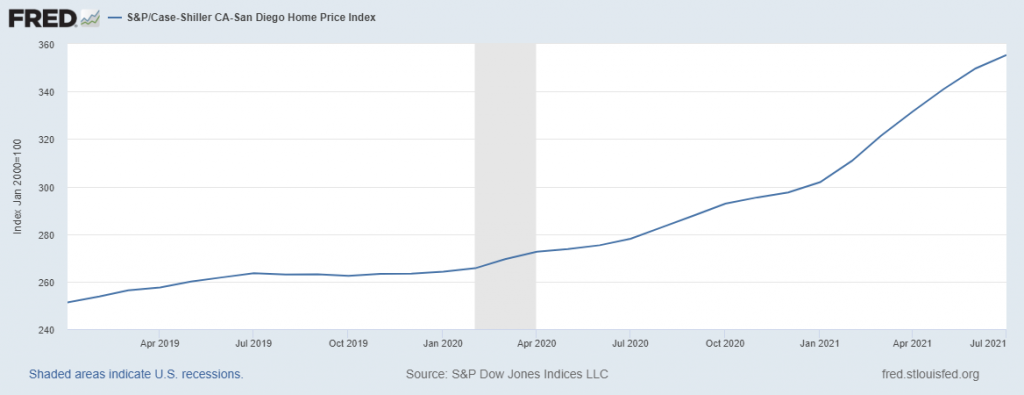
San Diego Non-Seasonally-Adjusted CSI changes
| Observation Month | |||
| Jan ’20 | |||
| Feb | |||
| Mar | |||
| Apr | |||
| May | |||
| Jun | |||
| Jul | |||
| Aug | |||
| Sep | |||
| Oct | |||
| Nov | |||
| Dec | |||
| Jan ’21 | |||
| Feb | |||
| Mar | |||
| Apr | |||
| May | |||
| Jun | |||
| Jul | |||
| Aug |
“Persistently strong demand among traditional homebuyers has been amplified by an increase in demand among investors this summer,” said Selma Hepp, deputy chief economist at CoreLogic. “While strong home price appreciation rates are narrowing the pool of buyers, particularly first-time buyers, the depth of the supply and demand imbalance and robust demand among higher-income earners will continue to push prices higher.”


0 Comments