Could we have a decent spring selling season next year?
Is there any precedent of our market settling down that quickly?
Home sales had been struggling for months, and then the Lehman Brothers collapse in September, 2008 helped to trigger the Great Recession, and millions of foreclosures and short sales.
Yet, just seven months later, home pricing hit the bottom in San Diego (see graph above).
We are enduring a once-in-a-lifetime spike in mortgage rates that are rightfully taking some time to digest. But people need to move, and by next spring, many will be buying and selling homes around here.
The Fed will have slowed down by then, the political landscape looks like it will drift more towards the center, and realtors are figuring it out that you have to have a spectacular-looking home with an attractive price to have a chance at selling. All will play a role in giving home buyers more confidence.
My listing from two weeks ago that generated 18 offers – 17 of them financed – and got bid up by 27% over the list price is proof that, in spite of the common perception that the market is dead, there is a strong demand right under the surface, just waiting for the right house, at the right price.
Those who were reading this blog in the 2008-2013 will remember how negative we were about the market, and how long it would take before it bottomed out – most figured it would be years and years. True, we aren’t going to get the government stimulus this time, but I don’t think we need it.
There will be a lot of skepticism in the market – and most people will wait until others go first before they think of entering the market themselves. We probably won’t ever see the sizzling frenzy conditions again, but a healthy semi-surge for a couple of months next spring seems like a good possibility. If it happens, it will be because sellers and agents got smart about selling in the post-frenzy era.
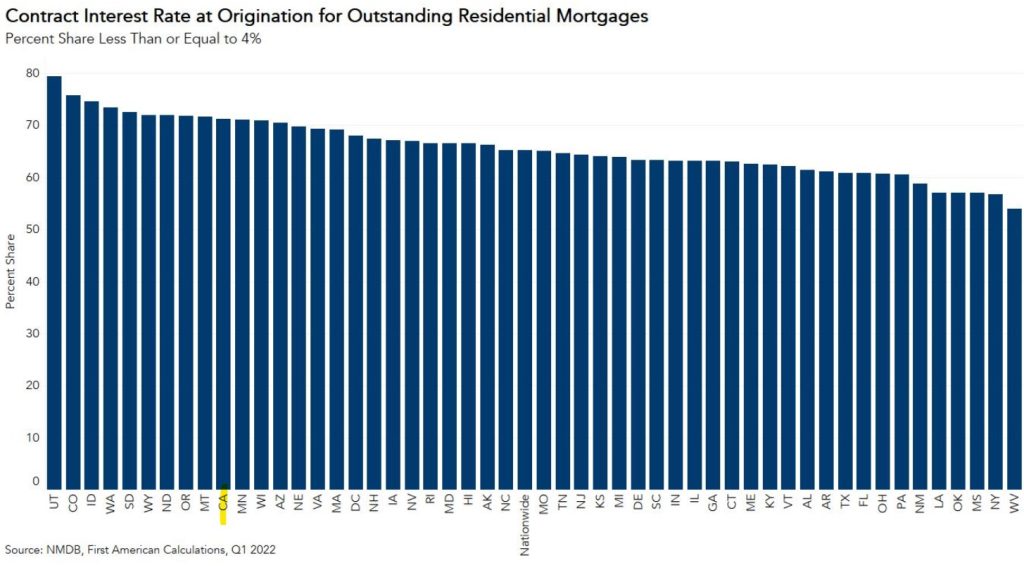
In California, about 70% of the outstanding mortgages have a mortgage rate below 4%, which means it’s unlikely that many of those homeowners will move if they have to qualify for and accept a much-higher rate. Plus, about 30% of local homeowners don’t have a mortgage.
Who is left? Anyone?
Home Buyers Who Will Keep Looking:
Out-of-towners
First timers
1031 exchangers
Parents buying with/for kids.
But with an all-time low inventory of homes for sale expected in 2023, we won’t need the same demand as we’ve had in the past. Let’s look at the annual sales counts.
San Diego County Annual Sales of Detached-Homes
2018: 22,740
2019: 23,124
2020: 23,829
2021: 24,611
2022: 16,086 through three quarters.
The impact from higher rates kicked in during the second half of this year. Up until then, the frenzy carried buyers to the finish line even though they were getting rates in the 4s and 5s. Once rates went over 6% in June, the sales started declining, and it looks like there will be approximately 7,500 sales in second half of 2022. Add to the 10,469 sales from the first half, and the total annual sales will be around 17,969 this year.
Higher rates will probably persist, and the annual sales next year will likely be under 17,000 in San Diego County – an area of 3.3 million people.
The number of listings in 2022 is running about 11% lower than last year, and if there is another 11% decline next year (likely), it will leave us with roughly 22,654 homes for sale in 2023. If only 60% of those actually sell, then sales would be 13,592 for the county, which will be roughly 24% fewer than in 2022, and 45% fewer than in 2021.
The only thing that could change the outcome is if we have the Big Capitulation, where both sellers and buyers give enough to make more sales happen.
Next year, everyone will be talking about how mortgage rates in the 7s or 8s will be causing a lack of affordability, but I have bad news for those who still want to buy.
There probably won’t be many homes for sale.
It will only take one or two headlines about the real estate market being crushed by high rates to cause potential sellers to pack it in until “the market gets better”.
Look how few sellers came to market last month:
NSDCC Detached-Home Listings, October
Year
Number of Listings
Median List Price
2018
401
$1,555,000
2019
371
$1,695,000
2020
400
$1,849,350
2021
228
$2,160,000
2022
174
$2,362,500
Before last year, the lowest October-listings count over the last twenty years was 312 in 2012, and back in the golden years of real estate, there were 452 October listings in 2001, and 510 in 2002!
510 vs. 174?
Yikes!
Hopefully, those who do list their homes for sale next year will be highly motivated, and, lucky for them, having so few competitors will cause their list prices to stay elevated.
Don’t be surprised if the 2023 spring selling season ends up being the Greatest Standoff Ever!
I tell potential home buyers to keep looking because you never know when you will find the right house – which is the most important part of the equation. Most will convince themselves that it will be easier to find the right house if prices came down, and besides, the current crop isn’t that interesting.
To keep it simple, let’s just calculate how mortgage rates have changed the equation:
Purchase Price: $2,000,000
Loan Amount: $1,600,000
30-yr jumbo rate: 3%
Monthly pmt: $6,746
Buyers who expect the sellers to make up the entire difference with a lower sales price will have to wait until they can find a home that meets this description:
Purchase Price: $1,400,000
Loan Amount: $1,120,000
30-yr jumbo rate: 6%
Monthly pmt: $6,715
If home prices come down 30%, it will enable buyers to buy the same house for the same monthly payment – and with a $120,000 smaller down payment too. If it happened over the next five years, it means we only need to drop about 6% per year, and we’ve already dropped more than that in 2022.
Or let’s say you want to roll back to pre-pandemic pricing.
NSDCC homes that sold in February, 2020 closed at a median of $509/sf, and last month the median was $793/sf which means we’d need a 36% decline to get back to pre-pandemic pricing.
How are you going to play it?
Are you going to wait until you actually see homes selling for 30% to 36% off to get back into the game?
Are are you going to wait until rates come back to 3%?
Or do we acknowledge that the buyers who have more horsepower are going to jump back in sooner, and there’s not much chance of prices dropping the full 30% to 36%? The highly-motivated affluent folks will probably be satisfied with 20% off, and they will derail a full decline. It’s what happened in 2012.
Can you live with 20% off?
Because if you can, then you need to stay in the game.
If the #1 variable is buying the right house, then #2 is timing.
I think the affluent will be looking next spring, and if they find a suitable house, they are going to buy it. By then, some of the statistical pricing gauges will be showing 10% to 20% declines, either nationally or in isolated markets. Because the local pricing isn’t that nuanced and buyers just want a house, they will decide that’s close enough and go ahead with the purchase.
To support my suspicion, I’ll note that during the frenzy, it was the same mentality, just in reverse.
When people found the right house, they just paid whatever it took – even if it meant paying $500,000 to $1,000,000 over the list price! Nothing else mattered besides getting the right house.
Most buyers won’t believe their eyes, and the volume will be thin. But sellers will appreciate any momentum and be encouraged to price their home for about what they thought they could get, with not much discount. Buyers who want discounts will be relegated to scouring through the dent-and-scratch bin, or hope that moving during the off-season might be more fruitful. Great for them.
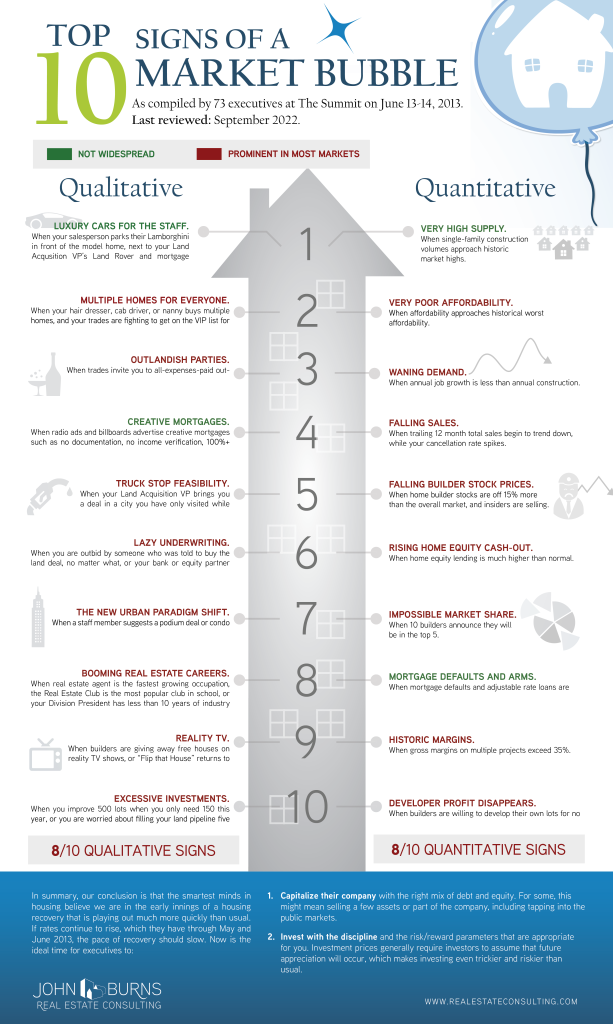
In 2013, fresh off the biggest housing downturn in their lifetimes, 73 housing industry executives compiled the Top 10 Signs of a Housing Market Bubble at our Summit Conference in Laguna Beach, CA. Assessing the criteria that we set almost a decade ago (10 quantitative and 10 qualitative), we have found that 16 of the 20 housing bubble signs are now flashing red.
In last month’s client-exclusive housing outlook webinar, we called out some signs we are seeing:
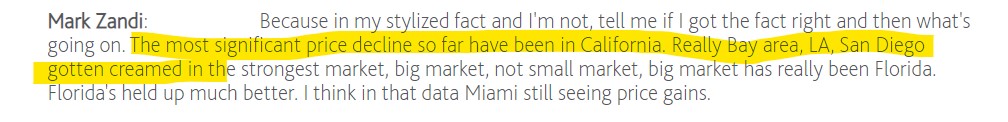
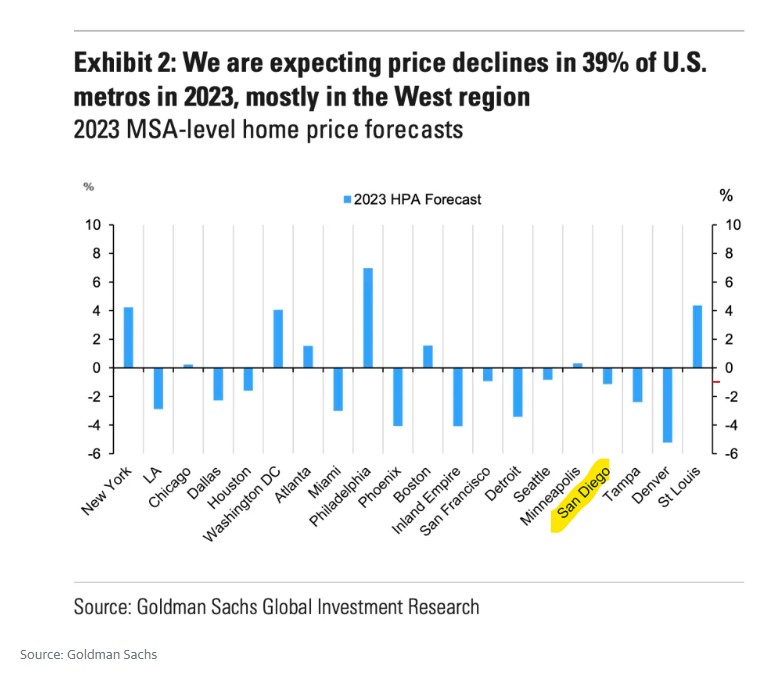
Dr. Doom said in his podcast here that the California markets have had the most significant price declines, and the Bay Area, LA, and San Diego have ‘gotten creamed’.
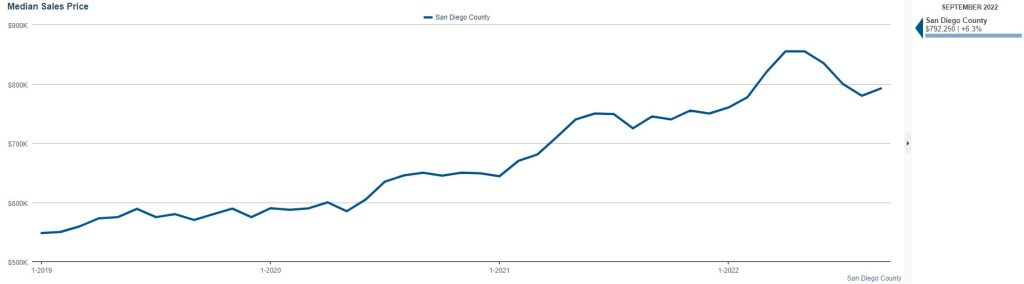
He didn’t provide any data to back it up, so let’s look at what we have from the MLS which includes September data so we’re including the most relevant information.
San Diego County, All Property Types:
The San Diego County median sales price was $855,000 in June and July, and last month it was $792,500 – which was a 7% decline from the peak this summer. It was also 2% higher than in August. Is that creamed?
We’re coming off the greatest real estate frenzy of all-time, and now the Fed has caused mortgage rates to double in less than six months. All considered, I think we’re doing great, and better than expected.
These guys who just fling it around on their national platforms are doing undue harm to our market. Don’t listen to them until they get out of their mom’s basement and actually investigate what’s really happening!
I mentioned in my very first blog post seventeen years ago that all it takes to achieve 20% to 25% annual appreciation is for everyone to pay a little more than the last guy. The same principle works in reverse too.
San Diego Non-Seasonally-Adjusted CSI changes
Observation Month
SD CSI
M-o-M chg
Y-o-Y chg
Jan ’21
301.72
+1.4%
+14.3%
Feb
310.62
+2.9%
+17.1%
Mar
320.81
+3.3%
+19.1%
Apr
331.47
+3.3%
+21.6%
May
341.05
+2.9%
+24.7%
Jun
349.78
+2.6%
+27.2%
Jul
355.33
+1.6%
+27.8%
Aug
357.11
+0.5%
+26.2%
Sep
359.88
+0.8%
+24.9%
Oct
363.80
+1.1%
+24.2%
Nov
367.62
+1.1%
+24.3%
Dec
374.48
+1.8%
+25.9%
Jan ’22
383.92
+2.5%
+27.2%
Feb
401.45
+4.6%
+29.2%
Mar
416.64
+3.8%
+29.9%
Apr
426.08
+2.3%
+28.5%
May
428.32
+0.5%
+25.6%
Jun
425.26
-0.7%
+21.6%
Jul
414.32
-2.5%
+16.6%
~~~~~~~~~~~~~~~~~~~~~~~~~~~~~~~~~~~~~
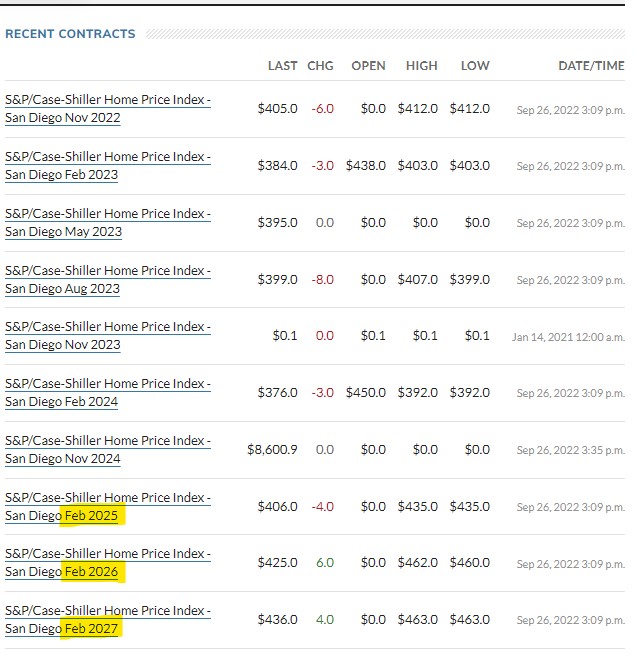
Bob Shiller regularly touts the Case-Shiller futures market but it’s a gambling hall if you ask me. Here’s what those bettors think about our local index:
IF they are accurate about the future of San Diego home pricing, then either you can sell your house now for today’s prices, or wait until 2025 and sell for about the same.
The final accuracy of any guess on appreciation doesn’t matter. We all know that they are just guesses.
What matters is whether home buyers and sellers will make decisions today, based on what they read.
If I keep showing data and forecasts that show pricing isn’t tanking between La Jolla and Carlsbad, would it cause you to ignore the national doom and do something different, like buy or sell now?
Or will people just take it all in, and then do what they planned to do all along – move next spring? Or deliberately wait until 2024 to ‘wait-and-see’ what happens then, hoping for something different?
Because for the market to be ‘different’ , there would need to be a change here:
Very few quality homes for sale at less-than-retail pricing.
Most everyone who bought a home in the last 13 years has tremendous incentives to NOT sell it. Will the IRS waive the capital-gains tax to help the real estate market? Will there be a load of new homes built between La Jolla and Carlsbad? Will higher rates make potential sellers panic?
The answer to those questions is ‘very unlikely’, and things are most likely going to stay the same.
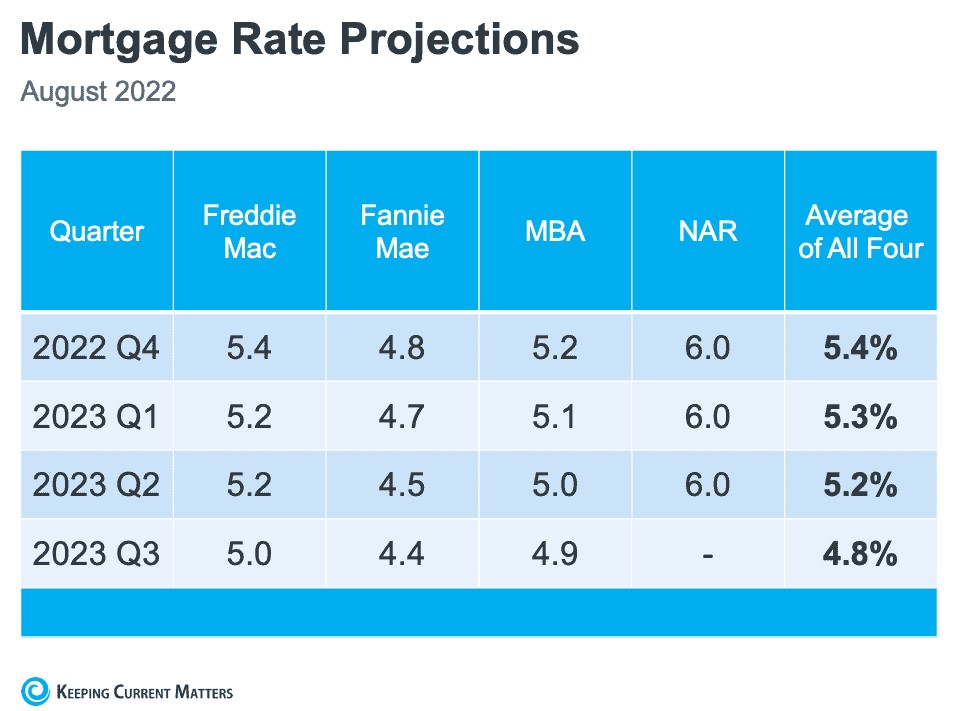
Will ANY data or forecasts have an effect on your moving plans?
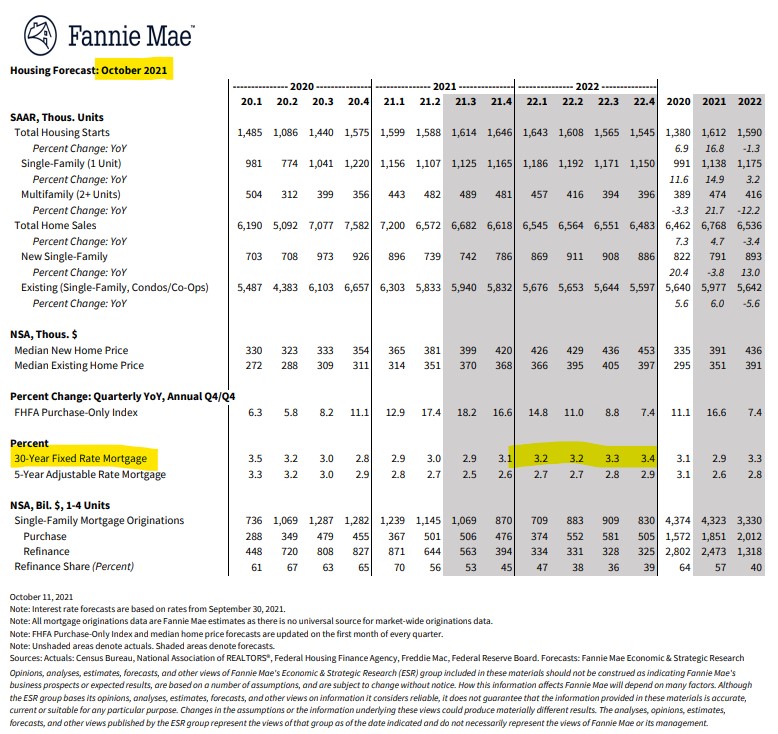
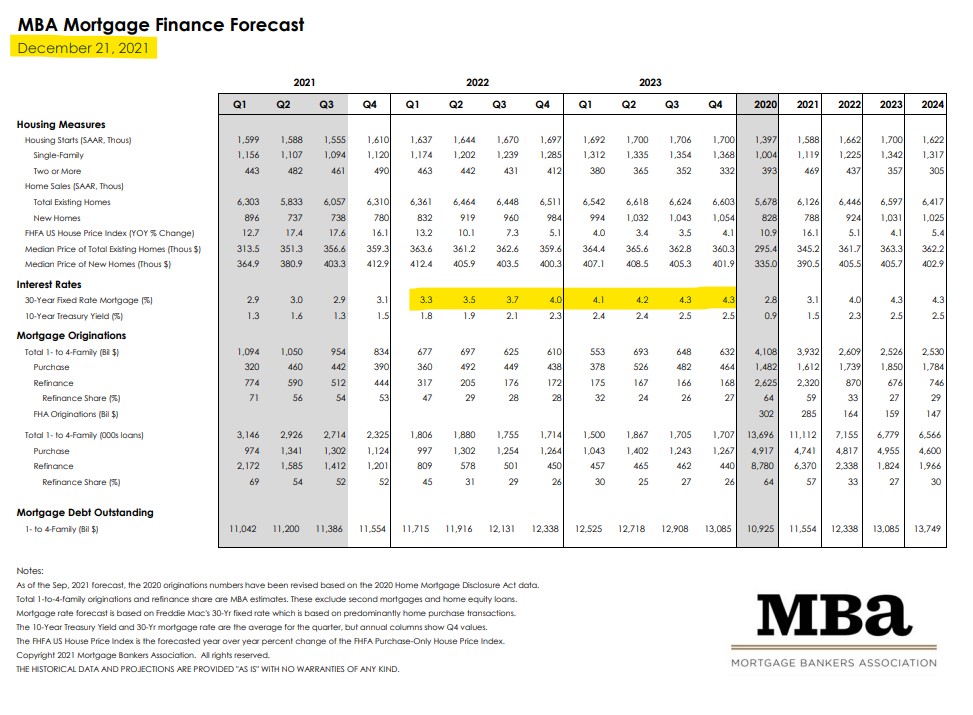
If rates would stay around 5% over the next four quarters, the market should digest it and get comfortable with the new era. But how reliable are these experts? After all, they are the mortgage business – shouldn’t their forecasts be pretty close? Well, hmm, no: