Ten Best In The West

If you want to stay in the western states when you move and you love exploring the outdoors, here are the best small towns to consider:
https://www.travelandleisure.com/where-to-retire-west-united-states-11686844

If you want to stay in the western states when you move and you love exploring the outdoors, here are the best small towns to consider:
https://www.travelandleisure.com/where-to-retire-west-united-states-11686844
All we need is more talk about nuclear submarines to get mortgage rates to fall into the 5s and fire up a late-summer rally!
When it comes to financial markets and the traders that trade the bonds that move mortgage rates, it was important because it meant the labor market is in weaker shape than previously thought–a good reason to push rates quickly lower today. (Incidentally, many other economic reports suggested weaker labor market conditions last month and the jobs report bucked that trend by coming in higher. In other words, it is now more aligned with what the other data has been indicating.)
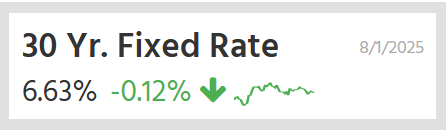
The 30yr fixed rates fell an eighth of a point with the day’s initial rate sheets and some lenders are in the process of offering mid-day improvements this afternoon. This brings our rate index to its lowest levels since early April. By the time lenders are done making their afternoon adjustments, we could be at the lowest levels since mid-October 2024.
https://www.mortgagenewsdaily.com/markets/mortgage-rates-08012025
Due to another glitch in the SDAR MLS, the sales prices are missing the last three numbers on the NSDCAR listings that sold this week (so much for data-sharing!):
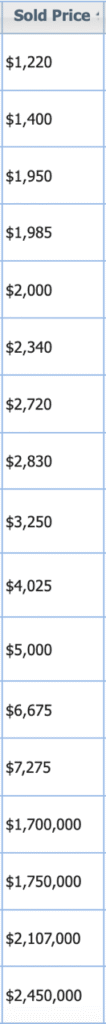
The first 13 are in the sales count, but I took them out of the pricing statistics here:
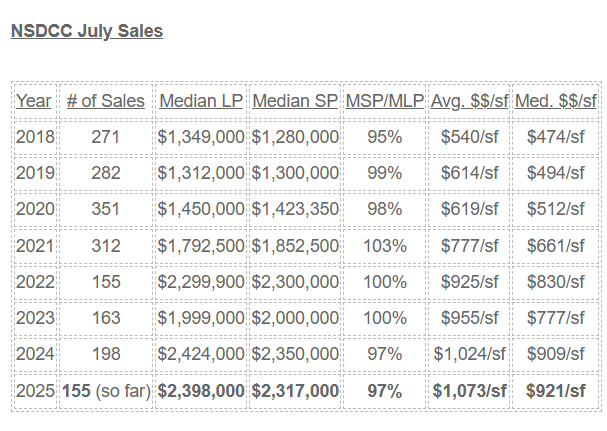
The July sales statistics are impressive!
The sales count will end up around 170-175, which is better than those in 2022-2023, and the pricing is solid.
It’s just getting harder to sell your home when there is more competition. With prices holding up, it suggests that buyers are probably getting more for their money – which they don’t mind!
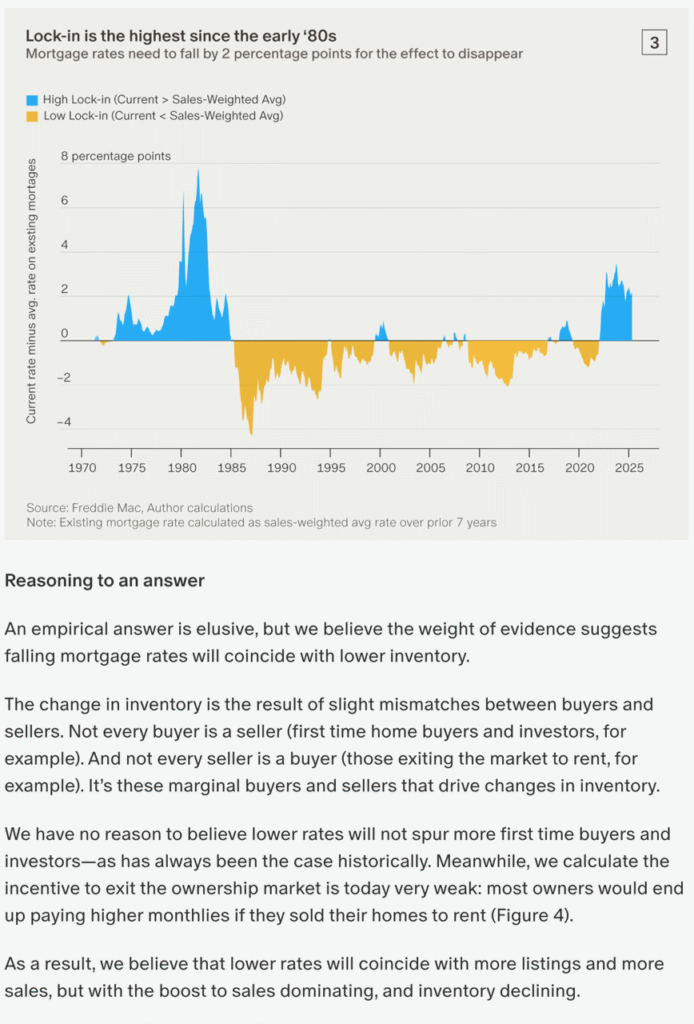
Mike has now teamed up with another guy and both are believing that when (if) mortgage rates come down, it will spur more demand and sales. They are basing this belief on historical trends:
https://home-economics.us/if-mortgage-rates-fall-what-will-happen-to-inventory/
But we haven’t had these market conditions before!
Variables that make a difference:
The authors think that the active inventory will decrease because buyers will be gobbling up everything just because rates are lower. But if rates don’t go down much….or if sellers flood the market early…..or if buyers adopt a wait-and-see attitude….then the 2026 Spring Selling Season could be a dud. Again.

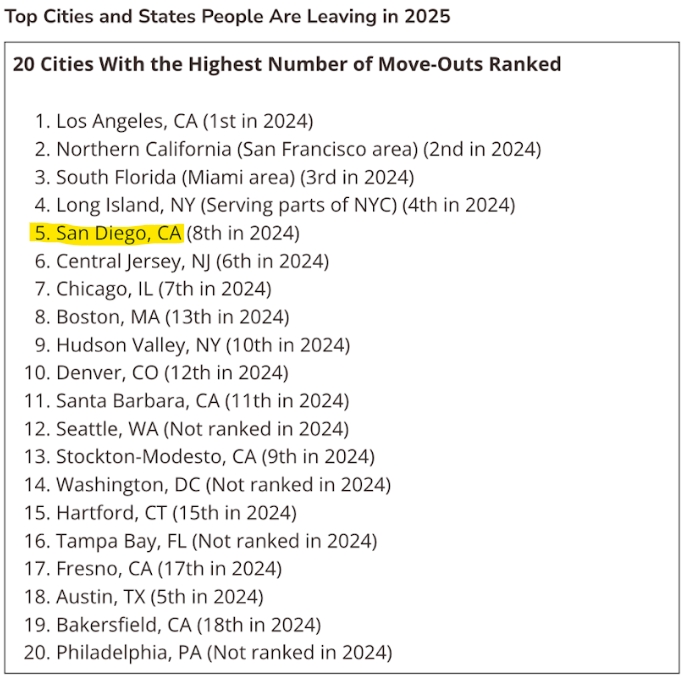
Don’t you want “less congestion, better access to nature, and lower costs of living”?
https://timesofsandiego.com/life/2025/05/20/san-diego-top-location-people-leaving/
A rare advertisement of this blog!
Last week, Stevie and Lindsey both quoted lyrics on their social media from their song, Frozen Love. They were teasing the re-release of their 1973 album Buckingham/Nicks (finally!), and fans went nuts over the possibility of one more tour.
Stevie started this video with Frozen Love lyrics too. The song was written by Lindsey about Stevie in 1987 when he left the band, but it didn’t make it onto a Fleetwood Mac album until 15 years later (Say You Will). It was when Lindsey was on a solo tour in 2005 that Stevie joined him at this stop in Texas:
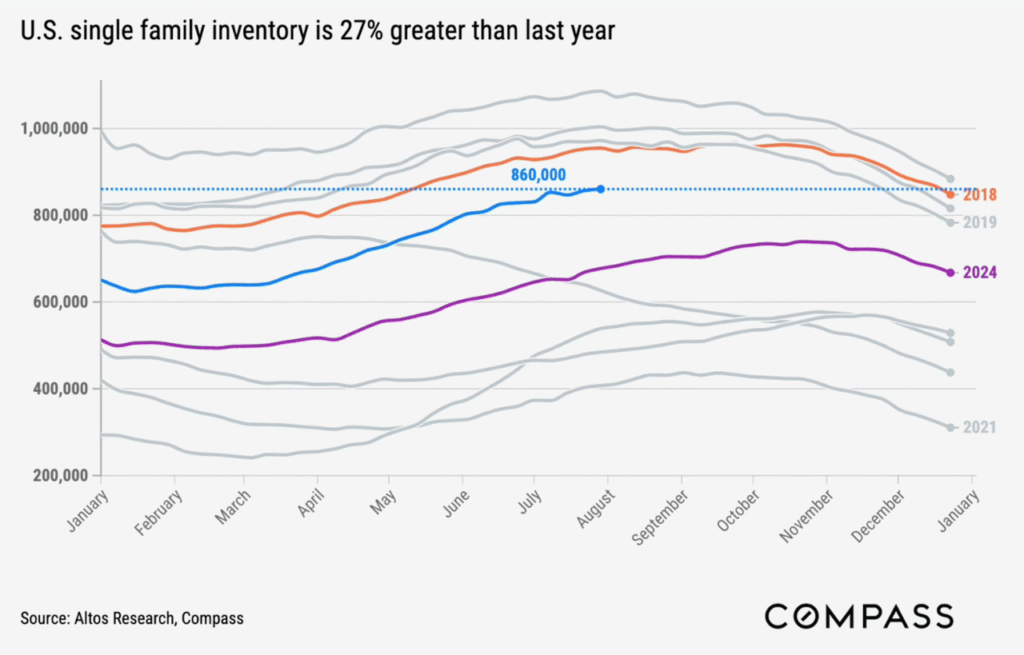
Mike mentions that the current unsold inventory is +37% YoY in California. But sales and pricing are holding up so we’re just getting used to having more active inventory laying around not selling.

A recent report found 27% of all US homes sold in Q1 2025 were purchased by investors – the highest share in at least five years. That number was 18.5% between 2020 and 2023.
However, the number of homes bought is only a 1.2% increase YoY, showing that investors aren’t necessarily buying more homes this year, but there are less traditional buyers in the market and fewer sales overall.
What’s even more interesting is the vast majority of these investors (85%) are mom-and-pops, owning only 1-5 properties! Meanwhile, big investors shows a massive retreat as they sold 76% more properties than they purchased in Q1.
It seems both traditional homebuyers and the large institutional investors are slowing down and these smaller investors are taking advantage of it. After many years of bidding wars and rising prices, it seems now is a better time to purchase an investment property, especially if you’re looking to get a good deal and have the resources to put some work into the home.
Of course these numbers vary by area, so let’s look at California.
According to this article, three states dominate investor ownership, accounting for nearly 25% of all investor homes nationwide: Texas (1.66M), California (1.45M), and Florida (1.21M). However, this is purely according to volume which is unsurprising considering these three states are the most populous. Looking at the percentages, Hawaii and Alaska have higher shares of investor ownership with 39.9% and 35.5% respectively.
This article expands on how California counties with low populations, where second home ownership is more common due to tourism and recreational opportunities, have the highest percentage of investor-owned homes. These include Sierra County, with a whopping 82% of single-family houses owned by investors, Trinity County (77%), Mono County (74%) and Alpine County (68%).
Counties with major cities and more expensive real estate have more modest shares of homes owned by investors: San Diego, Orange County, Los Angeles, Santa Clara, and San Francisco all sit at only 15%.
Takeaway: San Diego real estate isn’t overrun by investors quite yet, but if you’re thinking of buying an investment property out of state where it’s more affordable, you’re not alone.
By Natalie!
San Diego Case-Shiller Index, Non-Seasonally-Adjusted
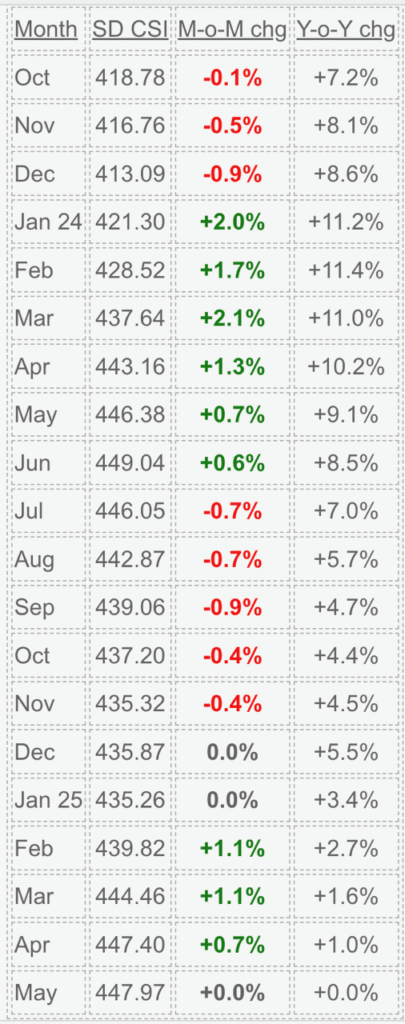
The buyer enthusiasm in 2025 was about half of what it was in 2024.
The May reading is the first double-aught month, with both MoM and YoY logging in zeros, and it sure looks like it will be the peak of the year. Last June was the peak of all-time, and it could hold up if we don’t get a bump next month.
In the last half of 2024, the index lost 3.1%, and we’re probably heading for a similar drop this year – at best. It should set up the same first-quarter mini-frenzy in 2026 that we experienced at the beginning of 2024 and 2025.
“May’s data continued the year’s slow unwind of price momentum, with annual gains narrowing for a fourth consecutive month,” said Nicholas Godec, CFA, CAIA, CIPM, Head of Fixed Income Tradables & Commodities at S&P Dow Jones Indices. “National home prices were just 2.3% higher than a year ago, the smallest increase since July 2023, and nearly all of that gain occurred in the most recent six months. The spring market lifted prices modestly, but not enough to suggest sustained acceleration.”


