I have suspected that consumers rely on their zestimate more than we’d like to admit.
It’s been around for ten years, so it’s familiar and easy. Because there isn’t any other internet tool like it, homeowners follow their zestimate and fantasize about their equity position – and start believing. Zillow sends regular reminders which reinforce that there might be something to it.
When I’m talking to sellers, if my price is different than the zestimate, I better have a good explanation. Likewise, I don’t mind when the zestimate is above my list price. If buyers happen to believe in the zestimate’s accuracy, then it helps make my listing look like a deal.
But the truth is that the zestimate is wildly inaccurate and heavily manipulated by Zillow to suit their own needs – especially in their quest to buy homes from coast to coast.
A good friend has been contemplating the sale of this home in Santa Monica. We have watched the zestimate rise steadily over the years, and once it touched $8,000,000, we thought it would be a good time to put it on the market and hope the zestimate would help propel the sale.
As we prepared to launch the listing, I monitored the zestimate closely:
June 16th Zestimate
The zestimate had gone up $362,339 in the last 30 days, and was well into the $8,000,000s. We planned to list for $6,950,000, which would have looked very attractive, relatively.
The next day, our zestimate got revised.
June 17th Zestimate
Whoa – it dropped $3,284,879 in one day???
We had committed to at least conducting some price discovery, so we listed for $6,950,000 on June 22nd.
What did Zillow do?
They changed the zestimate to the EXACT list price,
They suggested a sales range evenly around the list price
They erased the history of the $3,284,879 drop from five days prior:
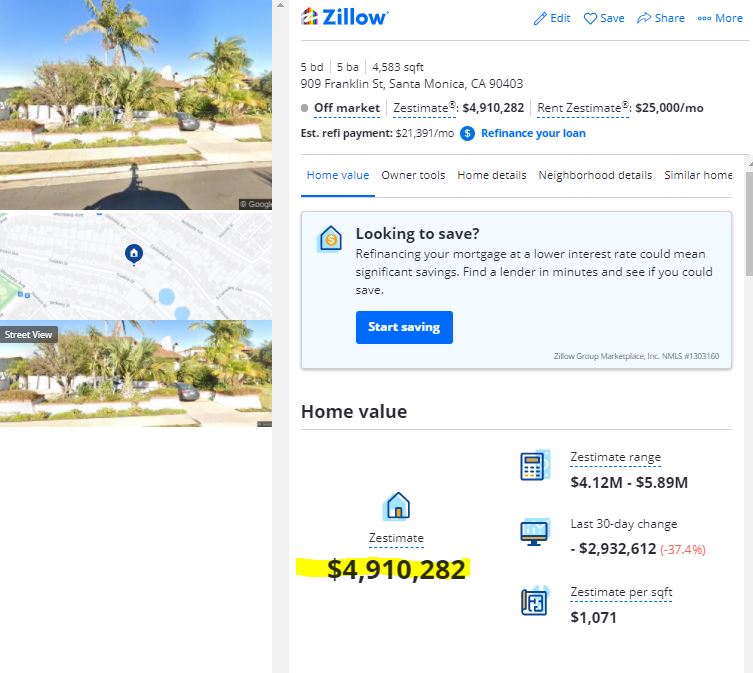
June 22nd Zestimate
The zestimate went from $8,195,161 to $4,910,282 to $6,950,000 in less than a week.
You’d be crazy to trust anything they say.
It was the erasing of the previous drop that is the most disturbing – which they have done for years. If you drop $3 million in one day, then stick with it – don’t recreate history just to make yourself look better.
San Diego has had positive gains straight through the Covid-19 era, and now we have back-to-back months of +3.3% improvements, which has to be about the max the index can go up in a month.
We are right behind Phoenix, whose non-seasonally-adjusted index in April rose 22.3% YoY to our +21.6%.
Let’s go San Diego, we can take them, and be number one in the nation! Maybe next month!
Home prices in April saw an annual gain of 14.6% in April, up from a 13.3% increase in March, according to the S&P CoreLogic Case-Shiller National Home Price Index.
Among larger cities covered by the index, the 10-city composite was up 14.4% year over year, up from 12.9% the previous month. The 20-city composite was 14.9% higher, up from 13.4% in March.
“April’s performance was truly extraordinary. The 14.6% gain in the National Composite is literally the highest reading in more than 30 years of S&P CoreLogic Case-Shiller data,” said Craig Lazzara, managing director and global head of index investment strategy at S&P DJI.
Not only did home prices rise in all 20 cities, but the price gains accelerated in all as well and were in the top quartile of performance historically.
Five cities – Charlotte, Cleveland, Dallas, Denver and Seattle – saw their largest annual gains ever.
“We have previously suggested that the strength in the U.S. housing market is being driven in part by reaction to the COVID pandemic, as potential buyers move from urban apartments to suburban homes. April’s data continue to be consistent with this hypothesis,” added Lazzara.
Price gains have been expanding for the last eleven months, as buyer demand continues to outstrip supply. The inventory of homes for sale rose slightly in May compared with April, but was still 21% lower than May 2020, according to the National Association of Realtors.
Home sales have been falling for the past few months, due both to low supply, especially at the entry level of the market, and very high prices. Single-family housing starts have also slipped, as homebuilders try to keep up with a heavy backlog of demand amid high prices for land, labor and materials.
There has been growing talk of a price bubble in the housing market, but the fundamentals of today’s market say otherwise.
“Although home price growth is reaching new highs, the risk of price declines has fallen far below pre-pandemic and summer 2006 levels, when homes prices last peaked. This is likely because favorable mortgage rates and income growth continue to keep the ratio of mortgage payments to monthly household income much lower today,” said Selma Hepp, deputy chief economist at CoreLogic.
“Consequently, elevated buyer demand, coupled with lacking for-sale inventories, will continue putting pressure on prices — which are likely to remain at double-digit increases through the third quarter of 2020,” she added.
There is, however, a growing divide between the haves and have-nots in housing.
Sales activity is gaining dramatically on the higher end of the market but falling on the low end as more buyers are priced out. Some blame the Federal Reserve for keeping mortgage rates artificially low, through its bond-buying program. Record low rates last year helped juice the homebuying boom, but those rates, now slightly higher, cannot offset the huge price gains.
“So much for the Fed’s all-inclusive monetary policy where lower income people now can’t afford housing,” wrote Peter Boockvar, chief investment officer at Bleakley Advisory Group.
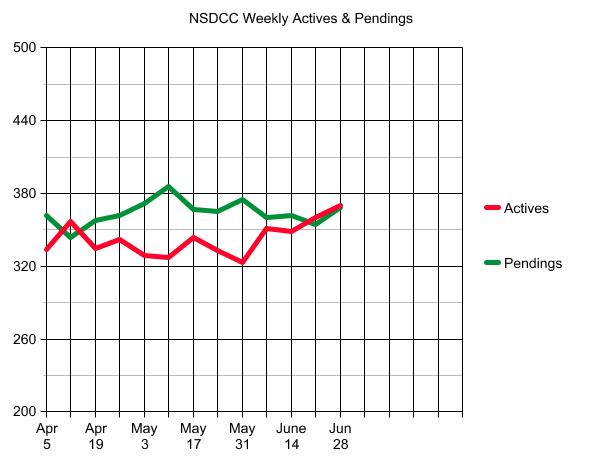
Statistically, the frenzy should continue to be impressive – it’s been red-hot for so long that it could cool off 25% and still be a vibrant marketplace. It will depend on the flow of homes coming to market, which we’ve had an uptick over the last two weeks – and the pendings have surged right with them (see above).
A few ways to generate some extra dough with your home. Seen in the lat:
You can earn semi-passive income by renting out all or part of your personal residence.
Let’s say you list your house to rent while you take a two-week vacation. If you list on Airbnb or VRBO, you can charge a nightly rate plus a cleaning fee. Airbnb will deduct a commission to compensate itself for advertising your rental and collecting payment. If you rent out your house for $250 a night after Airbnb costs, that’s $3,500. This is semi-passive income since there is a bit of work involved. You need to take photos of your home, list it on a website, respond to potential renters and arrange to have housekeepers do the cleaning. All told, that’s likely to take an hour or two per rental.
And you can rent to movie producers and event planners through Giggster, Peerspace and Splacer, among others. These sites encourage you to charge by the hour, which can enable you to earn four to five times what you’d get with Airbnb or VRBO. But there are unique risks with having movie productions and events at your home. Be sure to collect a deposit for potential damage and consult your insurance agent.
If you don’t want to rent out your house but are OK with letting people use your swimming pool, you can sign up with Swimply. The same cautions apply.
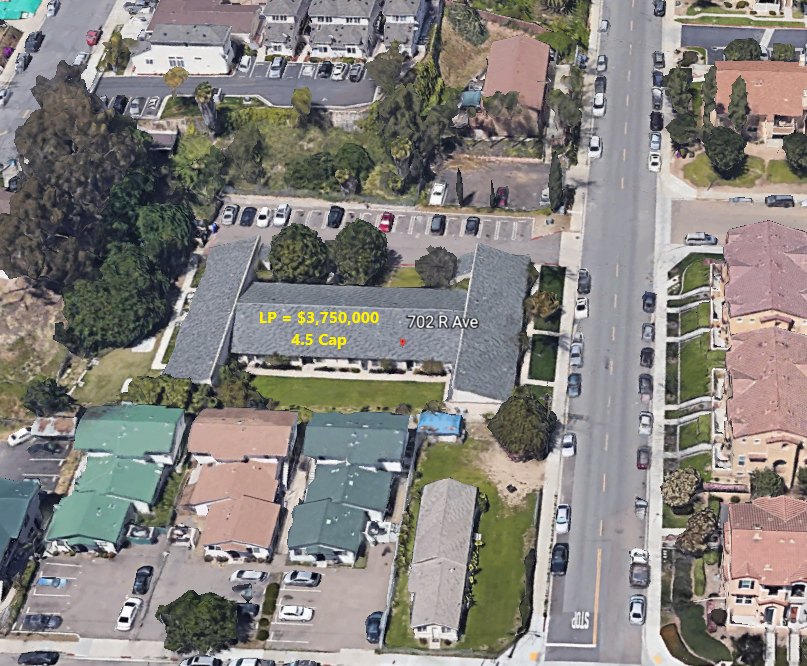
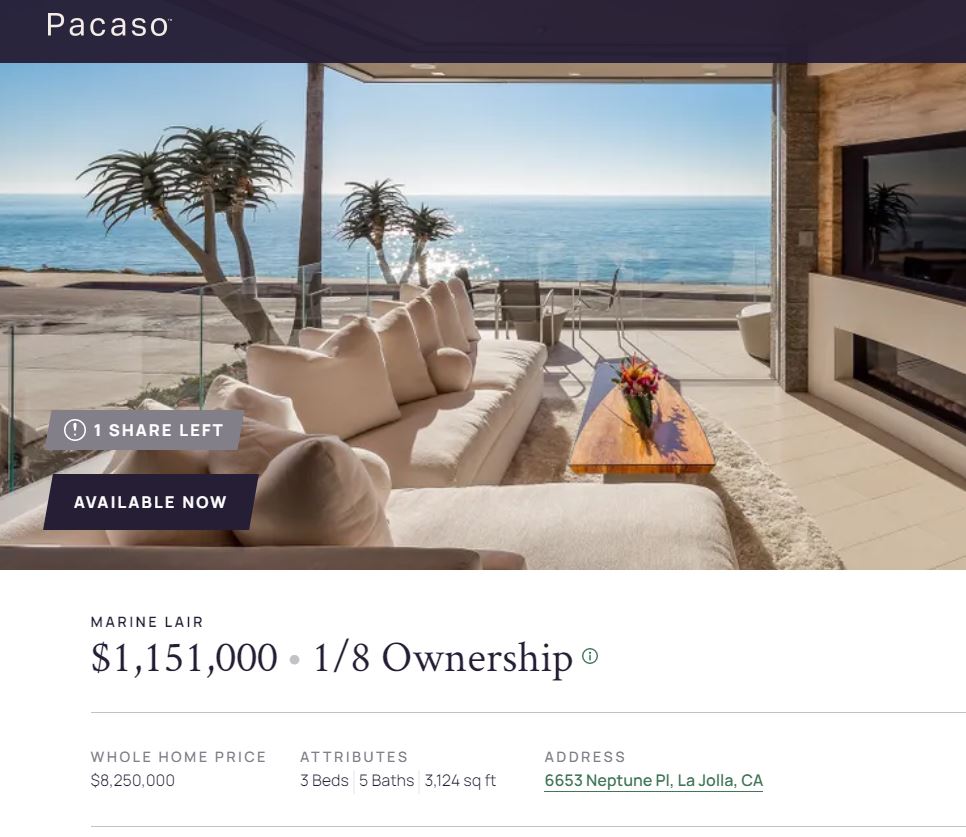
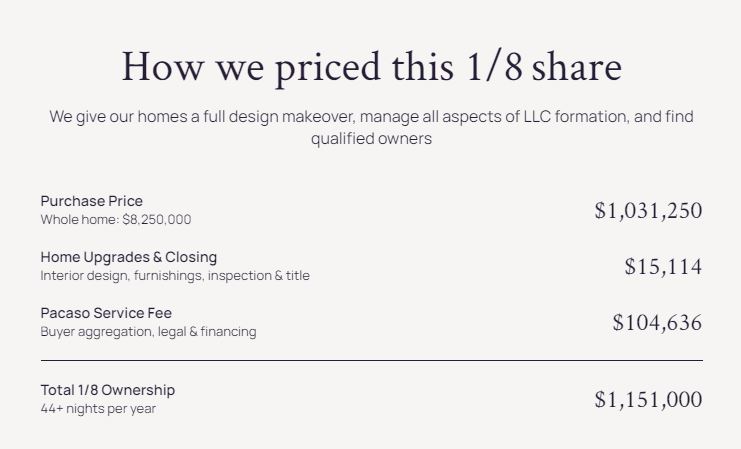
Here’s a local sample of the new whiz-bang partial ownership craze.
The spec builder tried to sell this for three years before taking this $8.25M cash deal. The same seller/Compass agent has the listing now, on behalf of the new owners:
ABOUT THIS HOME
This is multi-tasking, La Jolla style: Catch the perfect sunset as you splash in the ocean waves or sip a cool drink in the rooftop saltwater pool. The surf breaks just steps from this 3-bedroom, 4½ bath custom home.
Everything is designed to make the most of the Pacific views. Vanishing window walls transform indoor spaces into open-air living at its finest. The open plan living space has a gas fireplace and a sleek kitchen with a curved island and a space for formal dining.
Exotic materials and touchable textures are used throughout the home, including a back-lit Brazilian granite steam room.
The master suite has a luxurious ensuite with double sinks, soaking tub and walk-in shower. A vanishing window wall opens to a private balcony and stunning ocean views.
Enjoy the rooftop infinity pool area with its 8-person spa and adjoining lounge area with wet bar. Restock the bar from the home’s wine room. And when you’re ready to leave this Pacific paradise, there’s a hydraulic driveway and a turntable garage floor that ensures you always leave facing the ocean.
The home comes turnkey, fully furnished and professionally decorated.
Trustindex verifies that the original source of the review is Google.
We sold a home with Jim and Donna and from beginning to end they were consummate professionals. Their initial walk through the property resulted in a list of items to be repaired or updated. They supplied a list of vendors and job quotes to do the repairs and updates. We originally wanted to sell ‘as is’ and just get it over with. They gave us a selling price for ‘as is’ and options for doing a few updates/repairs to doing it all with the selling price for each option. We agreed to do all they suggested and we sold for the exact price they predicted. For every dollar spent we got back more than $2 back in the selling price. And they got that price in a rising interest rate environment! Donna and Jim are extremely detailed and guide you through ever aspect of the sale. There were no surprises thanks to their guidance. We couldn’t be more pleased with their representation.
Thank you Donna and Jim,
Jerry and Mary
Heather Quejada
March 27, 2025
Trustindex verifies that the original source of the review is Google.
We have known Jim & Donna Klinge for over a dozen years, having met them in Carlsbad where our children went to the same school. As long time North County residents, it was a no- brainer for us to have the Klinges be our eyes and ears for San Diego real estate in general and North County in particular. As my military career caused our family to move all over the country and overseas to Asia, Europe and the Pacific, we trusted Jim and Donna to help keep our house in Carlsbad rented with reliable and respectful tenants for over 10 years.
Naturally, when the time came to sell our beloved Carlsbad home to pursue a rural lifestyle in retirement out of California, we could think of no better team to represent us than Jim and Donna. They immediately went to work to update our house built in 2004 to current-day standards and trends — in 2 short months they transformed it into a literal modern-day masterpiece. We trusted their judgement implicitly and followed 100% of their recommended changes. When our house finally came on the market, there was a blizzard of serious interest, we had multiple offers by the third day and it sold in just 5 days after a frenzied bidding war for 20% above our asking price! The investment we made in upgrades recommended by Jim and Donna yielded a 4-fold return, in the process setting a new high water mark for a house sold in our community.
In our view, there are no better real estate professionals in all of San Diego than Jim and Donna Klinge. Buying or selling, you must run and beg Jim and Donna Klinge to represent you! Our family will never forget Jim, Donna, and their whole team at Compass — we are forever grateful to them.
Lou F
March 27, 2025
Trustindex verifies that the original source of the review is Google.
WeI had the pleasure of working with Klinge Realty Group to sell our home in Carmel Valley, and I cannot recommend them highly enough!
Jim and Donna demonstrated exceptional professionalism, offering expert guidance on market conditions and pricing strategy, which resulted in a quick and successful sale.
Communication was prompt and we were well-informed throughout the entire process.
For anyone looking for a dedicated and knowledgeable real estate team, look no further!
---
William Sams
March 25, 2025
Trustindex verifies that the original source of the review is Google.
Donna and Jim Klinge of Klinge Realty Group have our highest possible recommendation. From Donna and Jim’s first visit to our house through closing their advice and counsel was candid and honest in all dealings. They kept us fully informed throughout the process. The house sold less than three days after listing with a two-week closing. My wife and I have sold several houses during our lives. This was by far the best experience. Klinge Reality is a premium service realtor. You can’t make a better choice for someone to sell your home fast and for top dollar.
Emily Hernandez
December 29, 2024
Trustindex verifies that the original source of the review is Google.
Donna and Jim provided exceptional support and professionalism throughout the entire process. We couldn't have been happier with their efforts. They made our house shine, and thanks to their expertise, it sold above the listing price in the very first weekend! Truly a fantastic experience from start to finish.
Jesus Adrian Sahagun
November 11, 2024
Trustindex verifies that the original source of the review is Google.
This year has been difficult on our family, mainly due to having to sell our home. Thankfully we knew God had a plan for us and working with the Klinge team was a key part of it. It was an obvious decision to work with them again after such an amazing experience when purchasing the same home we needed to sell. The challenge was, how will we do this in so little time with so much going on? Jim and Donna held our hand every step of the way. Whenever an unexpected issue arose they found and provided a solution. Never once did we feel pressured to make a decision and the Klinges were always reassuring after providing the information that the decision was ours to make. Despite the curve balls, they never panicked and exemplified the “can do” attitude, making us feel optimistic and taken care of. Their expertise and professionalism was superb. But of all the reasons to work with the Klinges, the most impactful and valuable is their compassion and genuine care for their clients. We pray that we can one day purchase our forever home and you better believe that Jim and Donna will be representing us - as long as they will have us of course. Thank you again Klinge team! Your execution, experience, and care are unmatched.
SABIHA PASHA
July 23, 2024
Trustindex verifies that the original source of the review is Google.
Jim and Donna were fantastic! Jim understanding my needs, recommending potential places, pointing out the pros and cons of each property was invaluable. Then when the offer was accepted Donna’s organized guidance through the inspections, paperwork etc made the whole process seem effortless.
So grateful that I had them on my side!
Anu Koberg
July 13, 2024
Trustindex verifies that the original source of the review is Google.
We first found Jim through his blog at bubbleinfo.com, which really showcased his knowledge of SoCal real estate. Since then we've done three transactions with Jim and Donna, and they are an incredible full service agency, with Jim's deep market insight and Donna's deft contract and project management. We trust them implicitly in their analysis and strategy, which is based on years of experience. They're always available and on top of things, and we strongly recommend them to anyone.
Bjorn Isachsen
July 10, 2024
Trustindex verifies that the original source of the review is Google.
The Good
The Klinge Realty Group operates like a finely tuned machine, with a very personal touch. We contacted them on a Sunday and they were talking to us about our family and our needs on our living room couch the following day. They carefully listened to us and worked with us to identify the best and quickest path to listing within 2 weeks to take advantage of the low inventory conditions in our South Carlsbad neighborhood. They knew our tract specifically and had many previous sales there over the years - they came prepared with a thorough analysis of comparative sales and recommended a pricing strategy that they felt confident would yield offers the first weekend on the market.
The Great
Over the next two weeks Donna coordinated a range of vendors who she knew from experience could get the preparation to list work we needed done on time and with high quality. Our light tune-up involved excellent experiences with their stagers, landscapers, contractors, electricians, and plumbers. Throughout this period Donna's daily communication was clear, concise, and responsive. Any time we had questions Donna picked up the phone or texted immediately - but almost always, she answered our questions before we even knew we had them.
The Outstanding
We had a tricky situation with a shared fence that could have delayed our escrow. Donna used superb mediation skills to negotiate the terms of replacement and was personally on site with the fence contractor to make sure everything went smoothly. The fence looks great and escrow closed on time.
The Truly Exceptional
Our house came on the market on a Wednesday and between then and Monday morning Jim was personally at all three open houses. He was in constant communication explaining potential buyer reaction and strength. As he predicted offers began to come in on Saturday and each one was incrementally higher than the last. At the end we had 5 offers, 4 of which were over list, and the final accepted offer was $100,000 over list. In addition to being over list it included rent back terms that met our needs.
The Recommendation
For all of these reasons we would strongly recommend The Klinge Team to anyone wanting to sell in North County Coastal San Diego. I had been reading Jim's bubbleinfo.com blog for 15 years and knew when the time came to sell that he would be our first call. Jim Klinge is not your standard realtor. He is keenly aware of market conditions and sales strategies. And, works his tail off - though not as hard as Donna . At this point he's gone from realtor to friend and I plan to have him over to grill and chill at our new place to talk real estate, but also just about life and raising kids in San Diego. He's more interested in relationships than his sales numbers - and that's why his sales numbers are so high. We have already recommended the Klinge's to some close friends and another successful sale is on deck right around the corner...
Chris Shea
June 21, 2024
Trustindex verifies that the original source of the review is Google.
We recently had the pleasure of working with Jim and Donna from Klinge Realty Group to sell our house, and we couldn't be more satisfied with the experience. From the initial meeting, they listened attentively to our needs and provided invaluable guidance on specific improvements to get our home market ready.
Their responsiveness throughout the entire process was truly impressive. Anytime we had questions or concerns, they were quick to address them, ensuring we felt comfortable and informed every step of the way. What stood out the most was their team and extensive network of tradespeople, which made addressing any necessary repairs or updates seamless and stress-free.
Thanks to their expertise and dedication, our house sold quickly and at a great price. We highly recommend Jim and Donna to anyone looking to buy or sell a home. They are a fantastic team who truly care about their clients and deliver exceptional results.