I’ve been hoping to promote the best areas in nearby states for readers to consider for relocations, and have wanted to feature lower-priced homes in order to make the move really worth it.
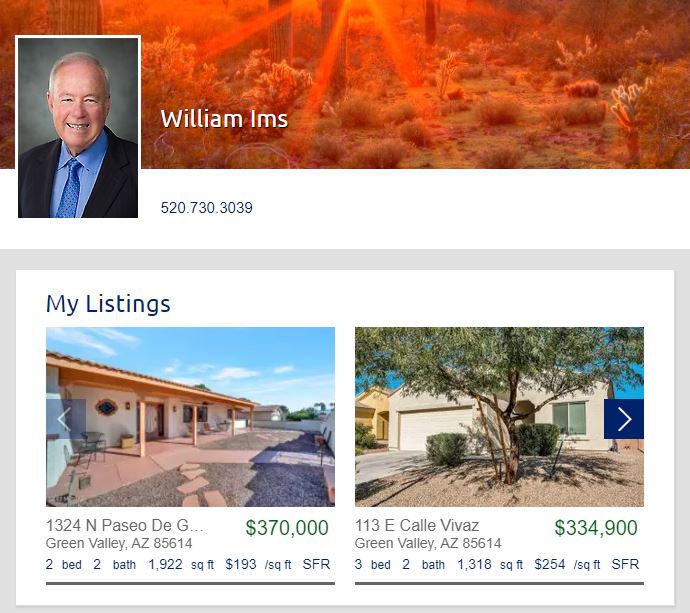
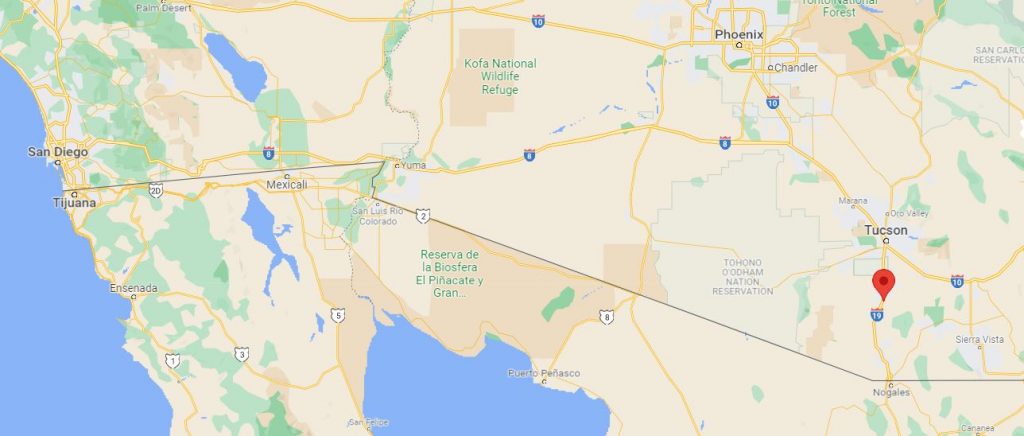
Yesterday I spoke with Bill Ims, a former Carlsbad realtor and probably the nicest guy in the business. He and his wife moved to Green Valley, Arizona, and love it!
He has been selling homes there, and his latest listing is on the golf course for only $370,000!
Check out our new listing that is priced at $251/sf!
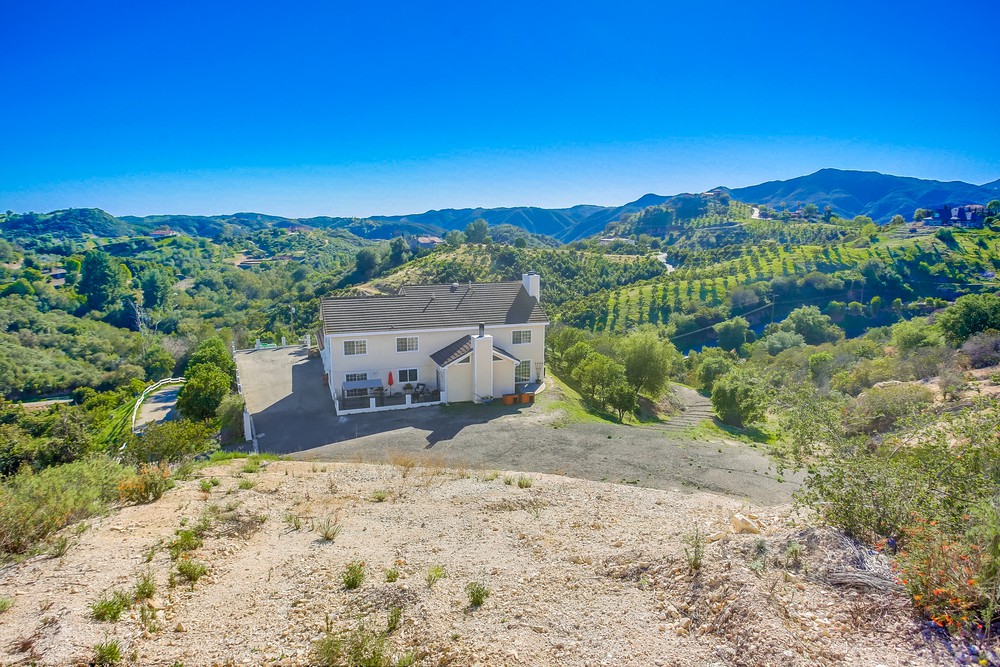
39221 Daily Rd., Fallbrook, CA 92028
4 br + den/2.5 ba, 3,963sf
YB: 1991
5.14 acres
LP = $995,000
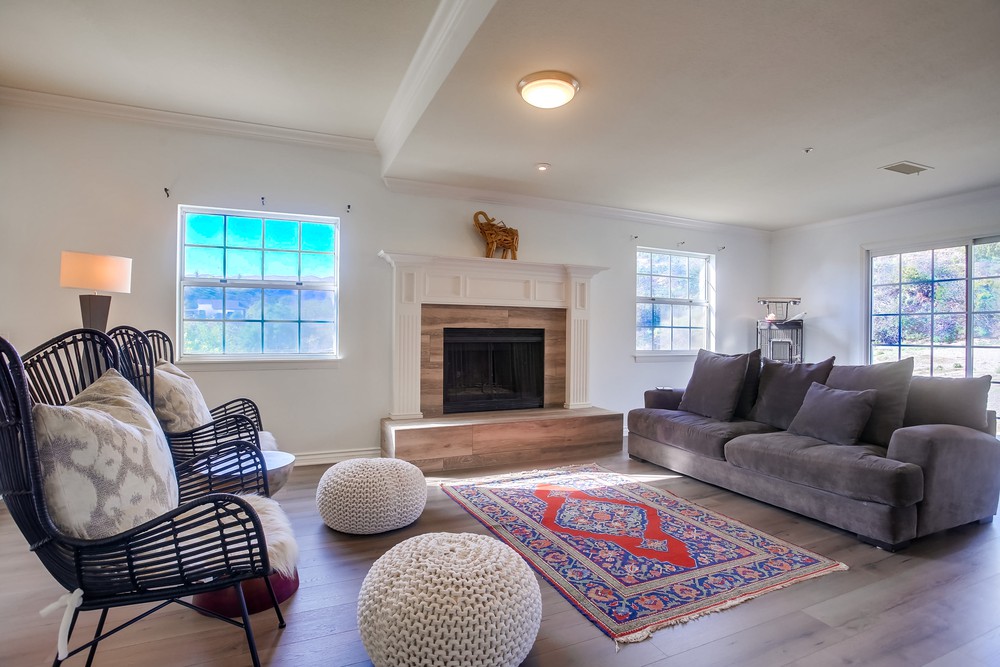
The perfect home of the future – get out of the rat race and enjoy fine country living in this gorgeous home bathed in natural light with panoramic views in every direction! Huge bedrooms, walk-in closets, hardwood floors, 2 fireplaces, and gourmet kitchen with chef’s island and extra-large pantry. Valencia orange trees and lemons too. For those working from home, it has exceptional internet access! Thinking of buying a home for your kids or an ideal rental property? This could be for you! Bring the RVs, toys, trailers, etc.
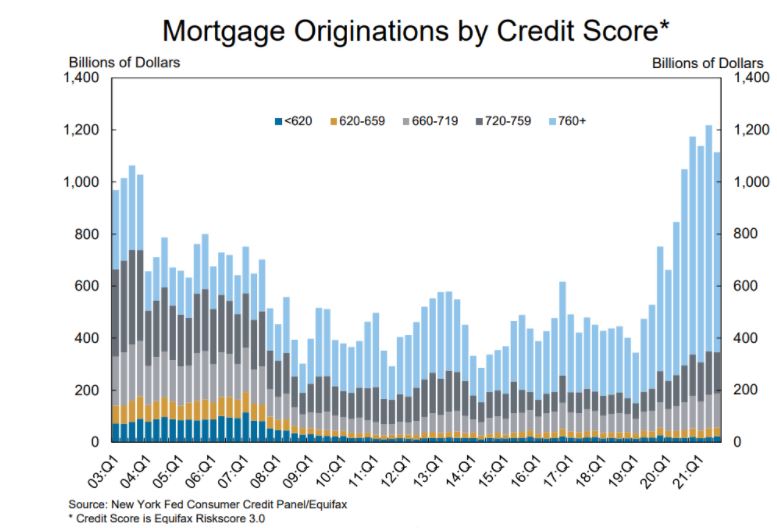
If there is anyone left who thinks the bubble will burst and prices will come down substantially, let’s note that it would take a multitude of people with excellent credit scores and what was once a big down payment to give those up. The vast majority of today’s buyers have outstanding credit – it would take a disaster for them to walk away.
Agents used to tout how great their buyer’s credit score was – but today it’s expected.
We don’t need alternative financing any more. Those who don’t qualify are left out of the game instead.
Worried about wildfire exposure and frustrated by state regulations, insurers in California have been cutting back on their homeowner businesses. Now, affluent homeowners are feeling more of the pain, as two of the biggest firms offering protection for multimillion-dollar properties end coverage for some customers.
As early as this month, American International Group Inc. will begin notifying about 9,000 customers in its Private Client Group that their home policies won’t be renewed this year. The change is part of a plan by AIG to cease selling home policies in California through a unit regulated by the state’s insurance department.
AIG told insurance brokers in an email late last year that some policyholders instead may be eligible for coverage via another AIG unit. The other unit operates alongside other so-called excess-and-surplus lines insurers, which have more freedom on policies’ rates and terms than do insurers in the broader, tightly overseen home-insurance market.
The policies could cost three to five times what AIG’s clients now pay, with less-generous coverage, brokers said.
“AIG is the first high-net-worth carrier to say ‘we’ve had it, we’re divorcing ourselves from California’s regulated market,’ ” said Jim Tolliver, an insurance broker in San Francisco with Woodruff Sawyer & Co., who fears others will follow suit.
Chubb Ltd. the biggest high-end insurer in the state, is continuing to non-renew some policies. But, “we are still accepting new customers across the state in areas where we have a fair chance of earning an adequate return,” Paul Krump, a Chubb vice chairman, said last week.
In an earnings call in October, Chubb Chief Executive Evan Greenberg said the insurer’s California shrinkage was “not a small amount” in locations “both highly exposed and even moderately exposed to wildfire.” He said “someone else will have the pleasure of writing” business for which “we cannot charge an adequate price for the risk.”
Chubb, which declined to provide policyholder figures, aims to offer excess-and-surplus policies to many policyholders who aren’t renewed.
The moves by AIG and Chubb follow years of non-renewals by mass-market insurers. California regulators have been encouraged that parts of the broader market are showing signs of stabilizing, thanks to recent rate increases. Allstate Corp. , Farmers Insurance and some others have committed to adding policyholders.
Some insurers are frustrated that California regulators require them to set home-insurance rates based on their historical loss experience, not projections of future losses that are determined by catastrophe modeling. Such models can reflect detailed, location-specific data that the insurers feel they need amid escalating wildfire activity tied partly to climate change.
Jerry Ryan asked our insurance expert, Suzanne Canfield, for her thoughts:
If your home is near any sort of brush, forget about finding insurance with a preferred-market carrier. The areas affected in San Diego are Rancho Santa Fe, Carmel Valley, Fallbrook, Escondido, La Mesa, Alpine etc. The Los Angeles area is extremely difficult. I work for an independent brokerage firm and almost all of our preferred markets will deny writing business in such areas. I have to refer many markets to State Farm who continues to write homes in these areas until they are too saturated. Or the other options is finding a non admitted insurance solution who’s rates and filings are not implemented by the state, coverage is lacking and premiums are much higher. If you cannot get a quote form a non admitted carrier, the CA Fair Plan is the last resort and they are capped at a total insurance value of only $3 million.
How about people that have property next to canyons?
Don’t be surprised if they receive a notice of non-renewal due to a change in underwriting that the company has taken to mitigate fire losses on that particular area. Many of clients are either being non-renewed for this very reason or the company is choosing to pull out of CA completely. These companies are AIG which specializes in insuring million dollar homes and Nationwide Private Client. AIG and CHUBB insure many celebrities in the Hollywood hills and throughout LA. Trust me, insurance companies don’t have favorites either. Word is that Oprah’s home is getting non-renewed by either CHUBB or AIG.
Is there a map on “highly impacted fire areas” similar to flood plains?
Not that I am aware of. Nowadays companies use google maps and other tools to view homes. And if there are any adjacent canyons or open space, they consider it a fire prone are.
Can new owners in affected areas get fire insurance?
Yes through the CA Fair Plan. The CAFP only covers the home for Fire and Vandalism. Whereas a typical homeowners policy includes liability and water damage. In conjunction with the CAFP policy, homeowners must purchase what’s called a wrap around policy or difference in conditions policy to supplement it.
How much are premiums rising, with rising home equity?
Premiums are rising based on where you live. If you live in an area near brush, expect your premium to rise at minimum 10% but more often I see 20% and I have seem premiums double. Insurance companies choose to take more and more rate to make up for all of the wildfire claims paid out over the last several years. And it’s going to continue to get worse before it gets better.
Need insurance? Contact Suzanne at: suzanne.canfield@hubinternational.com
One sign isn’t going to change the world, but it’s an example of how home sales will be changing in the future. If/when homes are sold in-house (not exposed to outside brokers and buyers) like commercial properties, Compass should extend its dominance in San Diego County – especially north coastal.
I can’t control how this turns out; I can only roll with it!
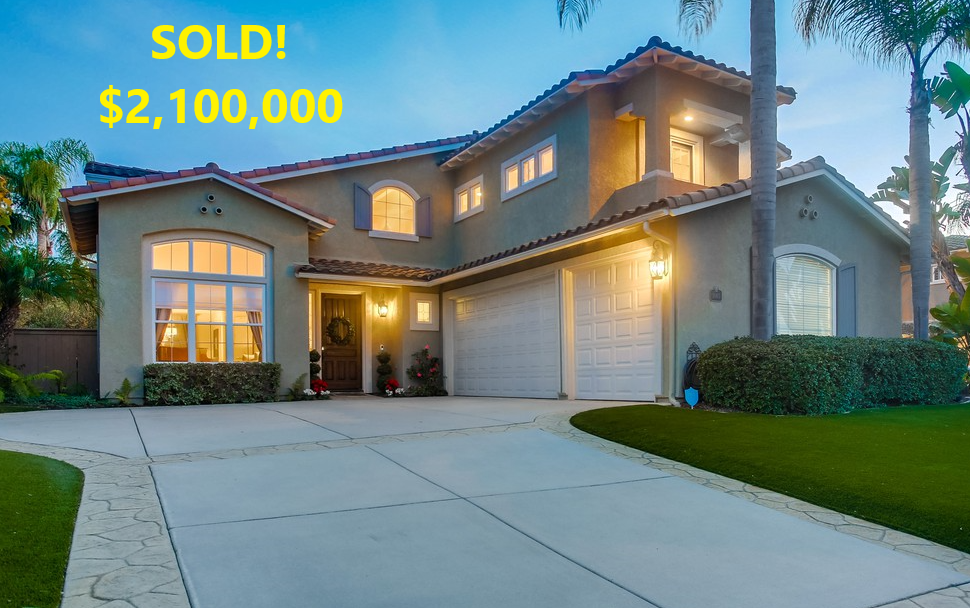
This is the house I featured here when it went on the market on January 12th. It was a little early for the usual selling season but the market has been so hot over the last three months that we dove right in.
The numbers:
Model-match sale across the street in May: $1,450,000 (the list price was $1,299,000)
Realtor.com estimate of my listing: $1,531,100
Zestimate: $1,549,500
Our list price: $1,795,000
Five offers: between $1,800,000 and $1,950,000
Other agents would have grabbed the $1,950,000 and been happy. It was a half-million over the comp!
But I was just getting started. I encouraged every bidder to raise their offer by sending each of them a written counter asking for their highest-and-best offer.
The key point?
The winner who paid $2,100,000 was the buyer who made the lowest offer originally.
In 2021, the practice of countering buyers for their highest-and-best offer went by the wayside. If listing agents do counter, the latest practice is to only counter the top 2-3 offers and ignore the rest.
If I would have done that on this listing, I would have left $150,000 on the table! When the sixth offer arrived late, I still gave them ample opportunity to bid higher too.
When you get multiple offers, you want me in your corner.
Are you thinking of selling? Contact me at 858-997-3801, or klingerealty@gmail.com.
This guy has been drunk on the doom juice for so long that he must never get out of his bunker!
If he did, he would see the overwhelming demand for every new listing, even though underwriting standards are strict and rates are going up. Of the 140 NSDCC sales last month, 36% were all-cash.
Trustindex verifies that the original source of the review is Google.
Jim & Donna Klinge helped us sell our home of 30 years in Ocean Hills. We were very happy with their service and would HIGHLY recommend them to anyone looking for an Honest, Knowledgeable, Skilled, Informed Efficient realty team. Both Jim & Donna were so helpful in different ways and complemented each others skills. Please refer to a more detailed review that we wrote on YELP. Thank You Both for all your help!!!
Jesse O'Hara
June 12, 2025
Trustindex verifies that the original source of the review is Google.
A+ thank you
Lisa Tuomi
June 11, 2025
Trustindex verifies that the original source of the review is Google.
Many years ago, we purchased a home in Carlsbad, using a realtor that was recommended to us - Jim Klinge. Fast forward to 2025, we recently had the privilege of selling 2 homes in Carlsbad, CA and didn't hesitate to reach out to Jim and Donna Klinge of Klinge Realty Group to guide us through the sales. The transactions were very different, each with its own unique situation, opportunities and challenges. From start to finish, Donna and Jim helped navigate the pre-sale preparation, the listing, showing of the house, buyer negotiations, the final close and all of the paperwork and decisions in between. What stands out with both transactions is the professionalism of Jim and Donna (and their team), wonderful communication (timely, relevant, concise), their deep understanding of market dynamics (setting realistic expectations), their access to top-notch contractors, and last, their ability to guide us across the finish line successfully. We wouldn't hesitate to use Jim and Donna in the future and highly recommend them for anyone looking to buy or sell a property in North San Diego County.
Jerry Meyer
March 28, 2025
Trustindex verifies that the original source of the review is Google.
We sold a home with Jim and Donna and from beginning to end they were consummate professionals. Their initial walk through the property resulted in a list of items to be repaired or updated. They supplied a list of vendors and job quotes to do the repairs and updates. We originally wanted to sell ‘as is’ and just get it over with. They gave us a selling price for ‘as is’ and options for doing a few updates/repairs to doing it all with the selling price for each option. We agreed to do all they suggested and we sold for the exact price they predicted. For every dollar spent we got back more than $2 back in the selling price. And they got that price in a rising interest rate environment! Donna and Jim are extremely detailed and guide you through ever aspect of the sale. There were no surprises thanks to their guidance. We couldn’t be more pleased with their representation.
Thank you Donna and Jim,
Jerry and Mary
Heather Quejada
March 27, 2025
Trustindex verifies that the original source of the review is Google.
We have known Jim & Donna Klinge for over a dozen years, having met them in Carlsbad where our children went to the same school. As long time North County residents, it was a no- brainer for us to have the Klinges be our eyes and ears for San Diego real estate in general and North County in particular. As my military career caused our family to move all over the country and overseas to Asia, Europe and the Pacific, we trusted Jim and Donna to help keep our house in Carlsbad rented with reliable and respectful tenants for over 10 years.
Naturally, when the time came to sell our beloved Carlsbad home to pursue a rural lifestyle in retirement out of California, we could think of no better team to represent us than Jim and Donna. They immediately went to work to update our house built in 2004 to current-day standards and trends — in 2 short months they transformed it into a literal modern-day masterpiece. We trusted their judgement implicitly and followed 100% of their recommended changes. When our house finally came on the market, there was a blizzard of serious interest, we had multiple offers by the third day and it sold in just 5 days after a frenzied bidding war for 20% above our asking price! The investment we made in upgrades recommended by Jim and Donna yielded a 4-fold return, in the process setting a new high water mark for a house sold in our community.
In our view, there are no better real estate professionals in all of San Diego than Jim and Donna Klinge. Buying or selling, you must run and beg Jim and Donna Klinge to represent you! Our family will never forget Jim, Donna, and their whole team at Compass — we are forever grateful to them.
Lou F
March 27, 2025
Trustindex verifies that the original source of the review is Google.
WeI had the pleasure of working with Klinge Realty Group to sell our home in Carmel Valley, and I cannot recommend them highly enough!
Jim and Donna demonstrated exceptional professionalism, offering expert guidance on market conditions and pricing strategy, which resulted in a quick and successful sale.
Communication was prompt and we were well-informed throughout the entire process.
For anyone looking for a dedicated and knowledgeable real estate team, look no further!
---
William Sams
March 25, 2025
Trustindex verifies that the original source of the review is Google.
Donna and Jim Klinge of Klinge Realty Group have our highest possible recommendation. From Donna and Jim’s first visit to our house through closing their advice and counsel was candid and honest in all dealings. They kept us fully informed throughout the process. The house sold less than three days after listing with a two-week closing. My wife and I have sold several houses during our lives. This was by far the best experience. Klinge Reality is a premium service realtor. You can’t make a better choice for someone to sell your home fast and for top dollar.
Emily Hernandez
December 29, 2024
Trustindex verifies that the original source of the review is Google.
Donna and Jim provided exceptional support and professionalism throughout the entire process. We couldn't have been happier with their efforts. They made our house shine, and thanks to their expertise, it sold above the listing price in the very first weekend! Truly a fantastic experience from start to finish.
Jesus Adrian Sahagun
November 11, 2024
Trustindex verifies that the original source of the review is Google.
This year has been difficult on our family, mainly due to having to sell our home. Thankfully we knew God had a plan for us and working with the Klinge team was a key part of it. It was an obvious decision to work with them again after such an amazing experience when purchasing the same home we needed to sell. The challenge was, how will we do this in so little time with so much going on? Jim and Donna held our hand every step of the way. Whenever an unexpected issue arose they found and provided a solution. Never once did we feel pressured to make a decision and the Klinges were always reassuring after providing the information that the decision was ours to make. Despite the curve balls, they never panicked and exemplified the “can do” attitude, making us feel optimistic and taken care of. Their expertise and professionalism was superb. But of all the reasons to work with the Klinges, the most impactful and valuable is their compassion and genuine care for their clients. We pray that we can one day purchase our forever home and you better believe that Jim and Donna will be representing us - as long as they will have us of course. Thank you again Klinge team! Your execution, experience, and care are unmatched.
SABIHA PASHA
July 23, 2024
Trustindex verifies that the original source of the review is Google.
Jim and Donna were fantastic! Jim understanding my needs, recommending potential places, pointing out the pros and cons of each property was invaluable. Then when the offer was accepted Donna’s organized guidance through the inspections, paperwork etc made the whole process seem effortless.
So grateful that I had them on my side!