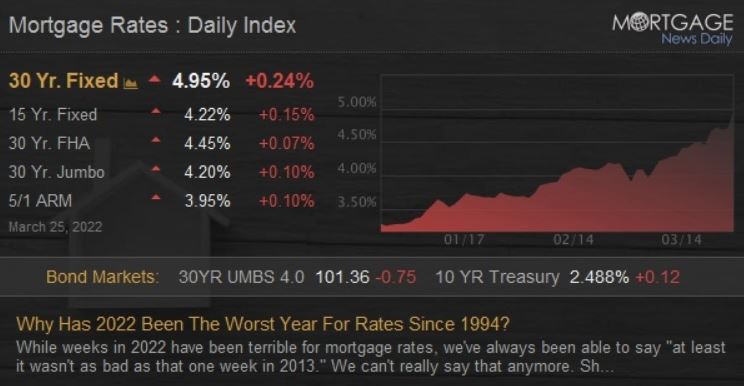
Carmel Valley +13% Over List
My tours of mid-range coastal suburban homes that sold for a big pop over list are slowing. But it’s mostly due to the lack of inventory – I wish I could do more!

My tours of mid-range coastal suburban homes that sold for a big pop over list are slowing. But it’s mostly due to the lack of inventory – I wish I could do more!
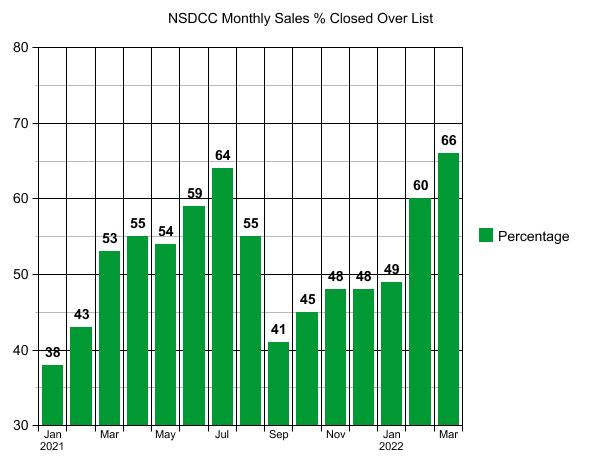
The percentages of sales closed over the list price are higher than in 2021, but will it continue?
NSDCC Monthly Detached-Home Sales, % Closed Over List Price
~~~~~~~~~~~~~~~~~~~~~~~~~~~~~~~~~~~~~~~~~~~~~~~
 ~~~~~~~~~~~~~~~~~~~~~~~~~~~~~~~~~~~~~~~~~~~~~~~
NSDCC Average and Median Prices
| Month | |||||
| Feb | |||||
| March | |||||
| April | |||||
| May | |||||
| June | |||||
| July | |||||
| Aug | |||||
| Sept | |||||
| Oct | |||||
| Nov | |||||
| Dec | |||||
| Jan | |||||
| Feb | |||||
| Mar |
The average sales price went up 7% MoM in January, 9% in February, and 8% in March!
The median sales price went up 4% MoM in January, 7% in February, and 10% in March!
THE MEDIAN SALES PRICE IN MARCH WAS 25% HIGHER THAN IT WAS IN NOVEMBER!
This is the craziest real estate market ever!!
~~~~~~~~~~~~~~~~~~~~~~~~~~~~~~~~~~~~~~
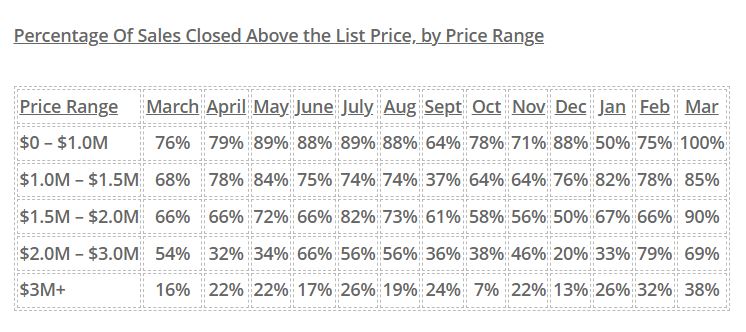
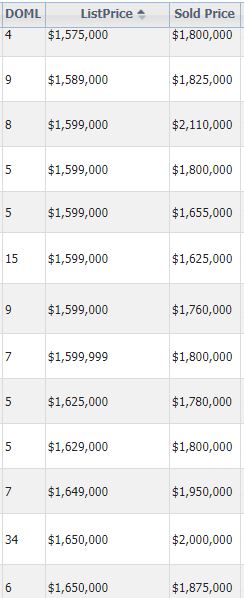
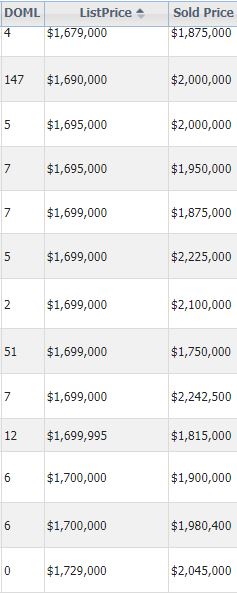
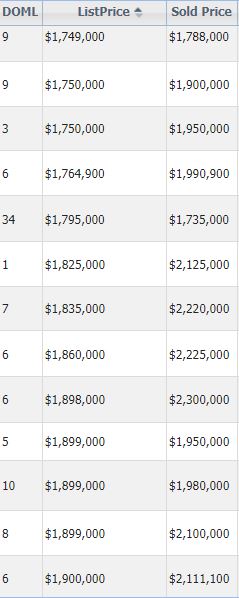
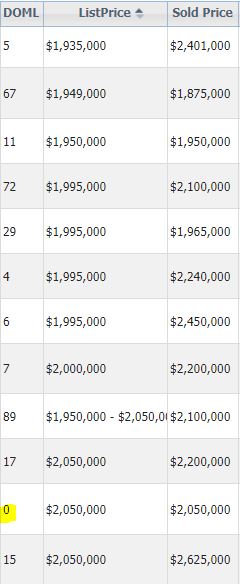
The $1,500,000 – $2,000,000 was the hottest range in March, with 90% of sales closing over the list price.
Here are examples – the average here was 12% over the list price:
Well, the way it’s been going, it was bound to happen!
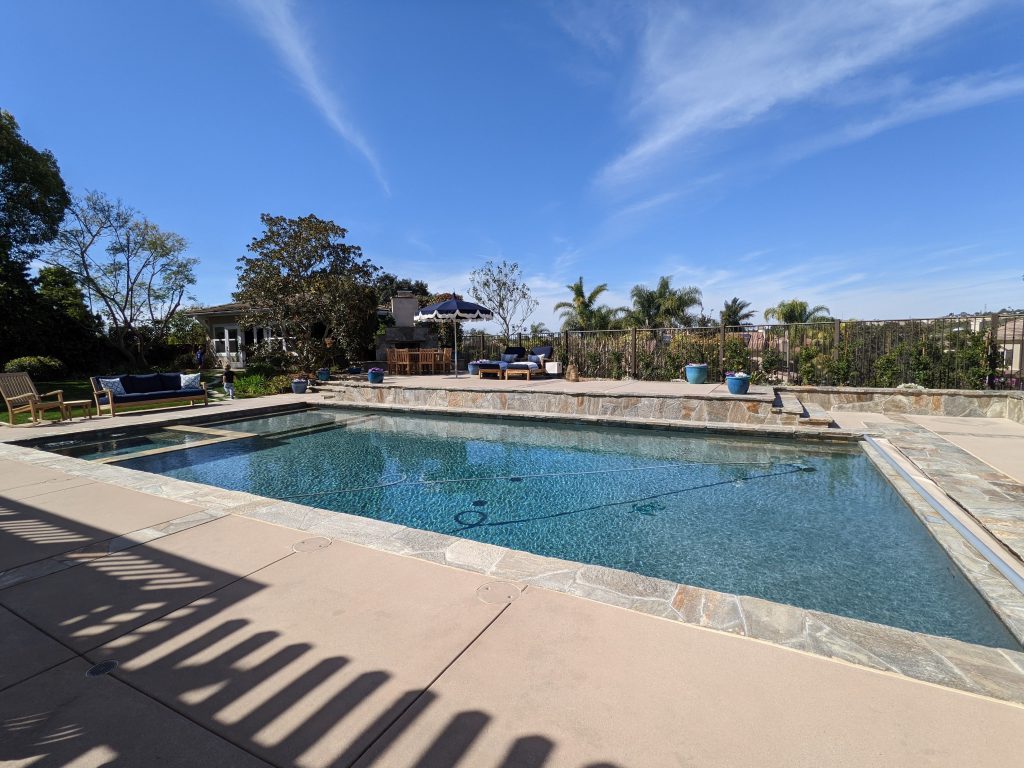
At least this house was fully remodeled, had a guest house (with double-tap kegerator!) and large pool all laid out nicely on a half-acre lot in the Ranch. This is the one I featured previously with the dozens of attendees at the open houses.
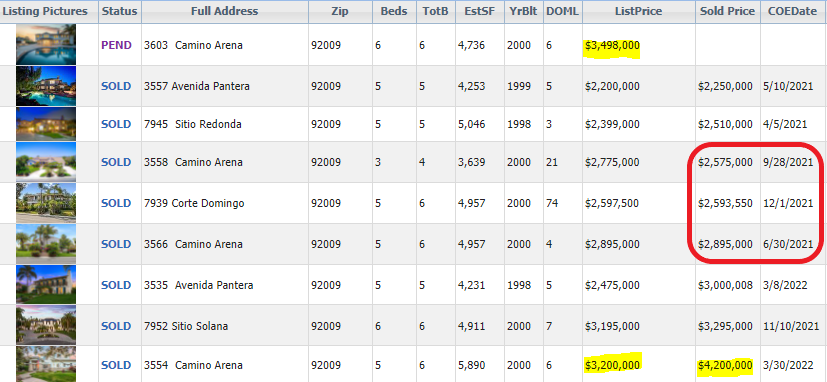
Here are the comps for the neighborhood – what was a trend in the upper-$2,000,000s in the second half of 2021 sure popped up in a hurry to $4 million+. The pending sale had “several offers and is way over list”, according to the listing agent:
Donna asked what sellers might think about his video.
I hope they think that old Jim the Realtor is tracking the market closer than anyone and would be the ideal listing agent because of how he is able to utilize this research to take advantage of the market at hand:
The market is heating up fast and early this year! The majority of home buyers paid over the list price in February, and these were decisions mostly made in January:
NSDCC Detached-Home Sales, % Closed Over List Price
January: 38%
February: 43%
March: 53%
April: 55%
May: 54%
June: 59%
July: 64%
August: 55%
September: 41%
October: 45%
November: 48%
December: 48%
January: 49%
February: 60%
~~~~~~~~~~~~~~~~~~~~~~~~~~~~~~~~~~~~~~~~~~~~~~~
~~~~~~~~~~~~~~~~~~~~~~~~~~~~~~~~~~~~~~~~~~~~~~~
Even though the 2022 listings count for the first two months of the year is 33% BELOW the count in 2021, sales are only 16% under the average for the last five years:
NSDCC January + February Sales
2017: 174 + 172 = 346
2018: 149 + 162 = 311
2019: 150 + 174 = 324
2020: 182 + 184 = 366
2021: 187 + 224 = 411
2022: 140 + 156 = 296
~~~~~~~~~~~~~~~~~~~~~~~~~~~~~~~~~~~~~~~~~~~~~~~
NSDCC Average and Median Prices
| Month | |||||
| Feb | |||||
| March | |||||
| April | |||||
| May | |||||
| June | |||||
| July | |||||
| Aug | |||||
| Sept | |||||
| Oct | |||||
| Nov | |||||
| Dec | |||||
| Jan | |||||
| Feb |
The average sales price went up 7% MoM in January, and 9% in February.
The median sales price went up 4% MoM in January, and 7% in February.
THE MEDIAN SALES PRICE WENT UP 7% IN ONE MONTH!
This is the craziest real estate market ever – and the spring selling season is just getting started!
~~~~~~~~~~~~~~~~~~~~~~~~~~~~~~~~~~~~~~
Even with the list prices reflecting massively-inflated values, nearly half of the homebuyers felt the need to pay over the list price lately:
NSDCC Detached-Home Sales, % Closed Over List Price
January: 38%
February: 43%
March: 53%
April: 55%
May: 54%
June: 59%
July: 64%
August: 55%
September: 41%
October: 45%
November: 48%
December: 48%
January: 49%
There were another 15% who paid full price in January, so almost two-thirds paid all the money. There were 16 listings that sold with zero days on market too.
~~~~~~~~~~~~~~~~~~~~~~~~~~~~~~~~~~~~~~~~~~~~~~~
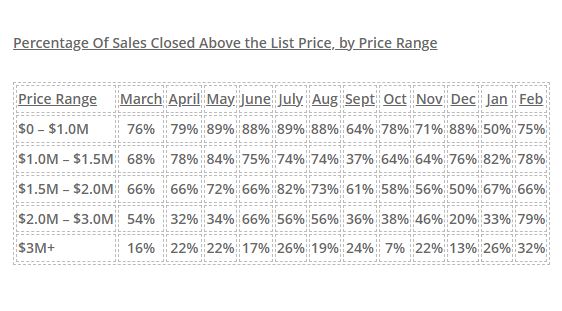
Percentage Of Sales Over List Price by Price Range
| Price Range | |||||||||||
| $0 – $1.0M | |||||||||||
| $1.0M – $1.5M | |||||||||||
| $1.5M – $2.0M | |||||||||||
| $2.0M – $3.0M | |||||||||||
| $3M+ |
~~~~~~~~~~~~~~~~~~~~~~~~~~~~~~~~~~~~~~~~~~~~~~~
The January sales were a little soft, historically, but the inventory has been decimated:
NSDCC January Sales
2017: 174
2018: 149
2019: 150
2020: 182
2021: 187
2022: 140
~~~~~~~~~~~~~~~~~~~~~~~~~~~~~~~~~~~~~~~~~~~~~~~
NSDCC Average and Median Prices
| Month | |||||
| Feb | |||||
| March | |||||
| April | |||||
| May | |||||
| June | |||||
| July | |||||
| Aug | |||||
| Sept | |||||
| Oct | |||||
| Nov | |||||
| Dec | |||||
| Jan |
The average sales price went up 7% MoM.
The median sales price went up 4% MoM.
The local pricing flattened out last summer, only to be revived over the last three months.
It should be a crazy spring – probably the craziest ever!
~~~~~~~~~~~~~~~~~~~~~~~~~~~~~~~~~~~~~~
Impressive momentum to wrap up the year, with almost half of the buyers feeling the need to pay over list:
NSDCC Detached-Home Sales, % Closed Over List Price
January: 38%
February: 43%
March: 53%
April: 55%
May: 54%
June: 59%
July: 64%
August: 55%
September: 41%
October: 45%
November: 48%
December: 48%
~~~~~~~~~~~~~~~~~~~~~~~~~~~~~~~~~~~~~~~~~~~~~~~
Have the higher-end buyers figured it out that paying over list could be a ruse though?
Percentage Of Sales Over List Price by Price Range
| Price Range | ||||||||||
| $0 – $1.0M | ||||||||||
| $1.0M – $1.5M | ||||||||||
| $1.5M – $2.0M | ||||||||||
| $2.0M – $3.0M | ||||||||||
| $3M+ |
~~~~~~~~~~~~~~~~~~~~~~~~~~~~~~~~~~~~~~~~~~~~~~~
The December sales were a little soft, historically, but the inventory has been decimated:
NSDCC December Sales
2017: 224
2018: 196
2019: 227
2020: 290
2021: 182
~~~~~~~~~~~~~~~~~~~~~~~~~~~~~~~~~~~~~~~~~~~~~~~
NSDCC Average and Median Prices
| Month | |||||
| Feb | |||||
| March | |||||
| April | |||||
| May | |||||
| June | |||||
| July | |||||
| Aug | |||||
| Sept | |||||
| Oct | |||||
| Nov | |||||
| Dec |
The median list price dropped and the median sales price went up!
The median sales price is 9% higher than the median list price!
The average LP and SP were almost identical for the second month in a row.
~~~~~~~~~~~~~~~~~~~~~~~~~~~~~~~~~~~~~~
Momentum going into 2022 is strong, given that the Over List percentage has gone up the last two months:
NSDCC Detached-Home Sales, % Closed Over List Price
January: 38%
February: 43%
March: 53%
April: 55%
May: 54%
June: 59%
July: 64%
August: 55%
September: 41%
October: 45%
November: 48%
The higher-end market had some bounce-back too:
Percentage Of Sales Over List Price by Price Range
| Price Range | |||||||||
| $0 – $1.0M | |||||||||
| $1.0M – $1.5M | |||||||||
| $1.5M – $2.0M | |||||||||
| $2.0M – $3.0M | |||||||||
| $3M+ |
The November sales were down 35% from last year, but the red-hot market of late-2020 is to blame. This year, the sales were more in line with previous Novembers:
NSDCC November Sales
2017: 217
2018: 199
2019: 212
2020: 306
2021: 199
NSDCC Average and Median Prices
| Month | |||||
| Feb | |||||
| March | |||||
| April | |||||
| May | |||||
| June | |||||
| July | |||||
| Aug | |||||
| Sept | |||||
| Oct | |||||
| Nov |
The median sales price went up 11% in one month, and is $101,000 higher than the median list price!
The median sales price is 19% higher than it was in February, which was ten months ago.
~~~~~~~~~~~~~~~~~~~~~~~~~~~~~~~~~~~~~~
The insanity is finding a comfortable range…..until next spring:
NSDCC Detached-Home Sales, % Closed Over List Price
January: 38%
February: 43%
March: 53%
April: 55%
May: 54%
June: 59%
July: 64%
August: 55%
September: 41%
October: 45%
A slight uptick in the overall percentage, but the high-end buyers aren’t going for this nonsense any more:
Percentage Of Sales Over List Price by Price Range
| Price Range | ||||||||
| $0 – $1.0M | ||||||||
| $1.0M – $1.5M | ||||||||
| $1.5M – $2.0M | ||||||||
| $2.0M – $3.0M | ||||||||
| $3M+ |
October saw new highs in average list and sales prices, which would indicate strong action in the higher-end homes. The medians have been fairly steady:
NSDCC Average and Median Prices
| Month | |||||
| Feb | |||||
| March | |||||
| April | |||||
| May | |||||
| June | |||||
| July | |||||
| Aug | |||||
| Sept | |||||
| Oct |
The average sales price increased 30% YoY, and the median sales price is up 13% YoY, but that is also compared to the 382 sales last October – which was, and will always be, the most sales in any October.
As sales taper off over the next 2-3 months, it might cause a little more volatility in these pricing metrics.
~~~~~~~~~~~~~~~~~~~~~~~~~~~~~~~~~~~~~~
Here is where the cooling-frenzy shows up.
The number of buyers who are willing to pay over list price is dropping:
NSDCC Detached-Home Sales, % Closed Over List Price
January: 38%
February: 43%
March: 53%
April: 55%
May: 54%
June: 59%
July: 64%
August: 55%
September: 41%
To have 41% of the sales close over list price would be remarkable….if it weren’t for the last six months!
Percentage Who Paid Over List Price by Price Range
| Price Range | |||||||
| $0 – $1.0M | |||||||
| $1.0M – $1.5M | |||||||
| $1.5M – $2.0M | |||||||
| $2.0M – $3.0M | |||||||
| $3M+ |
The average sales prices have been virtually identical for the last three months, and the median sales price is back up to where it was in May:
NSDCC Average and Median Prices
| Month | |||||
| Feb | |||||
| March | |||||
| April | |||||
| May | |||||
| June | |||||
| July | |||||
| Aug | |||||
| Sept |
Compared to last September, the average sales price was +25%, and the median sales price was +33%!
Sales should taper off the rest of the year, but not sure if pricing will follow!
~~~~~~~~~~~~~~~~~~~~~~~~~~~~~~~~~~~~~~


Are you looking for an experienced agent to help you buy or sell a home?
Contact Jim the Realtor!
CA DRE #01527365, CA DRE #00873197
