It means the set of homes that closed escrow in October happen to produce higher numbers because they were larger (October median sf was +12%) and more attractive than the group in September.
BOTH THE AVERAGE AND MEDIAN SALES PRICES ARE -23% SINCE MARCH.
We saw that the difference needed to fully compensate for the higher rates is -30%. We’re almost there, and the full effect should be built in by springtime!
Please note that I didn’t say home prices are down 23%.
The median sales price is 23% lower than it was six months ago.
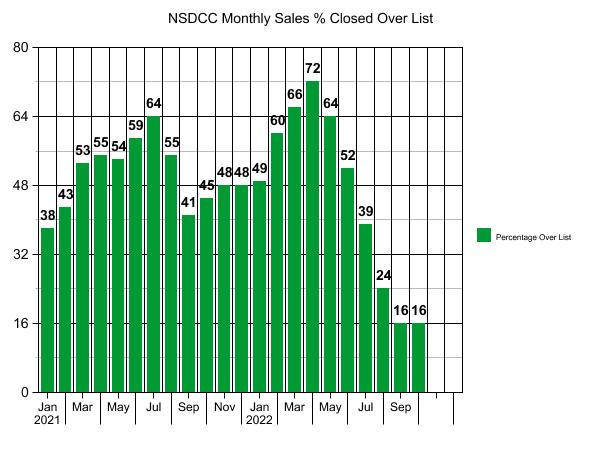
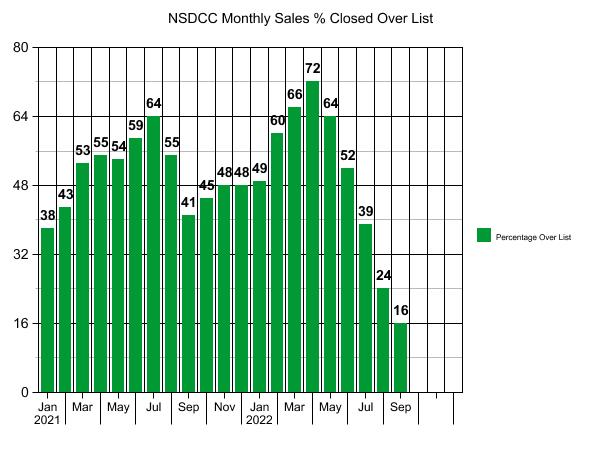
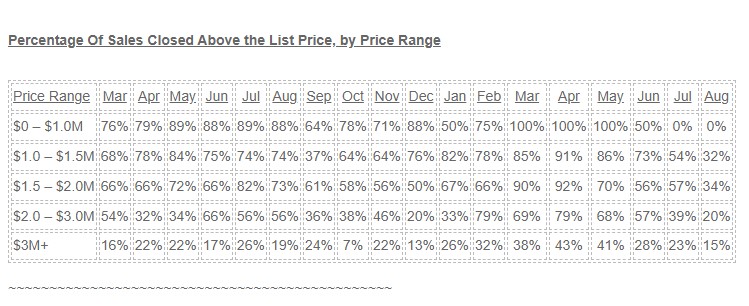
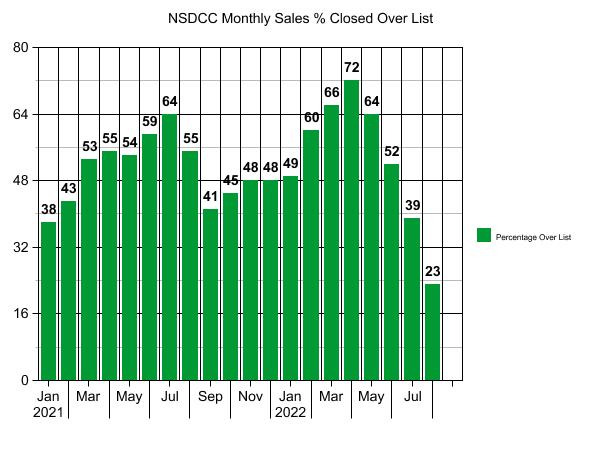
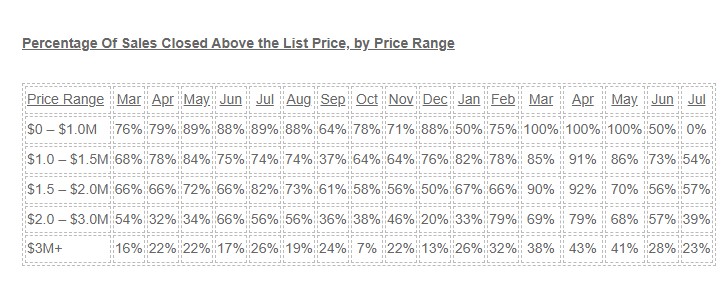
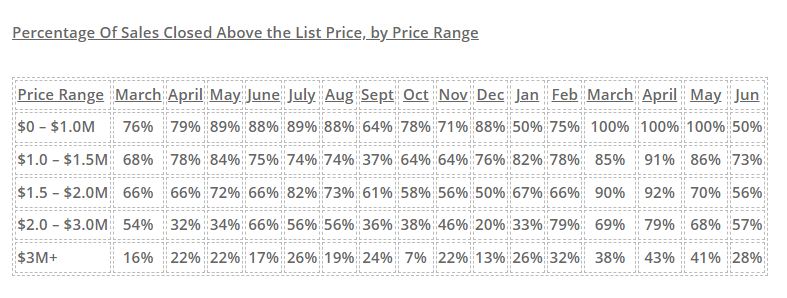
The over-bidding is winding down to more manageable levels as just 24% of August buyers were willing to pay over the list price. As usual, the $1,000,000 to $2,000,000 range was the most active, where inventory is low and the number of quality homes for sale even lower:
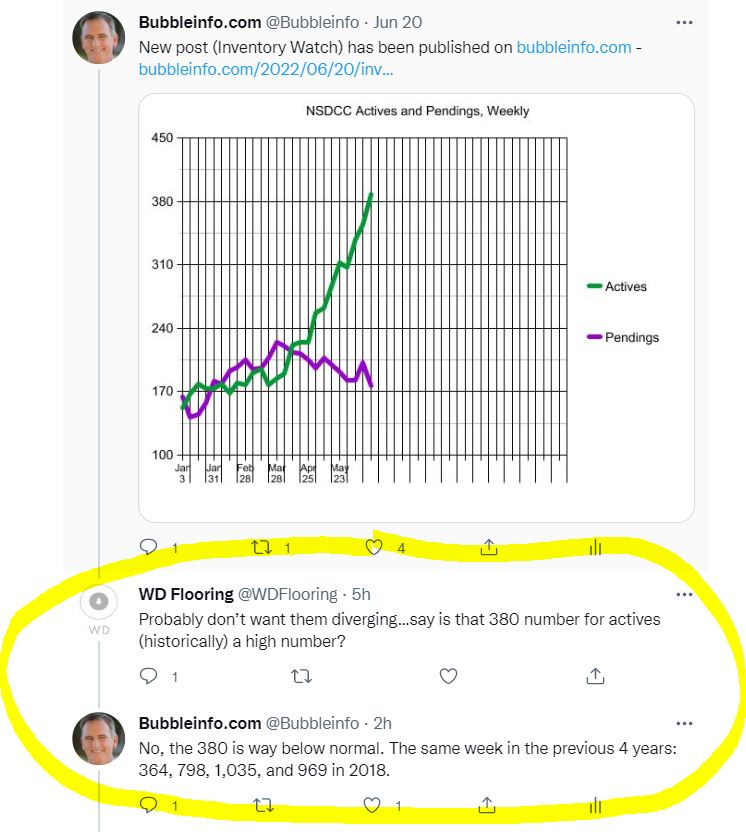
The number of sales in August were higher than they were in July, but still well under recent history:
NSDCC August Sales
2018: 275
2019: 263
2020: 351
2021: 268
2020: 161
~~~~~~~~~~~~~~~~~~~~~~~~~~~~~~~~~~~~~~~~~~~~~
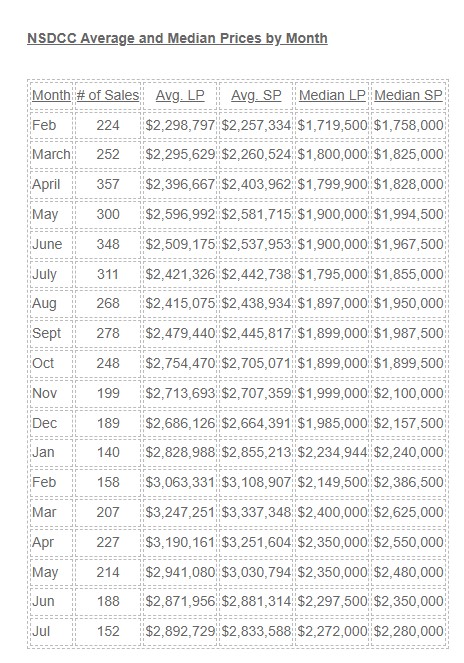
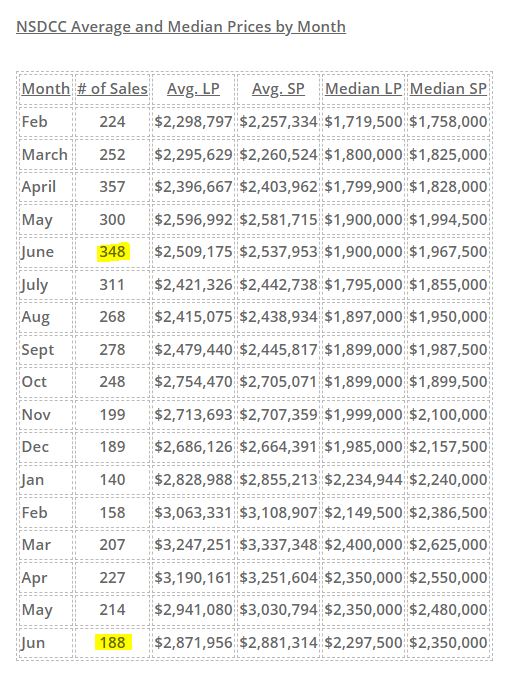
NSDCC Average and Median Prices by Month
Month
# of Sales
Avg. LP
Avg. SP
Median LP
Median SP
Feb
224
$2,298,797
$2,257,334
$1,719,500
$1,758,000
March
252
$2,295,629
$2,260,524
$1,800,000
$1,825,000
April
357
$2,396,667
$2,403,962
$1,799,900
$1,828,000
May
300
$2,596,992
$2,581,715
$1,900,000
$1,994,500
June
348
$2,509,175
$2,537,953
$1,900,000
$1,967,500
July
311
$2,421,326
$2,442,738
$1,795,000
$1,855,000
Aug
268
$2,415,075
$2,438,934
$1,897,000
$1,950,000
Sept
278
$2,479,440
$2,445,817
$1,899,000
$1,987,500
Oct
248
$2,754,470
$2,705,071
$1,899,000
$1,899,500
Nov
199
$2,713,693
$2,707,359
$1,999,000
$2,100,000
Dec
189
$2,686,126
$2,664,391
$1,985,000
$2,157,500
Jan
140
$2,828,988
$2,855,213
$2,234,944
$2,240,000
Feb
158
$3,063,331
$3,108,907
$2,149,500
$2,386,500
Mar
207
$3,247,251
$3,337,348
$2,400,000
$2,625,000
Apr
227
$3,190,161
$3,251,604
$2,350,000
$2,550,000
May
214
$2,941,080
$3,030,794
$2,350,000
$2,480,000
Jun
188
$2,871,956
$2,881,314
$2,297,500
$2,350,000
Jul
152
$2,892,729
$2,833,588
$2,272,000
$2,280,000
Aug
161
$2,953,967
$2,849,332
$2,200,000
$2,150,000
This is much more normal – the average and median sales prices are under their list prices!
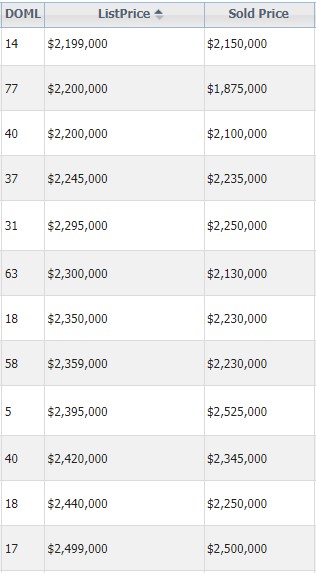
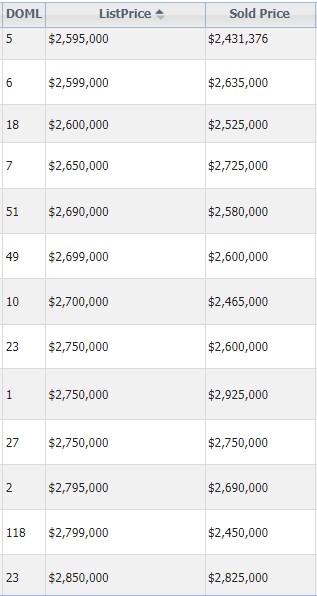
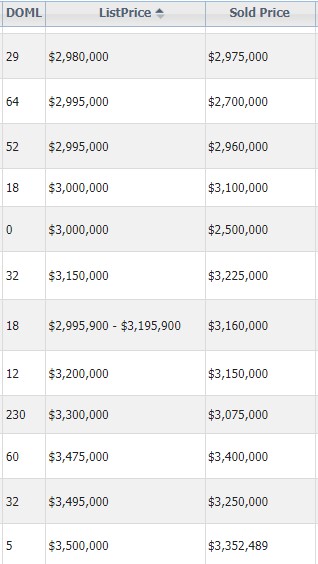
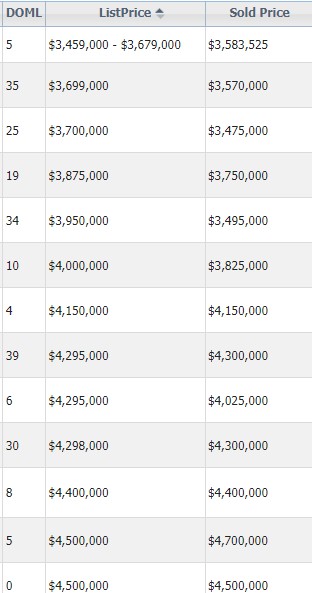
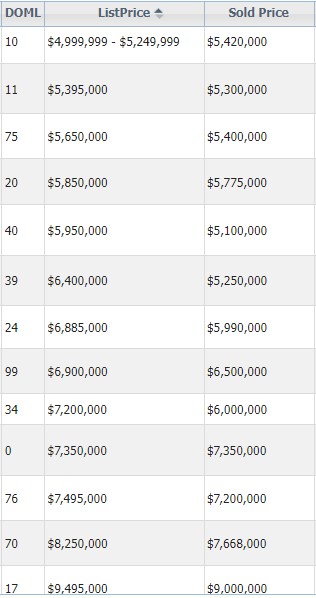
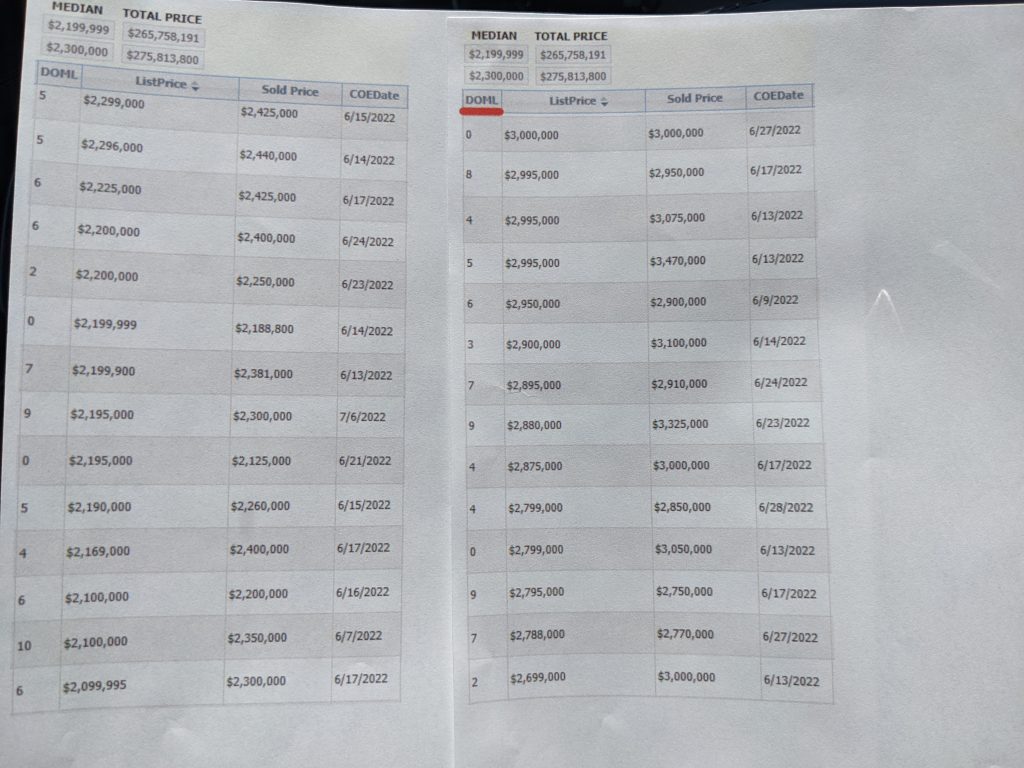
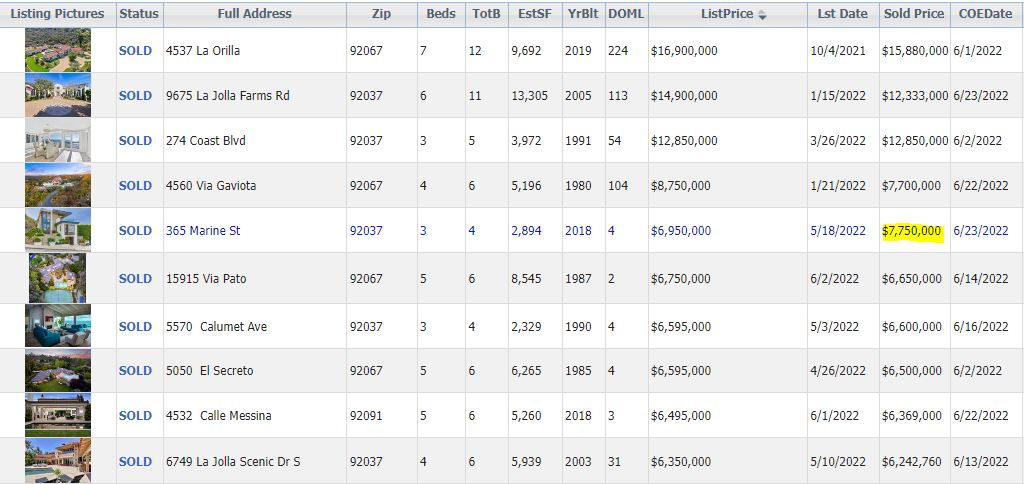
Want proof that Jay Powell has tamed the housing frenzy, and reversed the trend of buyers having to pay well over the list price to win a house? Here are examples of the list and sold prices of August home sales between La Jolla and Carlsbad – note the relationship to the days-on-market (DOML):
So far, we’ve had 154 August closings reported, which means we should get up to 175 or so by the time every sale is inputted.
I’ll do the final count later, but of the 154 sales, there were 23% that sold over their list price. But it is much more reasonable and sustainable if buyers only have to pay $25,000 to $50,000 over the list price for the creampuffs, rather than $400,000 to $800,000!
Sellers shouldn’t be bummed either, because their huge gains are priced in now.
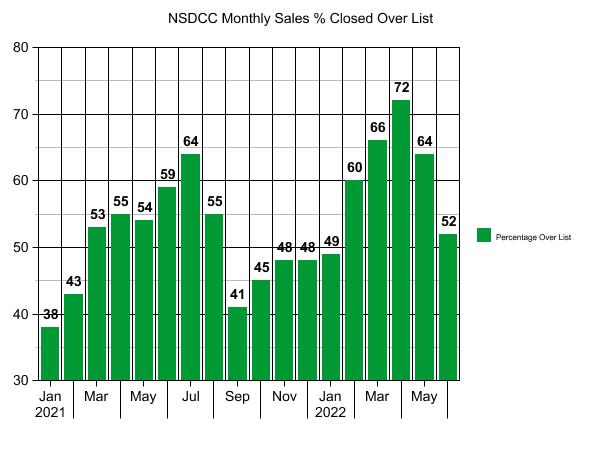
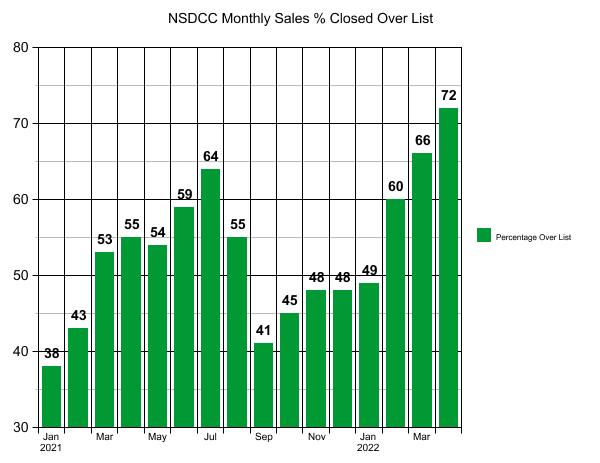
The graph above shows how the 2021 off-season wasn’t off by much, with nearly half of the Nov-Jan sales closing over their list price. We probably won’t see that happen this year!
On the street, it feels like the off-season is already here, which is fine. The seasonality has been topsy-turvy ever since the pandemic started, so we can handle a longer off-season this year. The outcome will be determined by what the listing agents are telling their sellers.
Are they saying that this is the start of a long downward slide, and sellers should hit the panic button and dump on price to get out while they can? If so, shame on them. If 39% of the buyers who closed in July were still paying over the list price, then it suggests that what we are experiencing is an inventory problem – there aren’t many superior houses for sale at decent prices, and the gap between them and inferior houses hasn’t adjusted enough yet.
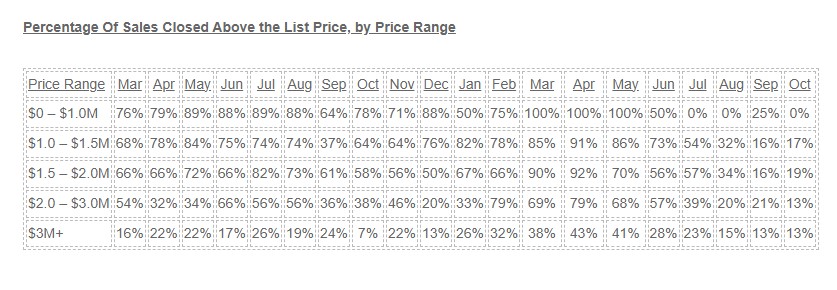
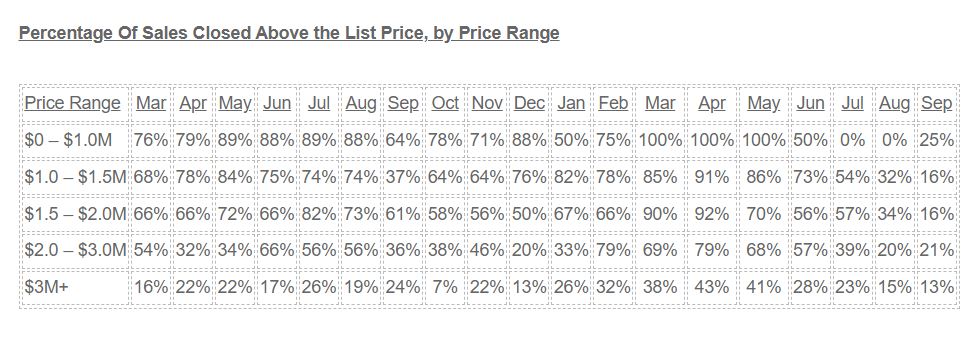
Here is the breakdown by price range:
There was only one sale under $1,000,000, and it was a mobile home. Most of the homes sold between $1,000,000 and $2,000,000 closed for more than their list prices, and the sales above $2 million were still competitive. The group of salable homes is smaller than before, but the great ones are still being bid up.
The average and median sales prices are closer to the list prices now, suggesting that those who do bid over the list price aren’t going over by much:
For an industry that has never figured out how to properly handle a bidding war, it is a miracle that this many homes are still selling over list. This was our big chance to incorporate a true auction format, but it will pass us by, unfortunately.
Here is a good sampling of the NSDCC pricing decisions made in May (mortgage rates started going up the first of April). The days-on-market are on the left.
Days on Market: All 28 found their buyer quickly – only one took as long as ten days!
Paid Over List: 21 of 28 paid over the list price (75%).
Of the 21 who paid over the list price, the average amount paid over list was $185,761. Literally 11 out of 21 paid at least $200,000 over list – and these 28 sales are the mid-range group!
Paying over the list price must have some addictive qualities!
Either that, or the superior homes are still attracting a lot of attention. Well into the higher-rate environment, more than half of the June buyers paid over the list price!
Here is the breakdown by price range:
The average and median sales prices have been drifting downward, but both are still above the list prices:
The year-over-year sales are going to look terrible because 2021 was an incredible frenzy. The NSDCC June sales in the three previous years were 274, 282, and 299, so the 188 is only 34% below that average.
My La Jolla sale was the fifth-highest sales price in June, and sold for $1,150,000 more than the oceanfront house on Calumet. My $800,000 over list was #1 – it was the most over list of all the June sales!
We are having fewer sales between Carlsbad and La Jolla, but about the same percentage are closing over the list price as we’ve seen in the previous months of 2022:
NSDCC Detached-Home Sales, June (Month-to-Date)
Number of Sales: 104
Number of Sales Closed Over List: 68 (65%)
Average List Price of Over Lists: $2,298,732
Average Sales Price of Over Lists: $2,448,509
SP:LP = 107%
Median List Price of Over Lists: $2,100,000
Median Sales Price of Over Lists: $2,267,500
SP:LP = 108%
Can we say that the list pricing has come down much? Not really.
The median days-on market of those that closed over list was 8 days, so pretty much all of the buyers were into the higher mortgage-rate era when they made their decision.
I know it’s tempting for waiting buyers to think it’s going to get better, later – but so far, all that’s happened is fewer sales.
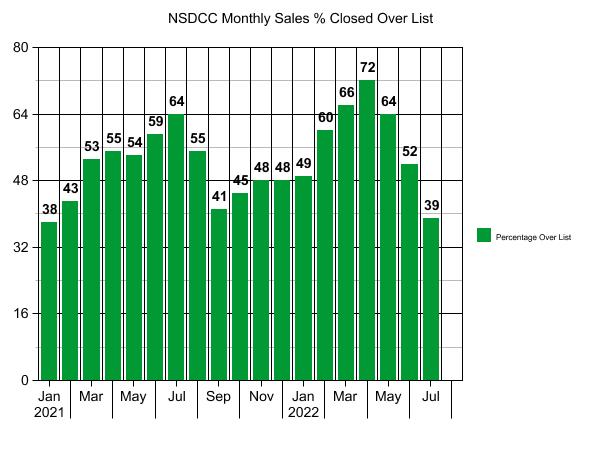
There was a slight decline in the percentage of sales closed over the list price in May, but it matched the peak month in 2021, and historically speaking, it still sounds wild that nearly two out of three buyers are paying more than the list price when we are at these crazy-high price points.
~~~~~~~~~~~~~~~~~~~~~~~~~~~~~~~~~~~~~~~~~~~~~~~
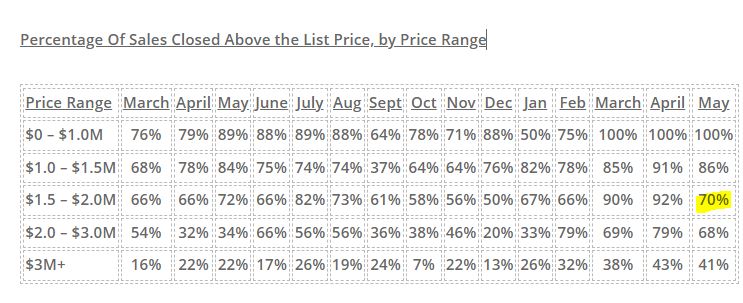
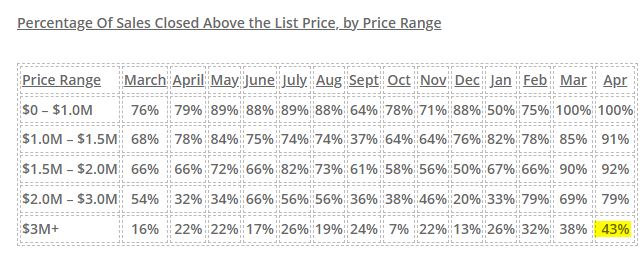
Here is how it breaks down by price range – the big decline was in one category:
NSDCC Average and Median Prices
Month
# of Sales
Avg. LP
Avg. SP
Median LP
Median SP
Feb
224
$2,298,797
$2,257,334
$1,719,500
$1,758,000
March
252
$2,295,629
$2,260,524
$1,800,000
$1,825,000
April
357
$2,396,667
$2,403,962
$1,799,900
$1,828,000
May
300
$2,596,992
$2,581,715
$1,900,000
$1,994,500
June
348
$2,509,175
$2,537,953
$1,900,000
$1,967,500
July
311
$2,421,326
$2,442,738
$1,795,000
$1,855,000
Aug
268
$2,415,075
$2,438,934
$1,897,000
$1,950,000
Sept
278
$2,479,440
$2,445,817
$1,899,000
$1,987,500
Oct
248
$2,754,470
$2,705,071
$1,899,000
$1,899,500
Nov
199
$2,713,693
$2,707,359
$1,999,000
$2,100,000
Dec
189
$2,686,126
$2,664,391
$1,985,000
$2,157,500
Jan
140
$2,828,988
$2,855,213
$2,234,944
$2,240,000
Feb
156
$3,058,406
$3,104,854
$2,149,500
$2,386,500
Mar
206
$3,254,033
$3,342,384
$2,425,000
$2,625,000
Apr
224
$3,205,239
$3,267,447
$2,372,500
$2,575,000
May
214
$2,941,080
$3,030,794
$2,350,000
$2,480,000
The average and median sales prices are dropping, but so are the list prices so it’s expected. The median sales price could dip another 13% and still be in positive territory for 2022!
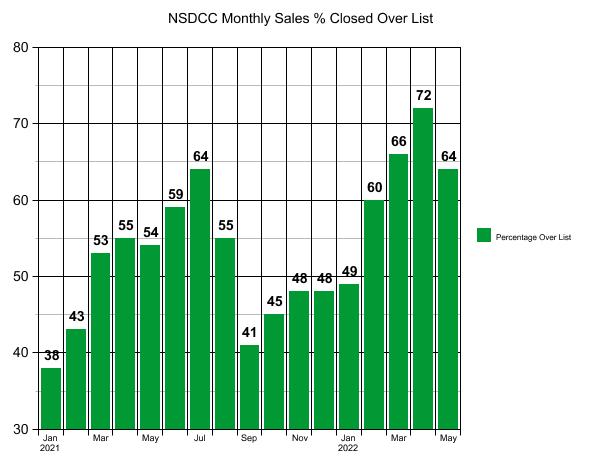
Will April be the peak month of buyers paying over the list price?
NSDCC Detached-Home Sales, % Closed Over List Price
Hard to imagine that there will ever be another month where nearly three-quarters of the home buyers end up paying over the list price!
~~~~~~~~~~~~~~~~~~~~~~~~~~~~~~~~~~~~~~~~~~~~~~~
How about those $3,000,000+ home buyers!
~~~~~~~~~~~~~~~~~~~~~~~~~~~~~~~~~~~~~~~~~~~~~~~
NSDCC Average and Median Prices
Month
# of Sales
Avg. LP
Avg. SP
Median LP
Median SP
Feb
224
$2,298,797
$2,257,334
$1,719,500
$1,758,000
March
252
$2,295,629
$2,260,524
$1,800,000
$1,825,000
April
357
$2,396,667
$2,403,962
$1,799,900
$1,828,000
May
300
$2,596,992
$2,581,715
$1,900,000
$1,994,500
June
348
$2,509,175
$2,537,953
$1,900,000
$1,967,500
July
311
$2,421,326
$2,442,738
$1,795,000
$1,855,000
Aug
268
$2,415,075
$2,438,934
$1,897,000
$1,950,000
Sept
278
$2,479,440
$2,445,817
$1,899,000
$1,987,500
Oct
248
$2,754,470
$2,705,071
$1,899,000
$1,899,500
Nov
199
$2,713,693
$2,707,359
$1,999,000
$2,100,000
Dec
189
$2,686,126
$2,664,391
$1,985,000
$2,157,500
Jan
140
$2,828,988
$2,855,213
$2,234,944
$2,240,000
Feb
156
$3,058,406
$3,104,854
$2,149,500
$2,386,500
Mar
206
$3,254,033
$3,342,384
$2,425,000
$2,625,000
Apr
224
$3,205,239
$3,267,447
$2,372,500
$2,575,000
Whoops – after the average sales price went up 7% MoM in January, 9% in February, and 8% in March, it dropped by 2% in April.
Same here – after the median sales price went up 4% MoM in January, 7% in February, and 10% in March, it dropped 2% in April too!
The median sales price could drop another 15% this year and still be in positive territory for 2022. Yet it would feel like a complete meltdown of epic proportions!