When calculating how much your home has increased in value, you have to identify its COST BASIS – meaning anything and everything that you spent to pay for the product. The IRS defines a capital improvement as a home improvement that adds market value to the home, prolongs its useful life or adapts it to new uses. Minor repairs and maintenance jobs like changing door locks, repairing a leak or fixing a broken window do not qualify as capital improvements.
Capital improvements and things you can put in your COST BASIS include:
The price you paid for the property, including settlement costs, such as: title fees, legal fees, recording fees, survey fees, and any transfer taxes or fees you paid in connection with the purchase.
Additions: An added extra bedroom or bathroom, a deck on the back of the home, a new garage, an added porch or patio….anything that adds value to your home.
Lawn and grounds improvements: Value-adding landscaping projects, driveway or walkway construction, a new fence or retaining wall, adding a swimming pool, etc can qualify as property improvements.
Exterior improvements: New windows, a new roof, and new siding are examples. Any and all renovation costs including ANY and ALL costs related to that renovation work.
Insulation: This includes insulation in the attic, inside walls, under floors, or around pipes and ductwork.
Systems: Installing a new heating or air conditioning system, new ductwork, adding a central vacuuming system, wiring improvements, installing a security system, solar, geothermal, generators, batteries, and putting in lawn irrigation are improvements.
Plumbing: Installing a septic system, water heater, or soft water system adds value.
Interior improvements: New appliances, kitchen renovations, new flooring/carpeting, the installation of a fireplace, etc.
If you needed to make home improvements in order to sell your home, you can deduct those expenses as selling costs as long as they were made within 90 days of the closing. Your COST BASIS does NOT include hazard insurance premiums, moving expenses, or any mortgage-related charges (mortgage insurance, credit report fees, and appraisal costs are out) and general repairs that are essential to keep something working do not qualify. Yard maintenance, HOA fees, and real estate taxes don’t count. Always check with your accountant.
Keeping tabs of these costs throughout the lifetime of a house is wise.
~~~~~~~~~~~~~~~~~~~~~~~~~~~~~~~~~~~~~~~~~~~~~~~~
How do you calculate the capital-gains tax when selling?
Subtract your COST BASIS, commissions, and closing costs from your sales price to determine the taxable gain. Those who lived in the home for two out of the last five years can also subtract the $250,000 exemption if single (or $500,000 if two people), and then the rest is the taxable amount. Long-term capital gains — that is, gains on assets held for a at least a year – are generally taxed at a lower rate than earned income (money that you get from working).
In 2022, the IRS ranges are as follows:
0 Percent – $0-$41,675 Single/$0-$83,350 Married
15 Percent – $41,676-$459,750 Single/$83,351-$517,200 Married
20 percent – $459,751+ Single/$517,201 Married
The State of California will take their chunk too. Check with your tax adviser!
People have asked how I liked the article about Oceanside’s resurgence.
I loved it – they featured our own Michele Bolanos in the photo (above)!
The author noted that the purple palace got bulldozed last year (the last remaining strip club in town), and they are building upscale apartments there now. More gentrification is on-going too – an excerpt:
Marine Corps Base Camp Pendleton (population about 38,000) has been the northern next-door neighbor to Oceanside (population about 174,000) since it was established during World War II. Around downtown, you still see several military surplus stores, tattoo parlors and barber shops, where many Marines get their “high-and-tight” haircuts weekly.
With so many active and retired military on hand, the city has a more blue-collar, conservative feel than most other SoCal beach towns. It’s also more culturally diverse, according to the most recent U.S. Census numbers.
But, as new businesses multiply, Oceanside is looking a bit more like its civilian neighbors to the south (Carlsbad and Encinitas) and north (San Clemente).
“We liked it the way it was. But it’s got to move,” said Jonny Gomez, 84, owner of the Esquire barber shop since the early 1960s.
“I believe we’re now up to eight coffee shops in downtown,” said Gumaro Escarcega, chief operations officer of the civic nonprofit MainStreet Oceanside. With the cost of living rising fast — Zillow estimates that home values are up about 25% in the last year — “we have to be careful because of gentrification,” he added.
Beach houses west of the I-5 are selling for more than $1,000,000, so there are no real bargains to be had. But it is in the path of progress – here is my tour from last year:
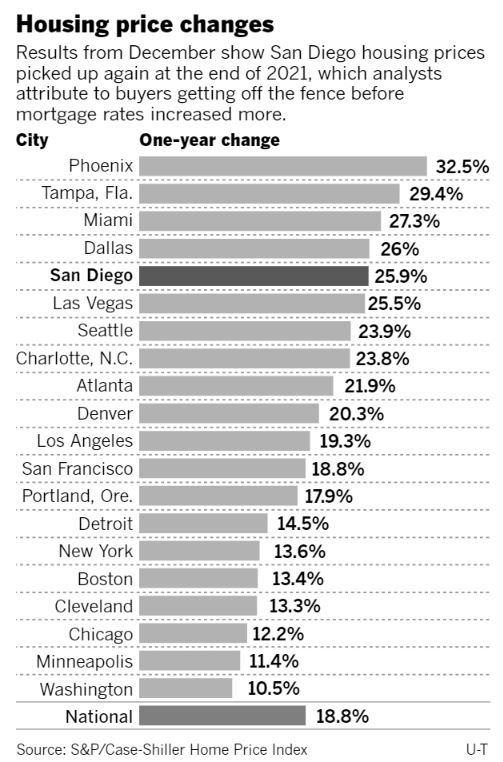
San Diego had the fifth highest year-over-year gain in 2021, behind metros with much lower price points (Phoenix, Tampa, Miami, and Dallas).
Our month-over-month gain in December was #1 nationwide (tied with Miami).
San Diego Non-Seasonally-Adjusted CSI changes
Observation Month
SD CSI
M-o-M chg
Y-o-Y chg
Jan ’20
264.04
+0.2%
+5.1%
Feb
265.34
+0.5%
+4.6%
Mar
269.63
+1.6%
+5.2%
Apr
272.48
+1.1%
+5.8%
May
273.51
+0.4%
+5.2%
Jun
274.91
+0.5%
+5.0%
Jul
278.00
+1.1%
+5.4%
Aug
283.06
+1.8%
+7.6%
Sep
288.11
+1.8%
+9.4%
Oct
292.85
+1.6%
+11.5%
Nov
295.64
+1.0%
+12.3%
Dec
297.52
+0.6%
+13.0%
Jan ’21
301.72
+1.4%
+14.3%
Feb
310.62
+2.9%
+17.1%
Mar
320.81
+3.3%
+19.1%
Apr
331.47
+3.3%
+21.6%
May
341.05
+2.9%
+24.7%
Jun
349.78
+2.6%
+27.2%
Jul
355.33
+1.6%
+27.8%
Aug
357.11
+0.5%
+26.2%
Sep
359.88
+0.8%
+24.9%
Oct
363.80
+1.1%
+24.2%
Nov
367.62
+1.1%
+24.3%
Dec
374.48
+1.8%
+25.9%
The experts have run out of superlatives, and roll out the same old explanations to describe the uptick in December – which was really the third month of the ramp-up into 2022:
Home prices rose 18.8% in 2021, according to the S&P CoreLogic Case-Shiller US National Home Price Index, the biggest increase in 34 years of data and substantially ahead of 2020’s 10.4% gain.
All regions saw price gains last year, but were strongest in the South and the Southeast, each up over 25%. Phoenix, Tampa and Miami reported the highest annual gains among the 20 cities in the index in December. Phoenix led the way for the 31st consecutive month with prices in December 32.5% over the year before. It was followed by Tampa with a 29.4% increase, and Miami with a 27.3% increase.
“We continue to see very strong growth at the city level,” said Craig J. Lazzara, Managing Director at S&P DJI. “All 20 cities saw price increases in 2021, and prices in all 20 are at their all-time highs.”
Over the past several months home prices have been rising at very high, but decelerating rates, said Lazzara. But that deceleration paused in December.
Lazzara said that strength in the US housing market is being driven in part by a change in location preferences as households react to the pandemic.
A persistent low inventory of homes dropped to record low levels in December, according to the National Association of Realtors. In the face of continued strong demand, prices were pushed higher. Newly constructed homes are in the pipeline, but a long-running shortage in supply combined with the lingering effects of the pandemic mean it will take years to meet demand.
“More data will be required to understand whether this demand surge simply represents an acceleration of purchases that would have occurred over the next several years rather than a more permanent secular change,” Lazzara said. “In the short term, we should soon begin to see the impact of increasing mortgage rates on home prices.”
Mortgage rates, which had risen only gradually since August, began to abruptly climb in late December closing in on the 4% threshold for a 30-year fixed-rate mortgage.
“Home prices continued to surpass expectations in December, but a marked change may be ahead for growth as rising mortgage rates eat into homebuyer purchasing power,” said Danielle Hale, Realtor.com’s chief economist. “While typical asking prices continue to accelerate, the pace of median sales price growth has slowed, signaling a potential gap between what buyers are willing and able to pay and what sellers are hoping to net.
Higher mortgage rates have added more than $200 to the monthly cost of a typical for-sale home since December 2020 — when rates were at all-time lows — with more than half of that increase occurring over the past eight weeks, Hale said.
“With home prices expected to continue rising, even at a slower pace, affordability will increasingly challenge 2022 buyers as a decade-long underbuilding trend has left the housing market 5.8 million homes short of household growth,” said Hale. “At the same time, we expect pandemic trends like workplace flexibility and competitive labor market conditions to give workers the boost in income and wider search areas they need to navigate a still-challenging housing market successfully.”
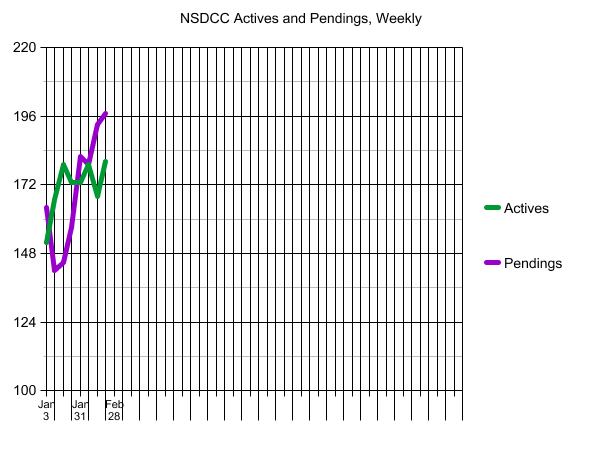
A few more listings this week but all geared towards the affluent. There are only 7 NSDCC detached-homes for sale priced under $1,500,000, and 100+ houses for sale that are priced over $4,500,000!
I’ve been hoping to promote the best areas in nearby states for readers to consider for relocations, and have wanted to feature lower-priced homes in order to make the move really worth it.
Yesterday I spoke with Bill Ims, a former Carlsbad realtor and probably the nicest guy in the business. He and his wife moved to Green Valley, Arizona, and love it!
He has been selling homes there, and his latest listing is on the golf course for only $370,000!
Check out our new listing that is priced at $251/sf!
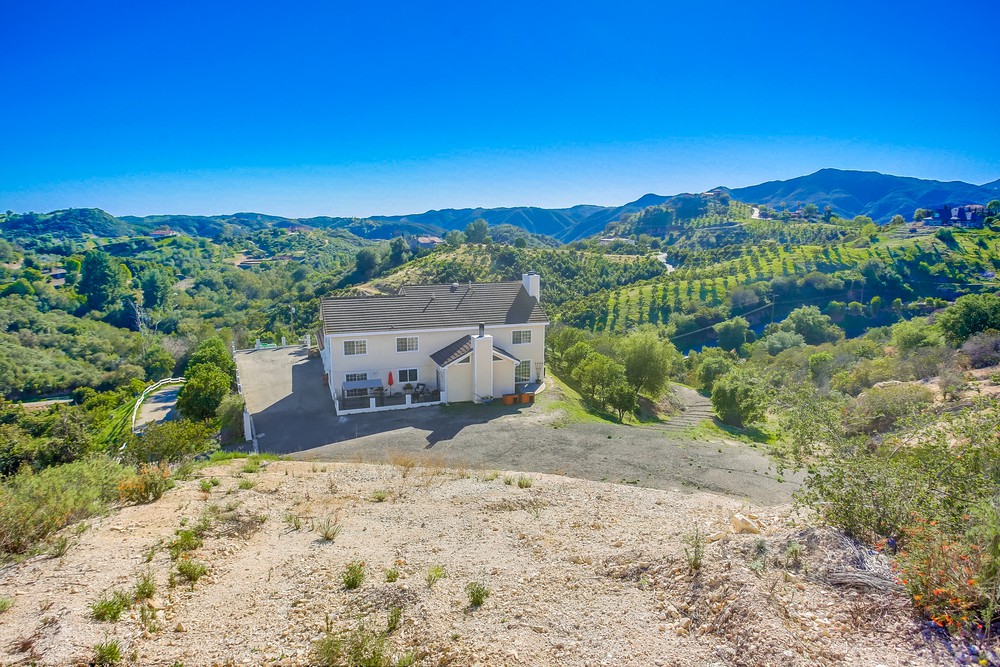
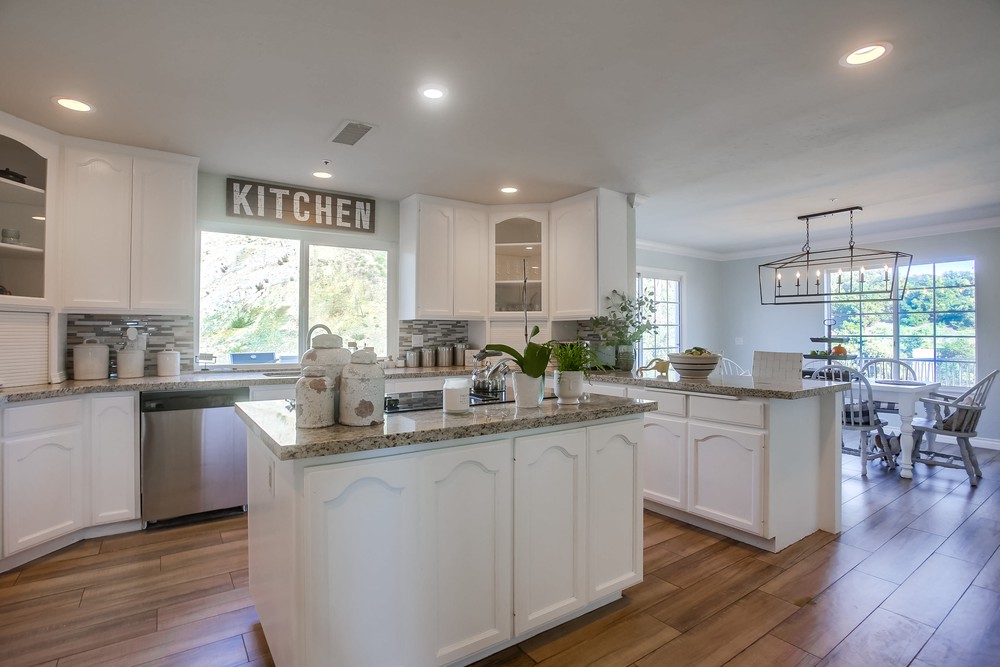
39221 Daily Rd., Fallbrook, CA 92028
4 br + den/2.5 ba, 3,963sf
YB: 1991
5.14 acres
LP = $995,000
The perfect home of the future – get out of the rat race and enjoy fine country living in this gorgeous home bathed in natural light with panoramic views in every direction! Huge bedrooms, walk-in closets, hardwood floors, 2 fireplaces, and gourmet kitchen with chef’s island and extra-large pantry. Valencia orange trees and lemons too. For those working from home, it has exceptional internet access! Thinking of buying a home for your kids or an ideal rental property? This could be for you! Bring the RVs, toys, trailers, etc.
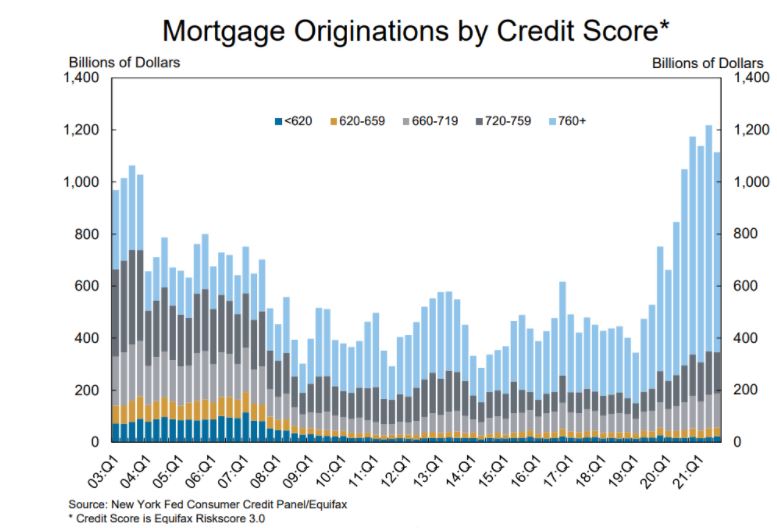
If there is anyone left who thinks the bubble will burst and prices will come down substantially, let’s note that it would take a multitude of people with excellent credit scores and what was once a big down payment to give those up. The vast majority of today’s buyers have outstanding credit – it would take a disaster for them to walk away.
Agents used to tout how great their buyer’s credit score was – but today it’s expected.
We don’t need alternative financing any more. Those who don’t qualify are left out of the game instead.
Trustindex verifies that the original source of the review is Google.
Jim & Donna Klinge helped us sell our home of 30 years in Ocean Hills. We were very happy with their service and would HIGHLY recommend them to anyone looking for an Honest, Knowledgeable, Skilled, Informed Efficient realty team. Both Jim & Donna were so helpful in different ways and complemented each others skills. Please refer to a more detailed review that we wrote on YELP. Thank You Both for all your help!!!
Jesse O'Hara
June 12, 2025
Trustindex verifies that the original source of the review is Google.
A+ thank you
Lisa Tuomi
June 11, 2025
Trustindex verifies that the original source of the review is Google.
Many years ago, we purchased a home in Carlsbad, using a realtor that was recommended to us - Jim Klinge. Fast forward to 2025, we recently had the privilege of selling 2 homes in Carlsbad, CA and didn't hesitate to reach out to Jim and Donna Klinge of Klinge Realty Group to guide us through the sales. The transactions were very different, each with its own unique situation, opportunities and challenges. From start to finish, Donna and Jim helped navigate the pre-sale preparation, the listing, showing of the house, buyer negotiations, the final close and all of the paperwork and decisions in between. What stands out with both transactions is the professionalism of Jim and Donna (and their team), wonderful communication (timely, relevant, concise), their deep understanding of market dynamics (setting realistic expectations), their access to top-notch contractors, and last, their ability to guide us across the finish line successfully. We wouldn't hesitate to use Jim and Donna in the future and highly recommend them for anyone looking to buy or sell a property in North San Diego County.
Jerry Meyer
March 28, 2025
Trustindex verifies that the original source of the review is Google.
We sold a home with Jim and Donna and from beginning to end they were consummate professionals. Their initial walk through the property resulted in a list of items to be repaired or updated. They supplied a list of vendors and job quotes to do the repairs and updates. We originally wanted to sell ‘as is’ and just get it over with. They gave us a selling price for ‘as is’ and options for doing a few updates/repairs to doing it all with the selling price for each option. We agreed to do all they suggested and we sold for the exact price they predicted. For every dollar spent we got back more than $2 back in the selling price. And they got that price in a rising interest rate environment! Donna and Jim are extremely detailed and guide you through ever aspect of the sale. There were no surprises thanks to their guidance. We couldn’t be more pleased with their representation.
Thank you Donna and Jim,
Jerry and Mary
Heather Quejada
March 27, 2025
Trustindex verifies that the original source of the review is Google.
We have known Jim & Donna Klinge for over a dozen years, having met them in Carlsbad where our children went to the same school. As long time North County residents, it was a no- brainer for us to have the Klinges be our eyes and ears for San Diego real estate in general and North County in particular. As my military career caused our family to move all over the country and overseas to Asia, Europe and the Pacific, we trusted Jim and Donna to help keep our house in Carlsbad rented with reliable and respectful tenants for over 10 years.
Naturally, when the time came to sell our beloved Carlsbad home to pursue a rural lifestyle in retirement out of California, we could think of no better team to represent us than Jim and Donna. They immediately went to work to update our house built in 2004 to current-day standards and trends — in 2 short months they transformed it into a literal modern-day masterpiece. We trusted their judgement implicitly and followed 100% of their recommended changes. When our house finally came on the market, there was a blizzard of serious interest, we had multiple offers by the third day and it sold in just 5 days after a frenzied bidding war for 20% above our asking price! The investment we made in upgrades recommended by Jim and Donna yielded a 4-fold return, in the process setting a new high water mark for a house sold in our community.
In our view, there are no better real estate professionals in all of San Diego than Jim and Donna Klinge. Buying or selling, you must run and beg Jim and Donna Klinge to represent you! Our family will never forget Jim, Donna, and their whole team at Compass — we are forever grateful to them.
Lou F
March 27, 2025
Trustindex verifies that the original source of the review is Google.
WeI had the pleasure of working with Klinge Realty Group to sell our home in Carmel Valley, and I cannot recommend them highly enough!
Jim and Donna demonstrated exceptional professionalism, offering expert guidance on market conditions and pricing strategy, which resulted in a quick and successful sale.
Communication was prompt and we were well-informed throughout the entire process.
For anyone looking for a dedicated and knowledgeable real estate team, look no further!
---
William Sams
March 25, 2025
Trustindex verifies that the original source of the review is Google.
Donna and Jim Klinge of Klinge Realty Group have our highest possible recommendation. From Donna and Jim’s first visit to our house through closing their advice and counsel was candid and honest in all dealings. They kept us fully informed throughout the process. The house sold less than three days after listing with a two-week closing. My wife and I have sold several houses during our lives. This was by far the best experience. Klinge Reality is a premium service realtor. You can’t make a better choice for someone to sell your home fast and for top dollar.
Emily Hernandez
December 29, 2024
Trustindex verifies that the original source of the review is Google.
Donna and Jim provided exceptional support and professionalism throughout the entire process. We couldn't have been happier with their efforts. They made our house shine, and thanks to their expertise, it sold above the listing price in the very first weekend! Truly a fantastic experience from start to finish.
Jesus Adrian Sahagun
November 11, 2024
Trustindex verifies that the original source of the review is Google.
This year has been difficult on our family, mainly due to having to sell our home. Thankfully we knew God had a plan for us and working with the Klinge team was a key part of it. It was an obvious decision to work with them again after such an amazing experience when purchasing the same home we needed to sell. The challenge was, how will we do this in so little time with so much going on? Jim and Donna held our hand every step of the way. Whenever an unexpected issue arose they found and provided a solution. Never once did we feel pressured to make a decision and the Klinges were always reassuring after providing the information that the decision was ours to make. Despite the curve balls, they never panicked and exemplified the “can do” attitude, making us feel optimistic and taken care of. Their expertise and professionalism was superb. But of all the reasons to work with the Klinges, the most impactful and valuable is their compassion and genuine care for their clients. We pray that we can one day purchase our forever home and you better believe that Jim and Donna will be representing us - as long as they will have us of course. Thank you again Klinge team! Your execution, experience, and care are unmatched.
SABIHA PASHA
July 23, 2024
Trustindex verifies that the original source of the review is Google.
Jim and Donna were fantastic! Jim understanding my needs, recommending potential places, pointing out the pros and cons of each property was invaluable. Then when the offer was accepted Donna’s organized guidance through the inspections, paperwork etc made the whole process seem effortless.
So grateful that I had them on my side!