by Jim the Realtor | Jan 27, 2021 | 2021, Foreclosure Count, Foreclosures, Foreclosures/REOs, Loan Mods, REOs, REOs Coming to Market

Thanks to KCM for providing this report:
According to the latest report from Black Knight, Inc., a well-respected provider of data and analytics for mortgage companies, 6.48 million households have entered a forbearance plan as a result of financial concerns brought on by the COVID-19 pandemic.
Here’s where these homeowners stand right now:
- 2,543,000 (39%) are current on their payments and have left the program.
- 625,000 (9%) have paid off their mortgages.
- 434,000 (7%) have negotiated a repayment plan and have left the program.
- 2,254,000 (35%) have extended their original forbearance plan.
- 512,000 (8%) are still in their original forbearance plan.
- 116,000 (2%) have left the program and are still behind on payments.
This shows that of the almost 3.72 million homeowners who have left the program, only 116,000 (2%) exited while they were still behind on their payments. There are still 2.77 million borrowers in a forbearance program. No one knows for sure how many of those will become foreclosures. There are, however, three major reasons why most experts believe there will not be a tsunami of foreclosures as we saw during the housing crash over a decade ago:
- Almost 30% of borrowers in forbearance are still current on their mortgage payments.
- Banks likely don’t want to repeat the mistakes of 2008-2012 when they put large numbers of foreclosures on their books. This time, many will instead negotiate a modification plan with the borrower, which will enable households to maintain ownership of the home.
- With the significant equity homeowners have today, most can sell their home, rather than get foreclosed.
Will there be foreclosures coming to the market? Yes. There are hundreds of thousands of foreclosures in this country each year. People experience economic hardships, and in some cases, are not able to meet their mortgage obligations.
Here’s the breakdown of new foreclosures over the last three years, prior to the pandemic:
- 2017: 314,220
- 2018: 279,040
- 2019: 277,520
Through the first three quarters of 2020 (the latest data available), there were only 114,780 new foreclosures. If 10% of those currently in forbearance go to foreclosure, 275,000 foreclosures would be added to the market in 2021. That would be an average year as the numbers above show.
Link to KCM Article
by Jim the Realtor | Dec 5, 2020 | Forecasts, Foreclosure Count, Foreclosures/REOs, Jim's Take on the Market |

Lenders learned their lesson last time – instead of foreclosing on non-payers and risk losing money, it’s better to extend and pretend. There won’t be a time coming where we are flooded with REOs….ever again:
Mortgage forbearances for homeowners affected financially by the pandemic declined slightly over the past week. Black Knight said that there were 200,000 plans scheduled to expire at the end of November, probably accounting for the majority of the 39,000-loan downturn in the various forbearance programs. Another 1 million plans are due to expire at the end of this month.
As of December 1, there were a total of 2.76 million loans remaining in plans, 5.2 percent of the 53 million active mortgages in servicer portfolios and representing $561 billion in unpaid principal. Eighty-one percent of those loans have had their terms extended at some point since March.
The number of GSE (Fannie Mae and Freddie Mac) loans in forbearance dropped by 25,000 during the week, leaving a total of 967,000 homeowners remaining in plans. This is 3.5 percent of the companies’ combined portfolios. FHA and VA loans decreased by 14,000 units to a total of 1.118 million or 9.2 percent of those loans. Loans serviced for bank portfolios or private label securities held steady at 677,000 loans or 5.2 percent of the total. There are 91,000 fewer loans in forbearance plans than one month ago, a 3.2 percent decline.
http://www.mortgagenewsdaily.com/12042020_covid_19_forbearance.asp
~~~~~~~~~~~~~~~~~~~~~~~~~~~~~
by Jim the Realtor | Aug 6, 2017 | Boomer Liquidations, Boomers, CA Homeowners Bill of Rights, Foreclosure Count, Jim's Take on the Market, No-Foreclosure as Banking Policy |

The real estate market in our neighboring Orange County has performed much like San Diego’s. Here, Jon outlines the 12 differences between the bubble days of 2007, and now:
http://www.ocregister.com/2017/08/06/orange-countys-housing-bubble-10-years-later/
These stats show how the game has changed forever – there is no down side if banks are so reluctant to foreclose:
10. Distressed property: Too much debt and too many layoffs pushed many homeowners to the financial brink. Owners rushed to sell as bankers hit the market with their repossessed properties. In June 2007, 13 percent of homes sales were either short sales — banks agreeing to take less than owed — or sales of foreclosed properties. That distressed share of selling would become roughly half of the market during the next five years. But by June 2017, that share settled back to just 7 percent. Fortunately, it’s only a history lesson today. The supply of foreclosures to buy has shrunk from 463 in late June a decade ago to only 27 as this year’s summer began.
11: Warning signs: Nothing screams “danger” more than owners skipping house payments. Ponder what lenders were doing in June 2007 vs. this past June. Default notices, a first step in foreclosure: 1,144 then, 310 today. Auction notices, the official threat to sell: 598 then, 213 today. Actual foreclosures: 281 then (and 1,084 in June 2008) vs. 21 today.
For the bubble to ‘pop’, and prices decline, we would need more than a trickle of distressed sellers who need to sell at whatever price the market would bear. A rash of boomer liquidations might happen, but with reverse mortgages being available, they have other options too.
All ahead full!
by Jim the Realtor | Dec 11, 2014 | Foreclosure Count, Foreclosures, Foreclosures/REOs |
The foreclosure rate of loans originated over the last few years has been LOW!
If the strict underwriting continues, we will only see an occasional foreclosure from now on. We’ll be telling our grandkids about how back in the day there was this guy who ran a video-cam through hundreds of them!

by Jim the Realtor | Dec 11, 2014 | Foreclosure Count, Foreclosures, Foreclosures/REOs |
A certain foreclosure-subscription company is always rattling their sabre about any uptick in notices. The headline for this article is: Early Stage Foreclosure Filings up Nationwide and in Most States:
http://www.mortgagenewsdaily.com/12102014_realtytrac_foreclosures.asp
But with the banks engrossed with loan-modding anyone who can fog a mirror, the only thing that matters is how many actual foreclosures are being completed. Buried deep in the article:
The dip in total filings was due to a 10 percent reduction in bank repossessions or completed foreclosures compared to October. A total of 25,249 properties were taken into bank inventories or REO, down 17 percent from November 2013.
It was the 24th consecutive month in which completed foreclosures were lower on a year-over-year basis.
The national count of completed foreclosures has been dropping for two years straight! Bill showed how delinquencies have been tapering off too:
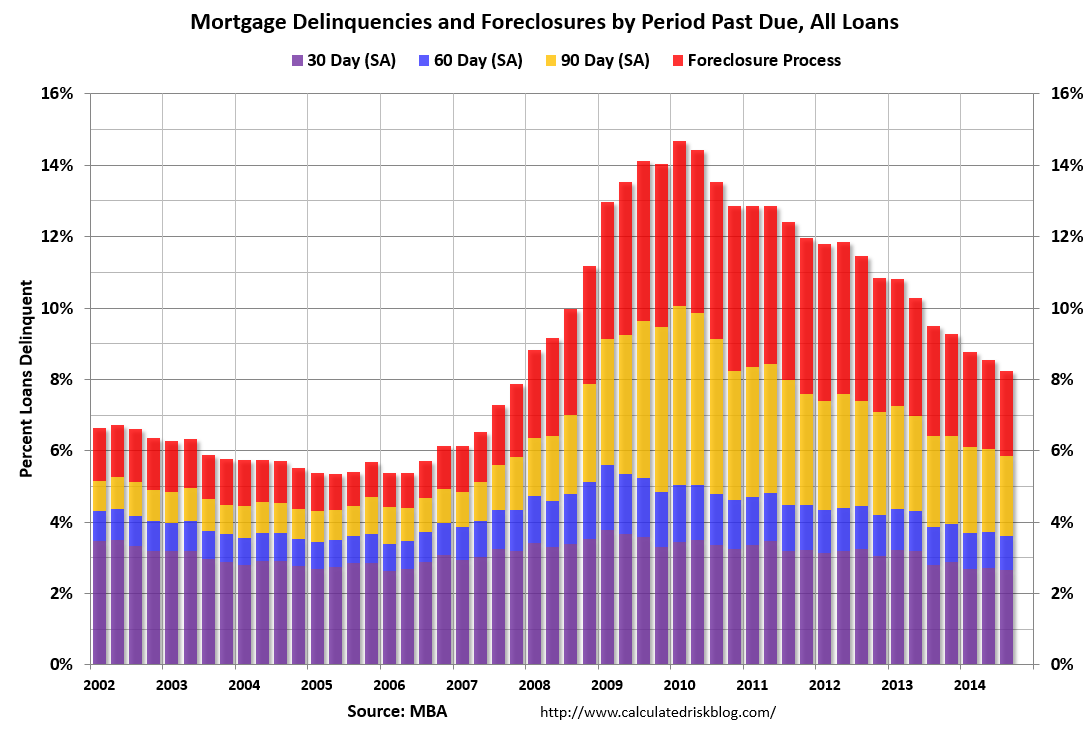
Regardless of how it happened, it looks like a soft landing that will last – at least as long as rates are ultra-low.
Here is how the local San Diego County numbers look:


by Jim the Realtor | Sep 22, 2014 | Foreclosure Count, Foreclosures, Foreclosures/REOs, Jim's Take on the Market |
Reader elbarcosr noted that the latest default list was the longest in recent memory, and wondered if the foreclosure market might be coming back to life.
Let’s hope so!
If the NAR would have been looking out for realtors, they would have insisted that the foreclosure process be allowed to run its course, and clear the market. Instead, they lobbied for foreclosure-rescue programs from the government, and now we have a mushy unknown distressed market – again.
Auction.com is one of the culprits, and we just don’t know what to expect from them, other than mis-direction. Back in June, we saw them try to auction a tenant-occupied home that Chase has owned since 2011:
https://bubbleinfocom.wpenginepowered.com/2014/06/09/reo-auction-contest-results/

It never closed escrow, and has never been on the MLS – instead, it’s another bank-owned property sent to foreclosure purgatory.
Auction.com is also known for conducting price discovery for NationStar on their short sales. Auction.com will market the home and conduct online bidding even though the seller has a written contract with a buyer. Nationstar has a right to sell their short sales for top dollar, and this process helps to expose any shady dealings by the listing agent, but it doesn’t help the reputation of Auction.com.
Though auction.com is the most visible player in the foreclosure market, we can’t judge the trend by their advertising. What matters most is whether the lenders and servicers are going to liquidate any remaining defaulted properties, especially now that prices are up?
Has Nationstar or other servicers been ramping up production in light of the higher prices? Not really – here are the notices issued over the last 12 months in San Diego County:

The foreclosure market has been rife with speculation and intrigue, but we always seem to end up with a nothing-burger. But I’m giving it another chance – I signed up to be a Zillow foreclosure specialist, figuring it can only get better from here. 😆
I’ll be on flood watch!
by Jim the Realtor | May 30, 2014 | Foreclosure Count, Foreclosures, Foreclosures/REOs, No-Foreclosure as Banking Policy |
The decline in foreclosures continues, but the pundits and media don’t really look into it much further. Here is the best quote they could come up with in this article, linked below (hat tip to Stormin’):
“We have now registered two and a half years of continuous decreases in the number of homeowners who are in some stage of the foreclosure process. This consistent decline means fewer Americans are experiencing the distress of delinquency and default,” said Anand Nallathambi, president and CEO of CoreLogic.
http://dsnews.com/foreclosure-inventory-continues-decline-april/
The foreclosure notices and the number of properties actually foreclosed have dropped considerably in San Diego County.


We have had 1,500 to 2,207 notices sent out per quarter over the last 12 months, but only 450-610 properties foreclosed per quarter. The big gap makes you think that the banks/servicers are still throwing loan mods at anyone who wants one, and cancelling any notices soon thereafter.
by Jim the Realtor | Sep 14, 2013 | Foreclosure Count, Jim's Take on the Market, North County Coastal, Shadow Inventory, Short Sales, Short Selling |
Distressed sales have dwindled down to a fraction of the NSDCC market, though they were never a large contributor.
Here are the detached-home sales from the June 1-to-August 31 period:
| Year |
REOs |
SS |
Non-Distressed |
% Distressed |
| 2009 |
48 |
35 |
572 |
13% |
| 2010 |
46 |
69 |
575 |
17% |
| 2011 |
41 |
71 |
610 |
16% |
| 2012 |
45 |
102 |
748 |
16% |
| 2013 |
14 |
42 |
890 |
6% |
There are only 9 active listings of short sales (out of 1,030 total active listings), 29 are marked as contingent currently, plus 4 active listings of REOs.
Should the feds decide to not extend the relief from debt tax past 12/31/13, it should be the final straw and end short sales altogether around here.
For buyers, the hope of getting a deal should be fully extinguished, and just trying to find something suitable for a decent price is a major challenge.
by Jim the Realtor | Aug 30, 2013 | Foreclosure Count, Foreclosures |
The mid-range market isn’t getting much help from defaulted properties – here’s a look at last month’s foreclosure notices sorted by home size and their estimated value:


by Jim the Realtor | Aug 8, 2013 | Foreclosure Count, Foreclosures, North County Coastal, Short Sales, Short Selling
The foreclosure era is winding down, and around the North San Diego County Coastal region, the overall impact has been less than imagined – let’s recap the counts of distressed-sales:
| Year |
Short-Sale |
REO |
Non-REO/SS |
Distressed-Sales % |
| 2008 |
5 |
30 |
2,002 |
2% |
| 2009 |
110 |
164 |
1,949 |
12% |
| 2010 |
216 |
199 |
2,045 |
17% |
| 2011 |
278 |
190 |
2,094 |
18% |
| 2012 |
356 |
162 |
2,634 |
16% |
| 2013 (YTD) |
103 |
30 |
1,866 |
7% |
| Totals |
1,068 |
775 |
12,590 |
13% |
Short sales have had more negative impact on average pricing than REOs lately, mostly due to realtor fraud:
| Year |
Short-Sale |
REO |
Non-REO/SS |
| 2008 |
$262/sf |
$284/sf |
$440/sf |
| 2009 |
$295/sf |
$284/sf |
$408/sf |
| 2010 |
$318/sf |
$292/sf |
$393/sf |
| 2011 |
$292/sf |
$293/sf |
$393/sf |
| 2012 |
$284/sf |
$289/sf |
$396/sf |
| 2013 (YTD) |
$277/sf |
$323/sf |
$427/sf |
| Totals |
$293/sf |
$297/sf |
$409/sf |
Hopefully this embarassing chapter in realtor history will be over soon.


