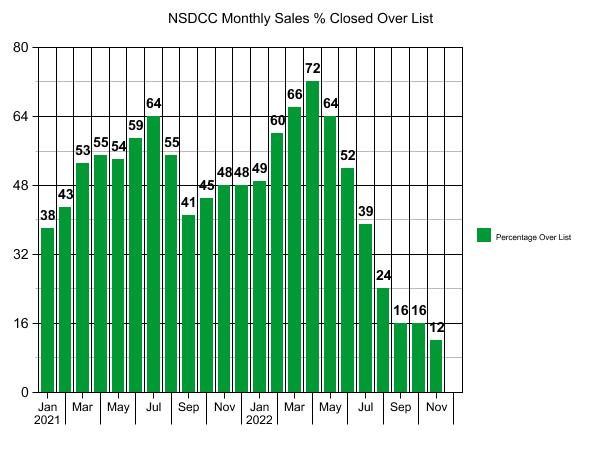
Only 12% of the houses sold last month actually closed over their list price, which sounds normal.
There were 51 of the 115 of the sales (44%) that closed for $100,000+ BELOW their last list price.
The count of 51 broke down to 17 of 19 sales over $3,000,000, and 34 of 96 sales under $3,000,000 – where knocking off $100,000+ off the list price is fairly significant. Either realtors aren’t that great about their pricing, or they wander into lowball territory and get their head tore off.
The median days-on-market was 28 days, and the average was 41 days.
About half wandered into lowball territory, and about half sold for $100,000+ below their list price – there is a direct connection. People need to figure out how to sell the house in the first couple of weeks of being on the market, or face the same consequences in 2023.
~~~~~~~~~~~~~~~~~~~~~~~~~~~~~~~~~~~~~~~~~~~~~~~
NSDCC Average and Median Prices by Month
Month
# of Sales
Avg. LP
Avg. SP
Median LP
Median SP
Feb
224
$2,298,797
$2,257,334
$1,719,500
$1,758,000
March
252
$2,295,629
$2,260,524
$1,800,000
$1,825,000
April
357
$2,396,667
$2,403,962
$1,799,900
$1,828,000
May
300
$2,596,992
$2,581,715
$1,900,000
$1,994,500
June
348
$2,509,175
$2,537,953
$1,900,000
$1,967,500
July
311
$2,421,326
$2,442,738
$1,795,000
$1,855,000
Aug
268
$2,415,075
$2,438,934
$1,897,000
$1,950,000
Sept
278
$2,479,440
$2,445,817
$1,899,000
$1,987,500
Oct
248
$2,754,470
$2,705,071
$1,899,000
$1,899,500
Nov
199
$2,713,693
$2,707,359
$1,999,000
$2,100,000
Dec
189
$2,686,126
$2,664,391
$1,985,000
$2,157,500
Jan
140
$2,828,988
$2,855,213
$2,234,944
$2,240,000
Feb
158
$3,063,331
$3,108,907
$2,149,500
$2,386,500
Mar
207
$3,247,251
$3,337,348
$2,400,000
$2,625,000
Apr
227
$3,190,161
$3,251,604
$2,350,000
$2,550,000
May
215
$2,943,657
$3,032,977
$2,350,000
$2,500,000
Jun
190
$2,864,089
$2,872,690
$2,297,500
$2,350,000
Jul
155
$2,889,612
$2,832,080
$2,299,900
$2,300,000
Aug
164
$2,933,243
$2,830,855
$2,200,000
$2,150,000
Sep
135
$2,650,642
$2,560,314
$2,149,000
$2,040,000
Oct
124
$3,090,320
$2,971,211
$2,272,500
$2,212,500
Nov
115
$2,581,790
$2,459,974
$1,950,000
$1,875,000
In October, when the average and median sales price spiked, it didn’t mean your home’s value went up – the homes sold that month had a median square footage that was 12% higher than in September. Similarly, the group of homes that sold in November had a median sf that was 8% smaller than in October.
But if you do want to make a big deal of these sales prices, they are similar to those in July, 2021.
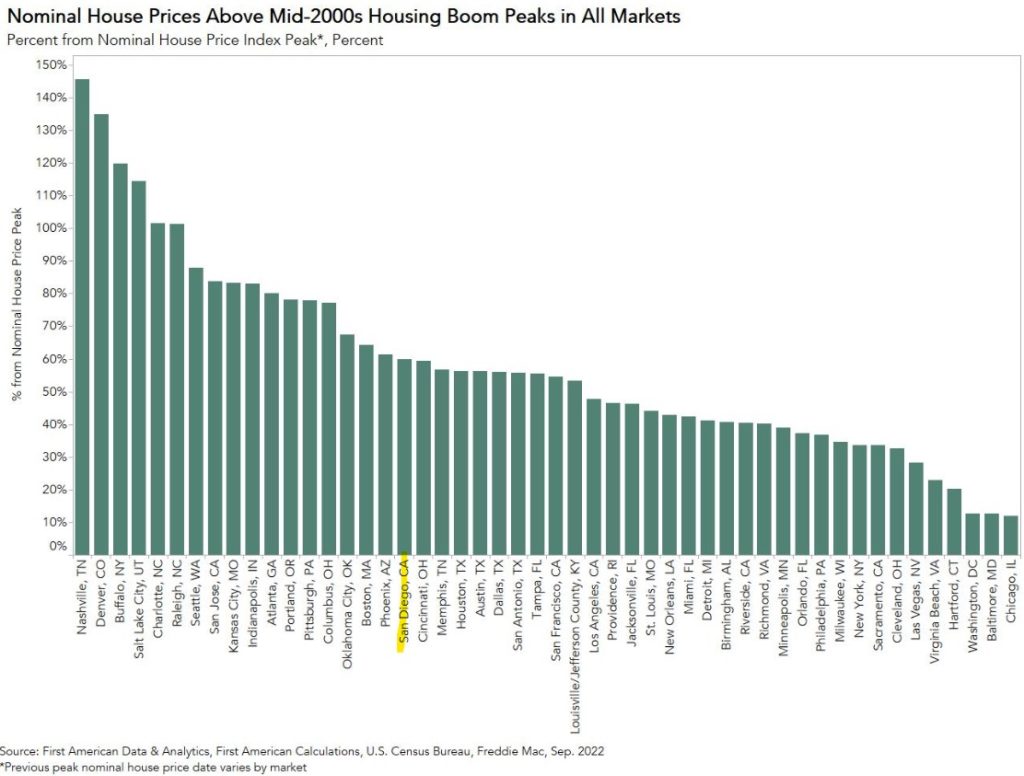
San Jose is ahead of us, and San Francisco is about the same. As long as the Bay Area remains an obvious feeder into the better-valued San Diego-Carlsbad market, we’ll be fine.
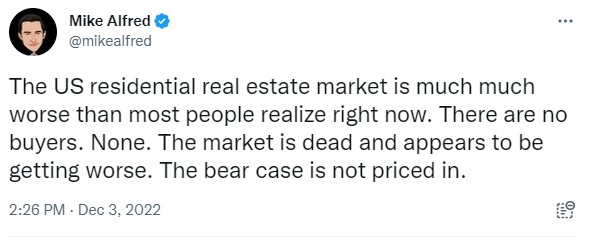
This is the first time that social media has had the chance to influence the real estate market, and as you can guess, it ain’t pretty. There are no guardrails or qualifying of the author’s opinion, and as a result, people get away with saying whatever they want.
Logically, the conscious mind will remember that real estate is local, and that you can’t believe what you read from strangers on the internet. However, if you listen to friends and family, and they have been influenced by social media, it can still play a role in your decision-making process.
It’s why we will likely get off to a slow start in 2023 – people won’t believe it, until they see it. Plus, if they don’t see it by the end of March or April, then they might even give up prematurely (buyers and sellers).
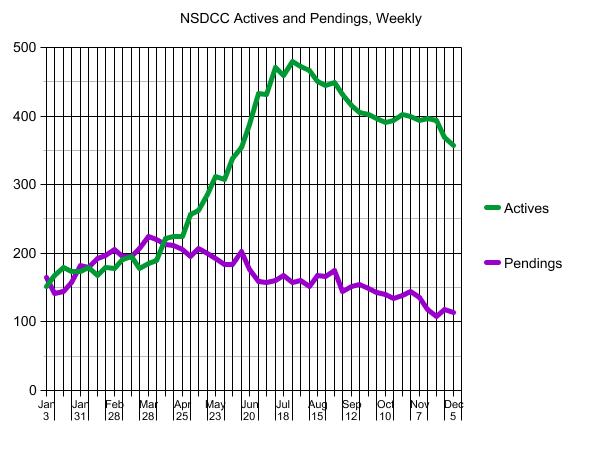
But we need to adjust our expectations of the inventory – it’s going to be lower than ever.
Two likely scenarios:
The inventory of superior homes will be extremely tight. Homeowners are very reluctant to give up a trophy property, and if they do, they sure want top dollar. There weren’t that many sold during the frenzy, and now that they’ve ‘heard’ that the market is bad, there could be even fewer quality choices for buyers.
The inventory of inferior homes will get picked over, with most buyers in shock over how little the pricing has adjusted for the scratch-and-dent homes. Those listings will languish on the market as the sellers patiently hope that the ‘right’ buyer is coming tomorrow, or some day soon. But once a listing has gone unsold for more than a month, we know what happens – it triggers the lowball offers.
The last two Januarys we have had contests on how many houses between La Jolla and Carlsbad will be listed for sale. In both cases, the actual counts were much lower than most of the guesses. We will do another contest next month, and it should give us a clue on what to expect for the selling season!
But we haven’t had the definitive dump on pricing that would have made it easier on the buyers, so the interpretations of the market’s direction next year will be scattered. Many will think there is more downdraft to go, and wait it out. Some buyers will think prices got more attractive, and if they can just lowball a seller out of another 10% it would be about right. Some will be able to land a top-quality home for a price they can live with – and together, these three groups will make the market in 2023.
A few more articles like this should cause buyers to question whether pricing will get any better:
Today, the Data & Analytics division of Black Knight released its latest Mortgage Monitor Report, based upon the company’s industry-leading mortgage, real estate and public records datasets. Despite home price corrections continuing in many markets nationwide driven by tight affordability and higher rates, the pace of price declines has slowed measurably over the past two months. As Black Knight Data & Analytics President Ben Graboske explains, what would ordinarily be an environment ripe for steep declines in home prices has been offset somewhat by stagnant levels of for-sale inventory.
“We’ve now seen four consecutive months of home price pullbacks at the national level,” said Graboske. “But after a couple of significant drops earlier in the summer, the pace of cooling has slowed considerably, with October’s non-seasonally adjusted drop of just 0.43% the smallest decline yet. Though seemingly counterintuitive, the much higher rate environment may be limiting the pace of price corrections due to its dampening effect on inventory inflow and subsequent gridlock in home sale activity. While the median home price is now 3.2% off its June peak – down 1.5% on a seasonally adjusted basis – in a world of interest rates 6.5% and higher, affordability remains perilously close to a 35-year low. Add in the effects of typical seasonality and one might expect a far steeper correction in prices than we have endured so far, but the never-ending inventory shortage has served to counterbalance these other factors. Indeed, the volume of new for-sale listings in October was 19% below the 2017-2019 pre-pandemic average. This marks the largest deficit in six years outside of March and April 2020 when much of the country was in lockdown – with the overall market still more than half a million listings short of what we’d consider ‘normal’ by historical measures.
I hope it’s obvious that it matters who you hire as your realtor – we’re not all the same. It didn’t matter much during the frenzy, because even an agent who kicked the crap out of the sale could still find their way to close over the list price.
But not now.
In today’s market, sellers risk getting lowballed, or not selling at all.
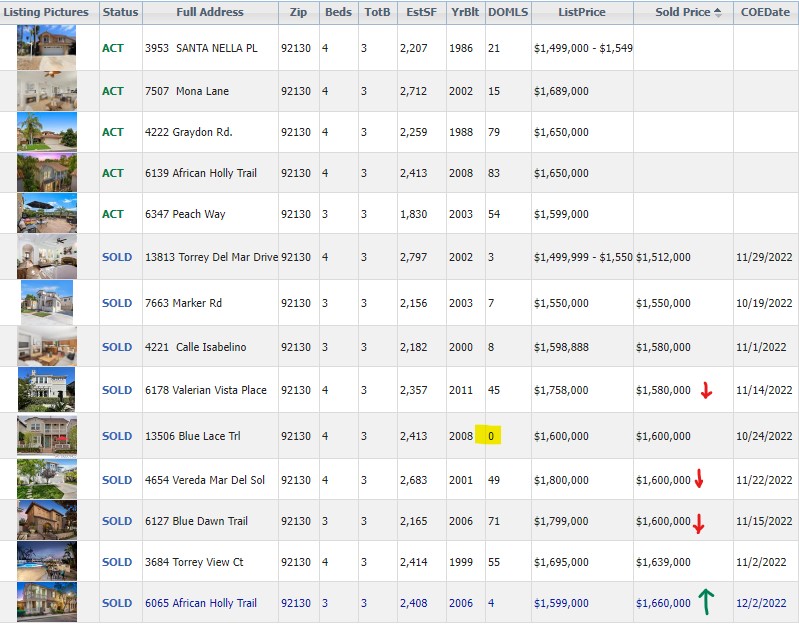
After one lowball off-market sale and three unbelievable 10% dumps on price, the entry-level market in Carmel Valley looked like it was in freefall. The sellers and I had already decided to list for $1,675,000 – and I advertised it here – but the next day, two of the dumpers closed escrow. The other listing on the street had been unsold since they had listed for $2,150,000 on June 24th, and they had just lowered their price another $100,000 to $1,650,000 on the same Thursday.
I rallied with my clients and they agreed to my strategy of pricing attractively, so we changed our list price and entered the market at $1,599,000 with the intent to sell the first weekend.
But our list price wasn’t way under market – no, it was full retail, based on those most recent sales.
What made the sale was the combined package of a turnkey property with an attractive price that was well-presented and pushed hard by the agent (me). Once I received three offers, I pitted them against each other and bid it up to $61,000 over my list price on the weekend before Thanksgiving!
The buyer who purchased my listing also bought the house on Valerian Vista (which was five years newer and the lot was 42% larger) in the similar and neighboring tract called Manzanita Trails. Yet the same guy was willing to pay $80,000 more for my listing and close in two weeks.
He had just lowballed a better house by $178,000 and it worked.
Yet, he was willing to buy my listing for $80,000 more than he had just paid the same week?
It’s a great example of how critical it is to hire an agent who has an effective strategy to sell your house.
Yesterday, I offered my take on pricing for the San Diego 2023 real estate market.
For those who don’t watch videos, I said the overall median sales price will be down 3% next year, with the superior-home sales causing a +5% median sales price among themselves. Where the line is drawn between superior and inferior homes will be interesting!
In this episode of the Top of Mind podcast, Mike Simonsen sits down with Rick Palacios Jr., Director of Research and a Managing Principal at John Burns Real Estate Consulting, to talk about what to expect in the real estate market in 2023.
Rick discusses the company’s latest research on homebuilder sentiment, shares their latest forecast for home prices and the economy, and talks about some secret signals to watch for changes in the market.
About Rick Palacios Jr.
Rick Palacios Jr. is the Director of Research and a Managing Principal at John Burns Real Estate Consulting, where he oversees all research pertaining to the US economy, for-sale housing, and rental markets.
Rick has 15 years of experience in residential real estate and economic research, originally joining John Burns Real Estate Consulting in 2006 and then rejoining the company in 2014 after working as a home builder Equity Research Associate at Morgan Stanley in New York. He has also worked as an Analyst at the Milken Institute, an economic think tank.
Rick holds a BA from the University of California, Irvine, and an MS in real estate economics and finance from the London School of Economics.
Here’s a glimpse of what you’ll learn:
Why new home construction might accelerate the housing market slump
How much home prices are likely to decline in the next two years
The leading indicators (and secret signals!) to watch for changes in the market
Yesterday a guy said he wasn’t interested in anecdotal evidence and just wanted to see the data. But we were talking about the buyer demand in 2023, of which we have no data yet.
In addition, the data we do have doesn’t have to repeat itself or be a trend, because every month we have different houses selling. It’s not like the stock indices that measure the exact same stock every day – in real estate, it’s a new set of variables every month. It’s a miracle that each month looks as similar as it does!
But for those who want the numbers, here you go!
NSDCC (La Jolla to Carlsbad) Monthly Sales Stats
Date
# of Sales
Median Sales Price
Median SF
Avg DOM
Avg. $/sf
Med. $/sf
Jun
190
$2,350,000
2,710sf
23
$947/sf
$837/sf
Jul
155
$2,300,000
2,798sf
28
$925/sf
$830/sf
Aug
165
$2,150,000
2,642sf
36
$973/sf
$804/sf
Sep
135
$2,040,000
2,600sf
38
$910/sf
$793/sf
Oct
124
$2,212,500
2,909sf
43
$922/sf
$784/sf
Nov
109
$1,860,000
2,581sf
42
$821/sf
$739/sf
For the record, here’s the summary from June to November:
Sales: –43%
Median Sales Price: –21%
Average Days-on-Market: +83%
Average $/sf: –13%
Median $/sf: –12%
The stats are straight off the SD MLS, and I’m not sure how they calculate their Median $/sf because it’s not the median sales price divided by the median sf – but their numbers are close to that.
There has been a steady downdraft in pricing, led by sellers who stay on the market for 30+ days and then take a lowball offer. As long as listings aren’t fully prepared, aren’t priced attractively, and are hard to show, the downward-pricing trend will continue.
Ideally, you want to sell your home in the first week or two that it is on the market.