For retirees looking to undergo extreme downsizing, a tiny home might be the answer. The average tiny home measures 186 square feet. That’s a fraction of the size of a traditional house. But limited space offers unique benefits, including lower utility bills and easier upkeep. Retirees are taking notice. Nearly 30% of tiny home residents are between the ages of 51 and 70, according to a 2015 survey conducted by TheTinyLife.com, a tiny home website.
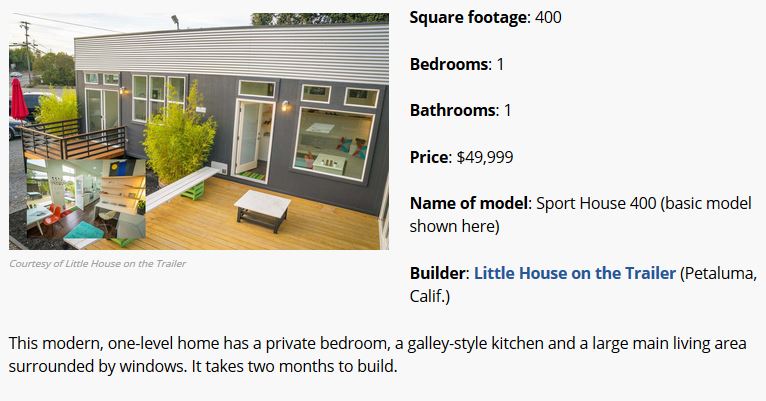
Cost makes tiny homes particularly appealing to retirees living on fixed incomes. The average price to build a tiny home yourself is just $23,000, according to TheTinyLife.com. You’ll pay more to have someone build it for you — the 10 tiny homes for retirees we feature start at $45,000 — but the price tag will still be far less than what you’d pay for a full-size home. In 2015, the median sale price of a new traditional house was $296,200, according to the U.S. Census Bureau. As for mortgages, 68% of tiny home owners don’t have them, while just 29% of all U.S. homeowners are living mortgage-free.
If you’re intrigued by the prospect of retiring to a tiny home, be sure to find one designed to suit the needs of retirement-age owners. Look for safety features such as slip-resistant floors, and avoid sleeping lofts with ladders. Also weigh the pros and cons of a mobile tiny home that can be moved around on a trailer versus one placed on a permanent foundation on land you own.
Mortgage rates calmed down yesterday, retreating back to 4.125%, but with all the hysteria about Trump, things sure seem unsettled.
How will we know if our local market is getting into trouble?
Watch three things:
Inventory/sales relationship
High-end market
Actives/pendings ratio
Apply these to your local micro-market, because results will vary by neighborhood. I started this blog in September, 2005, when it was becoming obvious on the street that change was afoot.
We had a great lesson in 2006 – the inventory took off, and sales plunged:
La Jolla-to-Carlsbad, Jan – Nov
Year
New Listings
Closed Sales
Median Sales Price
2003
5,002
3,609
$725,000
2004
4,955
3,121
$945,000
2005
5,290
2,808
$1,000,000
2006
5,829
2,388
$985,000
2007
5,198
2,339
$1,000,000
2008
5,030
1,905
$900,000
2009
4,811
1,984
$810,000
2010
5,066
2,256
$830,000
2011
4,994
2,342
$828,414
2012
4,246
2,860
$829,200
2013
4,653
3,007
$950,000
2014
4,541
2,599
$1,022,000
2015
4,715
2,771
$1,098,000
2016
4,807
2,761
$1,170,000
The 2016 inventory has increased, but it’s more in line with the average now – which, excluding 2006, is 4,869 per year. Sales aren’t plunging either, so we’re in good shape, at least for now.
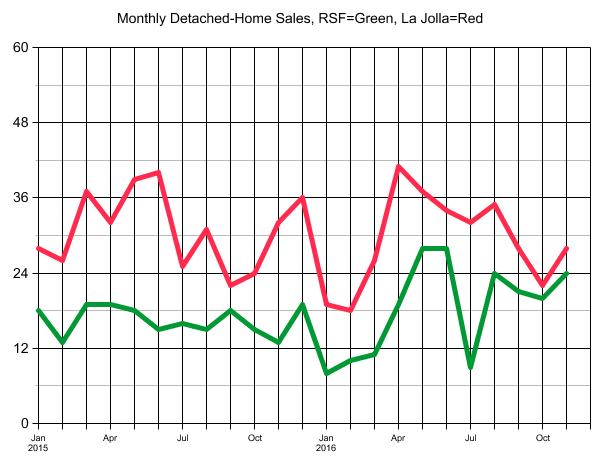
How about the high-end market?
Sales are down slightly in La Jolla this year, compared to 2015 (320 vs. 336), but the Ranch is hopping! There have been 13% more sales in the 92067 this year, compared to 2015, and sales in August-through-November are up 46% year-over-year!
I’ll come back to the Actives/Pendings ratio, but at least we have guideposts that look relatively health today!
How long can the hot market continue? It’s up to the sellers. If they are willing to sell for what the market will bear, we’ll keep rolling because there are lots of people who want to buy a house – it’s just a matter of price.
If the auction format gets more popular, it would solve everything.
The price surge has locked many first time buyers out of the market. But it has been a boon to owners, many of whom regained equity after being underwater on their mortgages following the Great Recession crash.
The gains have been seen across Southern California, though inland areas remain further behind. In October, the median price — the point where half of homes sold for more and half for less — rose in all six counties compared to a year earlier, CoreLogic said.
In Los Angeles County, the median jumped 7.4% to $525,000; in Orange, 9% to $655,000; in Ventura, 7% to $535,000; in San Bernardino, 9.6% to $285,000; in Riverside, 8.1% to $335,000; and in San Diego,11.1% to $507,500.
The sustained price gains have real estate agents, buyers and sellers wondering how long the hot market can continue.
Most economists say price increases should be smaller next year as families struggle to make larger offers on homes. Wage growth simply isn’t keeping up with the rising cost of housing, they say.
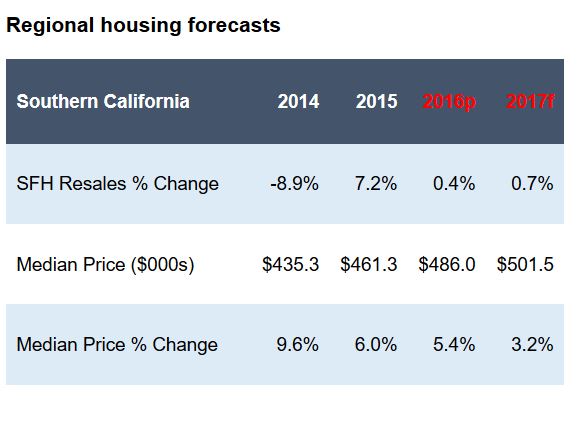
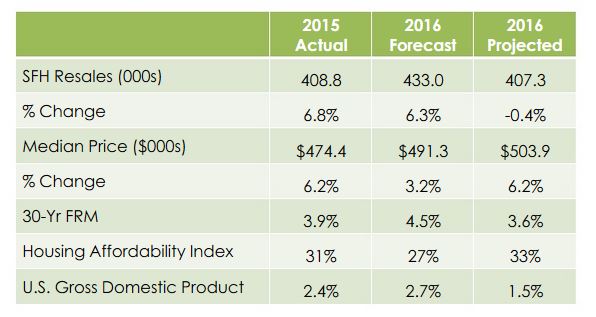
Following a dip in home sales in 2016, California’s housing market will post a nominal increase in 2017, as supply shortages and affordability constraints hamper market activity, according to the “2017 California Housing Market Forecast,” released today by the C.A.R.
The C.A.R. forecast sees a modest increase in existing home sales of 1.4 percent next year to reach 413,000 units, up slightly from the projected 2016 sales figure of 407,300 homes sold. Sales in 2016 also will be virtually flat at 407,300 existing, single-family home sales, compared with the 408,800 pace of homes sold in 2015.
“Next year, California’s housing market will be driven by tight housing supplies and the lowest housing affordability in six years,” said C.A.R. President Pat “Ziggy” Zicarelli. “The market will experience regional differences, with more affordable areas, such as the Inland Empire and Central Valley, outperforming the urban coastal centers, where high home prices and a limited availability of homes on the market will hamper sales. As a result, the Southern California and Central Valley regions will see moderate sales increases, while the San Francisco Bay Area will experience a decline as home buyers migrate to peripheral cities with more affordable options.”
C.A.R.’s forecast projects growth in the U.S. Gross Domestic Product of 2.2 percent in 2017, after a projected gain of 1.5 percent in 2016. With California’s nonfarm job growth at 1.6 percent, down from a projected 2.3 percent in 2016, the state’s unemployment rate will reach 5.3 percent in 2017, compared with 5.5 percent in 2016 and 6.2 percent in 2015.
The average for 30-year, fixed mortgage interest rates will rise only slightly to 4.0 percent in 2017, up from 3.6 percent in 2016, but will still remain at historically low levels.
The California median home price is forecast to increase 4.3 percent to $525,600 in 2017, following a projected 6.2 percent increase in 2016 to $503,900, representing the slowest rate of price appreciation in six years.
“With the California economy continuing to outperform the nation, the demand for housing will remain robust even with supply and affordability constraints still very much in evidence. The net result will be California’s housing market posting a modest increase in 2017,” said C.A.R. Vice President and Chief Economist Leslie Appleton-Young. “The underlying fundamentals continue to support overall home sales growth, but headwinds, such as global economic uncertainty and deteriorating housing affordability, will temper stronger sales activity.”
Mortgage rates spiked abruptlytoday, bringing them to the highest levels in well over 2 years. The average lender is now quoting conventional 30yr fixed rates of 4.25% on top tier scenarios with more than a few already up to 4.375%. You’d have to go back to the summer of 2014 to see a similar mortgage rate landscape.
The impact on the market, in simple terms:
Fewer prices will seem attractive, but the obvious ones will draw a crowd. Buyers will be pickier, and will wait longer to see if sellers will come down.
For the few that are actually affected, higher rates with a lower cap sounds like a wash – and if there are other changes/improvements of other taxes, any change in the MID would be negligible.
But the impact on homebuyer psychology could dampen the demand.
For more than a century, homeownership has come with a small bonus: The mortgage interest deduction.
It allows borrowers to deduct the interest paid on their home loans from their income taxes. Real estate agents, homebuilders and mortgage lenders have long used it as a selling point. Every so often it comes up in debate, but it is so popular that lawmakers are more than a little bit afraid to touch it. The future Trump administration apparently is not.
“We’ll cap the mortgage interest, but we’ll allow some deductibility,” said Steve Mnuchin on CNBC Wednesday after confirming that has been asked by President-elect Donald Trump to head the Treasury Department.
The mortgage interest deduction is already capped at loans up to $1 million if you’re married and filing jointly, and at $500,000 if you file separately. That said, the median price of a home in the United States is just more than $200,000, so not a lot of people make it to that cap. The vast majority (84%) of those who do benefit earn more than $100,000 a year and are not the most cost-burdened homeowners.
The deduction is very popular, but it benefits far fewer taxpayers than one might think. The current homeownership rate is around 62 percent, but of those homeowners, one-third do not have a mortgage. They own their homes outright, so the deduction would not apply to them.
Some homeowners, mainly middle- and lower-income families either don’t pay federal income taxes or don’t itemize, so the deduction wouldn’t apply to them either. Only about 40 million (or 22.5 percent) of the 173 million households in the U.S. benefit from the mortgage interest deduction, according to the Tax Policy Center.
For those who do itemize, here’s how the math works: Let’s say you have a $500,000 30-year-fixed mortgage at 4.5 percent, and you’re in the 33 percent tax bracket. In the first year of your loan, the deduction saves you just more than $10,000 in taxes.
If the Trump administration caps deductions at even $100,000, as Mnuchin suggested, that would not hit most borrowers because on that $500,000 (which is more than most loans in general) the total annual interest payment was about $23,000. Granted, homeowners may have other deductions, medical expenses, charitable, religious or otherwise, but most would not make it to $100,000 even with the mortgage.
Despite the small number of borrowers a cap would affect, real estate industry leaders oppose any changes, especially in an environment where they are trying to convince young millennials that a home is a good investment.
There was one more business day last month than there was in November, 2015, but it’s impressive to just keep up with previous years when we are at higher price points.
NSDCC November Sales
Year
# of Sales
Median SP
Average $/sf
2012
241
$885,000
$415/sf
2013
187
$1,030,000
$474/sf
2014
172
$1,007,450
$491/sf
2015
193
$1,187,500
$520/sf
2016
211
$1,252,840
$546/sf
The big difference is on the lower end.
In November, 2012, there were 37 regular houses sold under $600,000, and last month there were only four – and they were of the patio-home variety.