

Mortgage rates calmed down yesterday, retreating back to 4.125%, but with all the hysteria about Trump, things sure seem unsettled.
How will we know if our local market is getting into trouble?
Watch three things:
- Inventory/sales relationship
- High-end market
- Actives/pendings ratio
Apply these to your local micro-market, because results will vary by neighborhood. I started this blog in September, 2005, when it was becoming obvious on the street that change was afoot.
We had a great lesson in 2006 – the inventory took off, and sales plunged:
La Jolla-to-Carlsbad, Jan – Nov
| Year | |||
| 2003 | |||
| 2004 | |||
| 2005 | |||
| 2006 | |||
| 2007 | |||
| 2008 | |||
| 2009 | |||
| 2010 | |||
| 2011 | |||
| 2012 | |||
| 2013 | |||
| 2014 | |||
| 2015 | |||
| 2016 |
The 2016 inventory has increased, but it’s more in line with the average now – which, excluding 2006, is 4,869 per year. Sales aren’t plunging either, so we’re in good shape, at least for now.
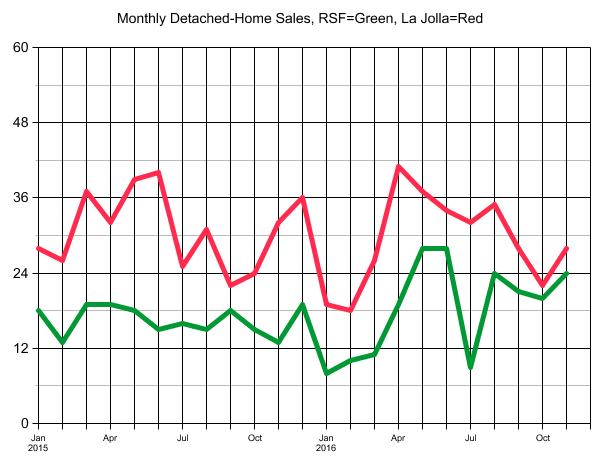
How about the high-end market?
Sales are down slightly in La Jolla this year, compared to 2015 (320 vs. 336), but the Ranch is hopping! There have been 13% more sales in the 92067 this year, compared to 2015, and sales in August-through-November are up 46% year-over-year!
I’ll come back to the Actives/Pendings ratio, but at least we have guideposts that look relatively health today!


0 Comments