More Workbench

Kayla on the left, me on the right.

Kayla on the left, me on the right.

We lost Dusty Hill today, bass player of ZZ Top. He was 72 years old. I had the Tres Hombres 8-track blaring through the desert sky back in the 70s, and I saw them play at Feyline Fields in Tempe around 1976 when they headlined a 5-band, day-long bash. So this is my ZZ, with Dusty on co-lead-vocals:

Another reflection on the current state of the local market.
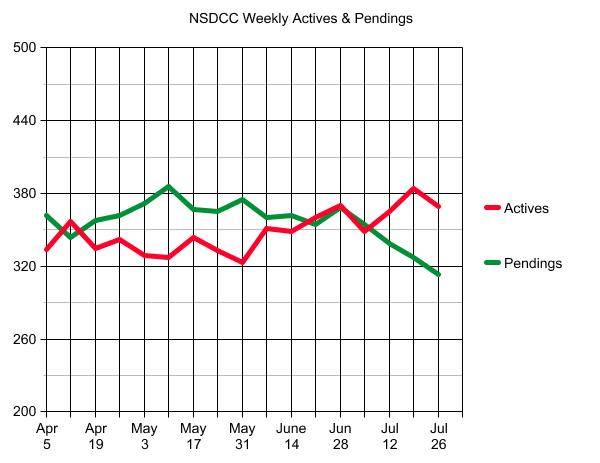
While it feels a little softer and active-inventory counts have risen (though still well below previous years), the demand has been voracious, and it would need to cool off dramatically before any panic sets in.
There have been 100+ higher-end sales in EACH of the last three months, when, prior to the pandemic, we never had more than 48 in a month!
The number of sales is a leading indicator. Let’s keep an eye on them!
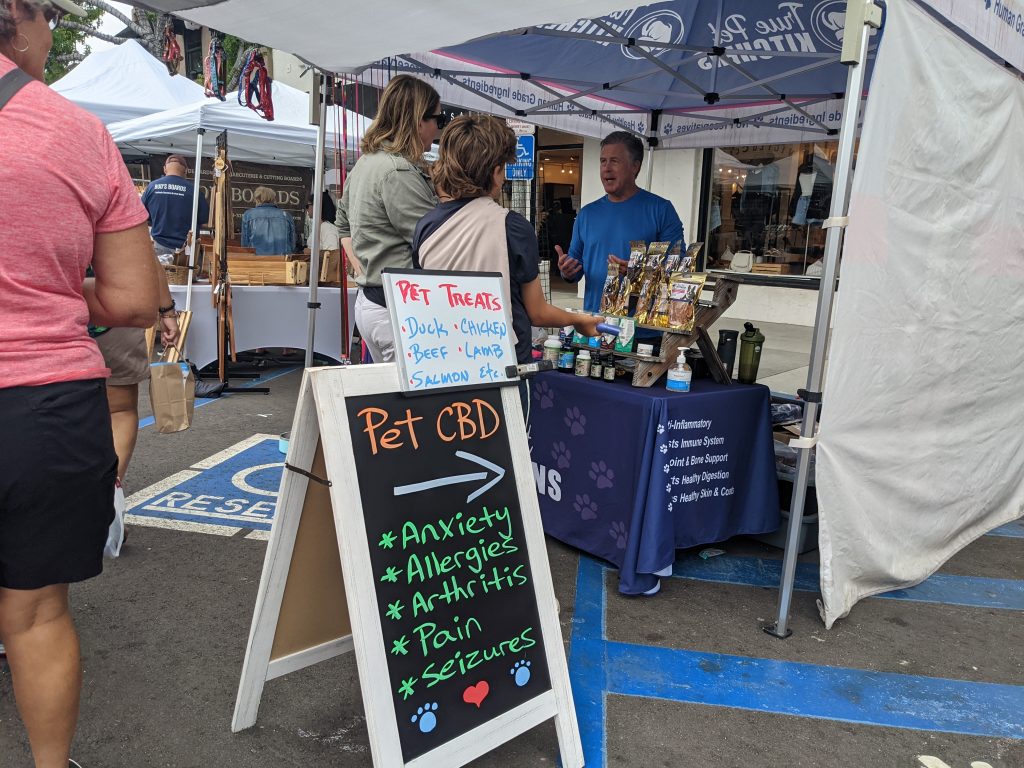
I haven’t been to the street faire in years and I was somewhat surprised to see that is hasn’t gotten all commercialized – it’s mostly just a bunch of mom-and-pop enterprises selling their wares:
Phoenix edged us out again for the top spot in May, but the San Diego CSI went up 12.4% between February and May, which looks like a record for four months of appreciation – and at these prices!
San Diego Non-Seasonally-Adjusted CSI changes
| Observation Month | |||
| Jan ’20 | |||
| Feb | |||
| Mar | |||
| Apr | |||
| May | |||
| June | |||
| July | |||
| Aug | |||
| Sep | |||
| Oct | |||
| Nov | |||
| Dec | |||
| Jan ’21 | |||
| Feb | |||
| Mar | |||
| Apr | |||
| May |
“Housing price growth set a record for the second consecutive month in May 2021,” says Craig J. Lazzara, Managing Director and Global Head of Index Investment Strategy at S&P DJI. “The National Composite Index marked its twelfth consecutive month of accelerating prices with a 16.6% gain from year-ago levels, up from 14.8% in April. This acceleration is also reflected in the 10- and 20-City Composites (up 16.4% and 17.0%, respectively)”.
The market’s strength continues to be broadly-based: all 20 cities rose, and all 20 gained more in the 12 months ended in May than they had gained in the 12 months ended in April. Prices in 18 of our 20 cities now stand at all time highs, as do the National Composite and both the 10- and 20-City indices.
“A month ago, I described April’s performance as “truly extraordinary,” and this month I find myself running out of superlatives. The 16.6% gain is the highest reading in more than 30 years of S&P CoreLogic Case-Shiller data. As was the case last month, five cities – Charlotte, Cleveland, Dallas, Denver, and Seattle – joined the National Composite in recording their all-time highest 12-month gains. Price gains in all 20 cities were in the top quartile of historical performance; in 17 cities, price gains were in top decile”.
“We have previously suggested that the strength in the U.S. housing market is being driven in part by reaction to the COVID pandemic, as potential buyers move from urban apartments to suburban homes. May’s data continue to be consistent with this hypothesis. This demand surge may simply represent an acceleration of purchases that would have occurred anyway over the next several years. Alternatively, there may have been a secular change in locational preferences, leading to a permanent shift in the demand curve for housing. More time and data will be required to analyze this question”.
“Phoenix’s 25.9% increase led all cities for the 24th consecutive month, with San Diego (+24.7%) and Seattle (+23.4%) close behind. As was the case last month, prices were strongest in the West (+19.9%) and Southwest (+19.8%), but every region logged double-digit gains.”
Ok, ok, the prices have gone nuts and you’re wondering what you can buy if you just go a little further out.
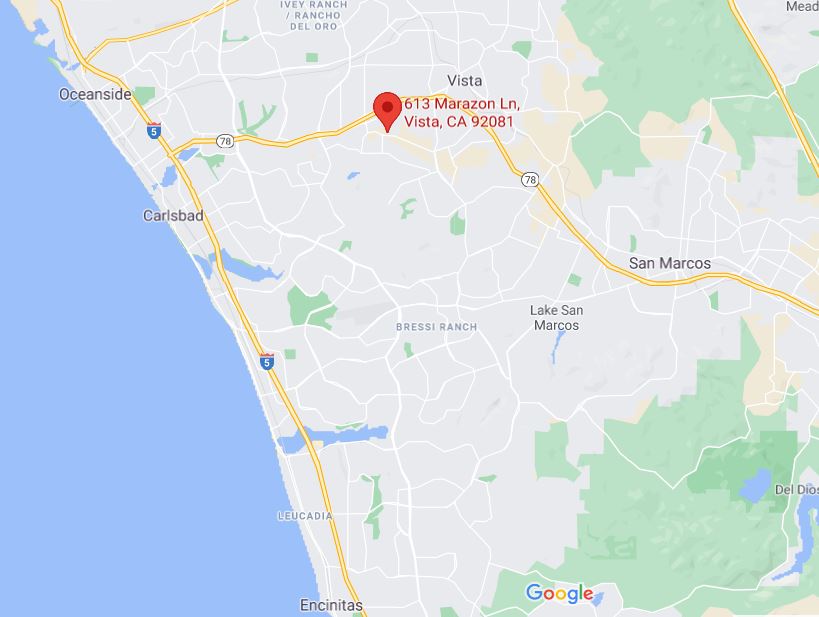
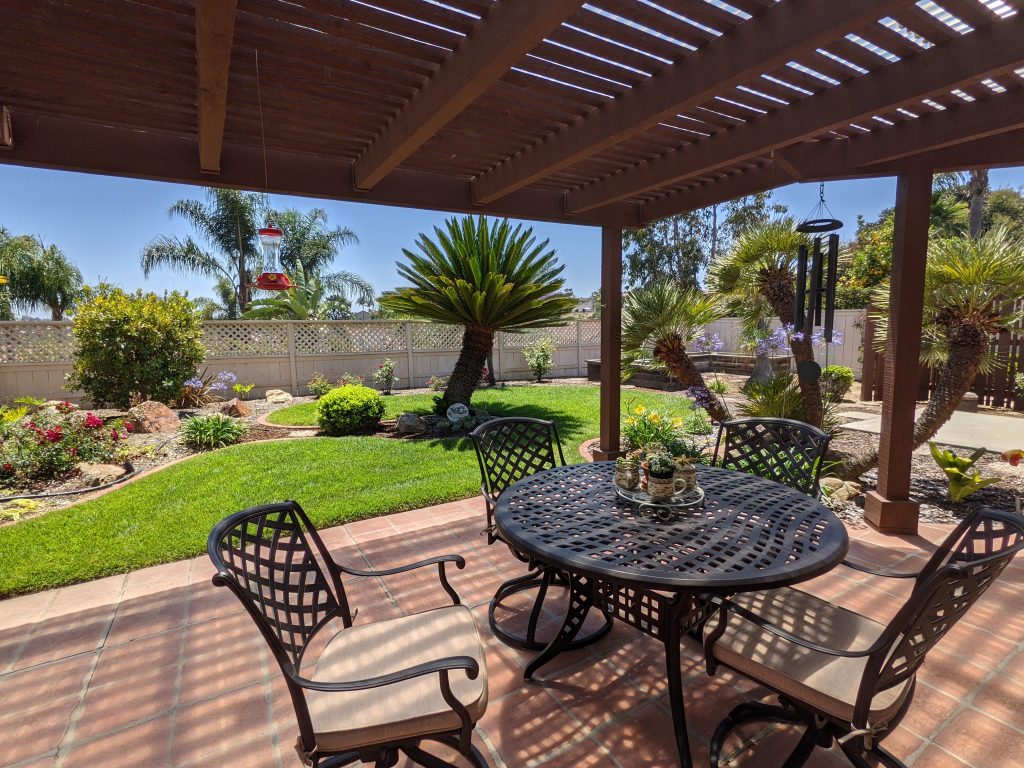
Here’s an estate-like property on a half acre in the rural area of Vista just outside of Shadowridge that’s still south of the 78 so it’s closer than you might think.
It’s a 3br/2.5ba, 2,630sf house on a half-acre with pool that listed for $1,099,000. Sounds reasonable, right?
It closed for $1,240,000 on July 7th.
Last week we saw the big dropoff in the Under-$1,000,000 range as the pricing of low-end homes between La Jolla and Carlsbad shot upward. Today there are four houses for sale under $1M.
Here is the $1,000,000 to $1,500,000 range:
On July 29, 2019, we had 192 active listings (avg. $494/sf) and 120 pending listings.
Last year at this time we had 122 active listings (avg. $544/sf) and 169 pendings.
Today we have 45 actives (avg. $693/sf) and 85 pendings.
The number of active listings has collapsed, dropping 77% in two years. No wonder the average cost-per-sf has increased 40% during the same period!
~~~~~~~~~~~~~~~~~~~~~~~~~~~~~~~~~~~~~~~~~~~~~~~

You may not have the budget for floor-to-ceiling renovations but that doesn’t mean you can’t still make a big difference to a home’s appearance. Interior designers from across the country respond to the question: What is your favorite summer design hack on a dime?
Here’s what they said:
1. Refresh the Color
“What works for summer—and all year round, really—is making a statement with color. A fresh coat of paint on the wall or repainting your furniture and adding new hardware offers a renewed look to any room. Don’t be afraid to try cool, summery colors; they create a tranquil mood to the space.”
See full list here:
https://www.nar.realtor/blogs/styled-staged-sold/5-favorite-home-design-hacks-on-a-budget
I think I must have had the 2x zoom on by accident when filming here. But if you like close-ups…..
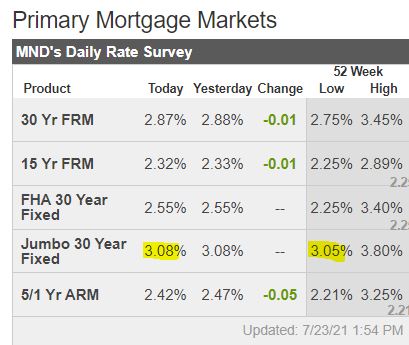
Regardless where the inventory goes (likely to retreat), the potential home buyers should stay interested, just because of rates staying low. Many of them may be looking forward to when the foreclosures start pouring in.
What’s the latest on the delinquencies/forbearances? From Black Knight:
Total U.S. loan delinquency rate (loans 30 or more days past due, but not in foreclosure): 4.37%
– Month-over-month change: -7.62%
– Year-over-year change: -42.39%
Total U.S. foreclosure pre-sale inventory rate: 0.27%
– Month-over-month change: -1.73%
– Year-over-year change: -24.23%
Total U.S. foreclosure starts: 4,400
– Month-over-month change: 15.79%
– Year-over-year change: -25.42%
Top 5 states by 90-plus days delinquent percentage:
Mississippi: 4.89%
Louisiana: 4.59%
Hawaii: 4.14%
Nevada: 4.14%
Maryland: 4.08%
The takeaway:
The national delinquency rate is at its lowest level since the pandemic hit, even below the pre-Great Recession average.
While there’s been improvement, however, there are still 1.5 million homeowners 90 or more days past due on their mortgages but who are not in foreclosure—nearly four times pre-pandemic levels.
There are 1.5 million homeowners who are 90+ days late but who are not in foreclosure? Do you need any more evidence that lenders aren’t interested in foreclosing? They will give loan mods when they get around to it.
It’s a great time to be a deadbeat!


