Guesses of the percentage change in the 2023 national home pricing from today’s free WSJ article:
NAR: +1.2%
NAHB: +0.7%
Fannie Mae: -1.5%
Goldman Sachs: -7.5%
Ivy Zelman: -12% (peak-to-trough in late 2024)
John Burns: -20% (peak-to-trough in late 2024)
KPMG: -20%
The article doesn’t cover any new ground because nobody wants to commit to how this plays out.
But I’ll give you my opinion.
Prices will keep declining until realtors tell their sellers that they need to sell in the first week or two on the market, or get lowballed. To do so, they need to make their home look spectacular, price it attractively, and make it easy to show. To really improve your chances, offer a competitive commission rate to buyer-agents. Then the realtor needs to employ terrific salesmanship, and find a qualified buyer quickly.
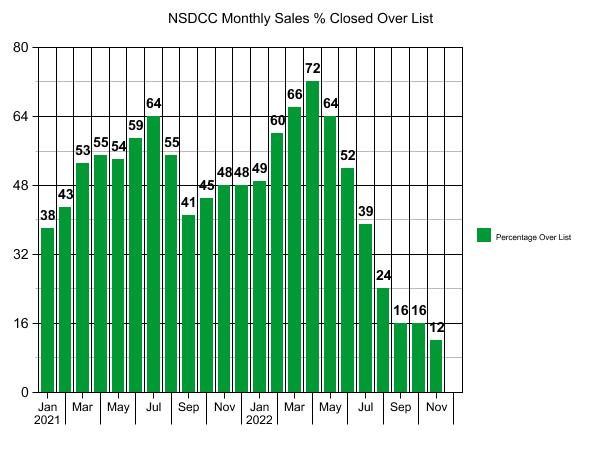
Only 12% of the houses sold last month actually closed over their list price, which sounds normal.
There were 51 of the 115 of the sales (44%) that closed for $100,000+ BELOW their last list price.
The count of 51 broke down to 17 of 19 sales over $3,000,000, and 34 of 96 sales under $3,000,000 – where knocking off $100,000+ off the list price is fairly significant. Either realtors aren’t that great about their pricing, or they wander into lowball territory and get their head tore off.
The median days-on-market was 28 days, and the average was 41 days.
About half wandered into lowball territory, and about half sold for $100,000+ below their list price – there is a direct connection. People need to figure out how to sell the house in the first couple of weeks of being on the market, or face the same consequences in 2023.
~~~~~~~~~~~~~~~~~~~~~~~~~~~~~~~~~~~~~~~~~~~~~~~
NSDCC Average and Median Prices by Month
Month
# of Sales
Avg. LP
Avg. SP
Median LP
Median SP
Feb
224
$2,298,797
$2,257,334
$1,719,500
$1,758,000
March
252
$2,295,629
$2,260,524
$1,800,000
$1,825,000
April
357
$2,396,667
$2,403,962
$1,799,900
$1,828,000
May
300
$2,596,992
$2,581,715
$1,900,000
$1,994,500
June
348
$2,509,175
$2,537,953
$1,900,000
$1,967,500
July
311
$2,421,326
$2,442,738
$1,795,000
$1,855,000
Aug
268
$2,415,075
$2,438,934
$1,897,000
$1,950,000
Sept
278
$2,479,440
$2,445,817
$1,899,000
$1,987,500
Oct
248
$2,754,470
$2,705,071
$1,899,000
$1,899,500
Nov
199
$2,713,693
$2,707,359
$1,999,000
$2,100,000
Dec
189
$2,686,126
$2,664,391
$1,985,000
$2,157,500
Jan
140
$2,828,988
$2,855,213
$2,234,944
$2,240,000
Feb
158
$3,063,331
$3,108,907
$2,149,500
$2,386,500
Mar
207
$3,247,251
$3,337,348
$2,400,000
$2,625,000
Apr
227
$3,190,161
$3,251,604
$2,350,000
$2,550,000
May
215
$2,943,657
$3,032,977
$2,350,000
$2,500,000
Jun
190
$2,864,089
$2,872,690
$2,297,500
$2,350,000
Jul
155
$2,889,612
$2,832,080
$2,299,900
$2,300,000
Aug
164
$2,933,243
$2,830,855
$2,200,000
$2,150,000
Sep
135
$2,650,642
$2,560,314
$2,149,000
$2,040,000
Oct
124
$3,090,320
$2,971,211
$2,272,500
$2,212,500
Nov
115
$2,581,790
$2,459,974
$1,950,000
$1,875,000
In October, when the average and median sales price spiked, it didn’t mean your home’s value went up – the homes sold that month had a median square footage that was 12% higher than in September. Similarly, the group of homes that sold in November had a median sf that was 8% smaller than in October.
But if you do want to make a big deal of these sales prices, they are similar to those in July, 2021.
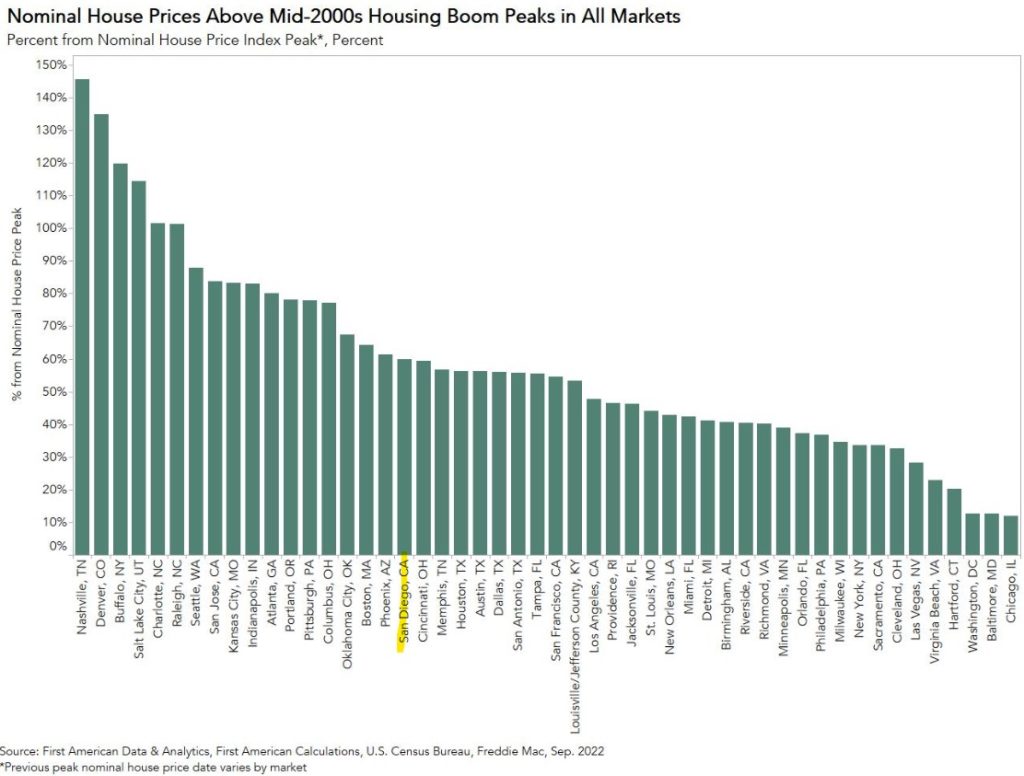
San Jose is ahead of us, and San Francisco is about the same. As long as the Bay Area remains an obvious feeder into the better-valued San Diego-Carlsbad market, we’ll be fine.
This is the first time that social media has had the chance to influence the real estate market, and as you can guess, it ain’t pretty. There are no guardrails or qualifying of the author’s opinion, and as a result, people get away with saying whatever they want.
Logically, the conscious mind will remember that real estate is local, and that you can’t believe what you read from strangers on the internet. However, if you listen to friends and family, and they have been influenced by social media, it can still play a role in your decision-making process.
It’s why we will likely get off to a slow start in 2023 – people won’t believe it, until they see it. Plus, if they don’t see it by the end of March or April, then they might even give up prematurely (buyers and sellers).
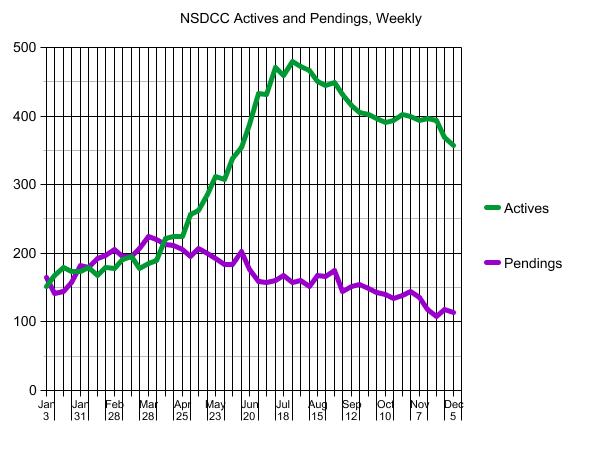
But we need to adjust our expectations of the inventory – it’s going to be lower than ever.
Two likely scenarios:
The inventory of superior homes will be extremely tight. Homeowners are very reluctant to give up a trophy property, and if they do, they sure want top dollar. There weren’t that many sold during the frenzy, and now that they’ve ‘heard’ that the market is bad, there could be even fewer quality choices for buyers.
The inventory of inferior homes will get picked over, with most buyers in shock over how little the pricing has adjusted for the scratch-and-dent homes. Those listings will languish on the market as the sellers patiently hope that the ‘right’ buyer is coming tomorrow, or some day soon. But once a listing has gone unsold for more than a month, we know what happens – it triggers the lowball offers.
The last two Januarys we have had contests on how many houses between La Jolla and Carlsbad will be listed for sale. In both cases, the actual counts were much lower than most of the guesses. We will do another contest next month, and it should give us a clue on what to expect for the selling season!
But we haven’t had the definitive dump on pricing that would have made it easier on the buyers, so the interpretations of the market’s direction next year will be scattered. Many will think there is more downdraft to go, and wait it out. Some buyers will think prices got more attractive, and if they can just lowball a seller out of another 10% it would be about right. Some will be able to land a top-quality home for a price they can live with – and together, these three groups will make the market in 2023.
A few more articles like this should cause buyers to question whether pricing will get any better:
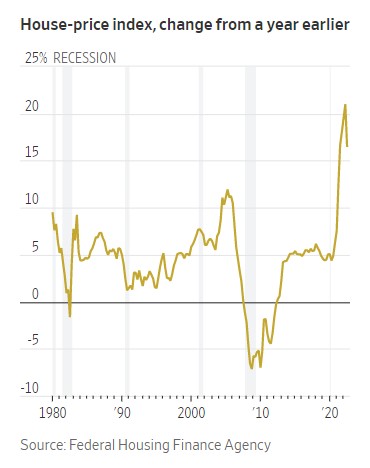
Today, the Data & Analytics division of Black Knight released its latest Mortgage Monitor Report, based upon the company’s industry-leading mortgage, real estate and public records datasets. Despite home price corrections continuing in many markets nationwide driven by tight affordability and higher rates, the pace of price declines has slowed measurably over the past two months. As Black Knight Data & Analytics President Ben Graboske explains, what would ordinarily be an environment ripe for steep declines in home prices has been offset somewhat by stagnant levels of for-sale inventory.
“We’ve now seen four consecutive months of home price pullbacks at the national level,” said Graboske. “But after a couple of significant drops earlier in the summer, the pace of cooling has slowed considerably, with October’s non-seasonally adjusted drop of just 0.43% the smallest decline yet. Though seemingly counterintuitive, the much higher rate environment may be limiting the pace of price corrections due to its dampening effect on inventory inflow and subsequent gridlock in home sale activity. While the median home price is now 3.2% off its June peak – down 1.5% on a seasonally adjusted basis – in a world of interest rates 6.5% and higher, affordability remains perilously close to a 35-year low. Add in the effects of typical seasonality and one might expect a far steeper correction in prices than we have endured so far, but the never-ending inventory shortage has served to counterbalance these other factors. Indeed, the volume of new for-sale listings in October was 19% below the 2017-2019 pre-pandemic average. This marks the largest deficit in six years outside of March and April 2020 when much of the country was in lockdown – with the overall market still more than half a million listings short of what we’d consider ‘normal’ by historical measures.
I hope it’s obvious that it matters who you hire as your realtor – we’re not all the same. It didn’t matter much during the frenzy, because even an agent who kicked the crap out of the sale could still find their way to close over the list price.
But not now.
In today’s market, sellers risk getting lowballed, or not selling at all.
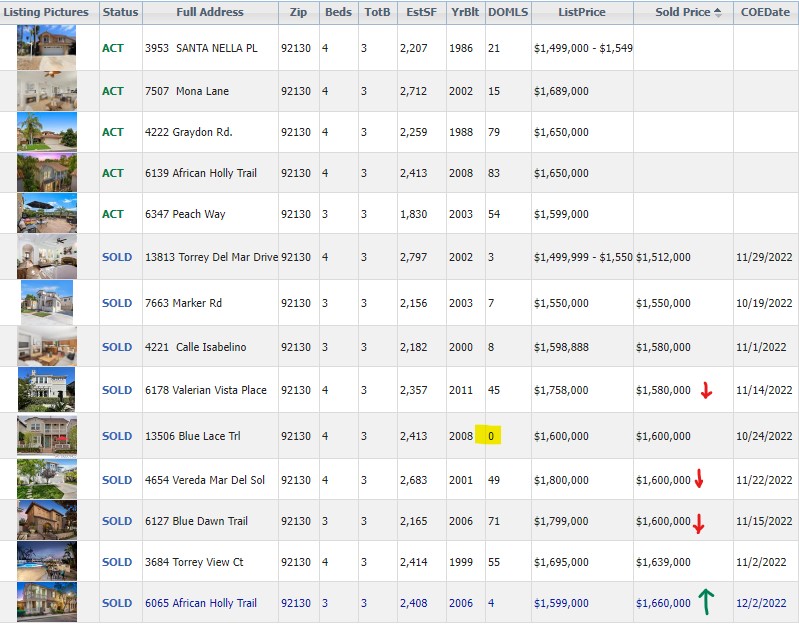
After one lowball off-market sale and three unbelievable 10% dumps on price, the entry-level market in Carmel Valley looked like it was in freefall. The sellers and I had already decided to list for $1,675,000 – and I advertised it here – but the next day, two of the dumpers closed escrow. The other listing on the street had been unsold since they had listed for $2,150,000 on June 24th, and they had just lowered their price another $100,000 to $1,650,000 on the same Thursday.
I rallied with my clients and they agreed to my strategy of pricing attractively, so we changed our list price and entered the market at $1,599,000 with the intent to sell the first weekend.
But our list price wasn’t way under market – no, it was full retail, based on those most recent sales.
What made the sale was the combined package of a turnkey property with an attractive price that was well-presented and pushed hard by the agent (me). Once I received three offers, I pitted them against each other and bid it up to $61,000 over my list price on the weekend before Thanksgiving!
The buyer who purchased my listing also bought the house on Valerian Vista (which was five years newer and the lot was 42% larger) in the similar and neighboring tract called Manzanita Trails. Yet the same guy was willing to pay $80,000 more for my listing and close in two weeks.
He had just lowballed a better house by $178,000 and it worked.
Yet, he was willing to buy my listing for $80,000 more than he had just paid the same week?
It’s a great example of how critical it is to hire an agent who has an effective strategy to sell your house.
Yesterday, I offered my take on pricing for the San Diego 2023 real estate market.
For those who don’t watch videos, I said the overall median sales price will be down 3% next year, with the superior-home sales causing a +5% median sales price among themselves. Where the line is drawn between superior and inferior homes will be interesting!
In this episode of the Top of Mind podcast, Mike Simonsen sits down with Rick Palacios Jr., Director of Research and a Managing Principal at John Burns Real Estate Consulting, to talk about what to expect in the real estate market in 2023.
Rick discusses the company’s latest research on homebuilder sentiment, shares their latest forecast for home prices and the economy, and talks about some secret signals to watch for changes in the market.
About Rick Palacios Jr.
Rick Palacios Jr. is the Director of Research and a Managing Principal at John Burns Real Estate Consulting, where he oversees all research pertaining to the US economy, for-sale housing, and rental markets.
Rick has 15 years of experience in residential real estate and economic research, originally joining John Burns Real Estate Consulting in 2006 and then rejoining the company in 2014 after working as a home builder Equity Research Associate at Morgan Stanley in New York. He has also worked as an Analyst at the Milken Institute, an economic think tank.
Rick holds a BA from the University of California, Irvine, and an MS in real estate economics and finance from the London School of Economics.
Here’s a glimpse of what you’ll learn:
Why new home construction might accelerate the housing market slump
How much home prices are likely to decline in the next two years
The leading indicators (and secret signals!) to watch for changes in the market
Trustindex verifies that the original source of the review is Google.
A+ thank you
Lisa Tuomi
June 11, 2025
Trustindex verifies that the original source of the review is Google.
Many years ago, we purchased a home in Carlsbad, using a realtor that was recommended to us - Jim Klinge. Fast forward to 2025, we recently had the privilege of selling 2 homes in Carlsbad, CA and didn't hesitate to reach out to Jim and Donna Klinge of Klinge Realty Group to guide us through the sales. The transactions were very different, each with its own unique situation, opportunities and challenges. From start to finish, Donna and Jim helped navigate the pre-sale preparation, the listing, showing of the house, buyer negotiations, the final close and all of the paperwork and decisions in between. What stands out with both transactions is the professionalism of Jim and Donna (and their team), wonderful communication (timely, relevant, concise), their deep understanding of market dynamics (setting realistic expectations), their access to top-notch contractors, and last, their ability to guide us across the finish line successfully. We wouldn't hesitate to use Jim and Donna in the future and highly recommend them for anyone looking to buy or sell a property in North San Diego County.
Jerry Meyer
March 28, 2025
Trustindex verifies that the original source of the review is Google.
We sold a home with Jim and Donna and from beginning to end they were consummate professionals. Their initial walk through the property resulted in a list of items to be repaired or updated. They supplied a list of vendors and job quotes to do the repairs and updates. We originally wanted to sell ‘as is’ and just get it over with. They gave us a selling price for ‘as is’ and options for doing a few updates/repairs to doing it all with the selling price for each option. We agreed to do all they suggested and we sold for the exact price they predicted. For every dollar spent we got back more than $2 back in the selling price. And they got that price in a rising interest rate environment! Donna and Jim are extremely detailed and guide you through ever aspect of the sale. There were no surprises thanks to their guidance. We couldn’t be more pleased with their representation.
Thank you Donna and Jim,
Jerry and Mary
Heather Quejada
March 27, 2025
Trustindex verifies that the original source of the review is Google.
We have known Jim & Donna Klinge for over a dozen years, having met them in Carlsbad where our children went to the same school. As long time North County residents, it was a no- brainer for us to have the Klinges be our eyes and ears for San Diego real estate in general and North County in particular. As my military career caused our family to move all over the country and overseas to Asia, Europe and the Pacific, we trusted Jim and Donna to help keep our house in Carlsbad rented with reliable and respectful tenants for over 10 years.
Naturally, when the time came to sell our beloved Carlsbad home to pursue a rural lifestyle in retirement out of California, we could think of no better team to represent us than Jim and Donna. They immediately went to work to update our house built in 2004 to current-day standards and trends — in 2 short months they transformed it into a literal modern-day masterpiece. We trusted their judgement implicitly and followed 100% of their recommended changes. When our house finally came on the market, there was a blizzard of serious interest, we had multiple offers by the third day and it sold in just 5 days after a frenzied bidding war for 20% above our asking price! The investment we made in upgrades recommended by Jim and Donna yielded a 4-fold return, in the process setting a new high water mark for a house sold in our community.
In our view, there are no better real estate professionals in all of San Diego than Jim and Donna Klinge. Buying or selling, you must run and beg Jim and Donna Klinge to represent you! Our family will never forget Jim, Donna, and their whole team at Compass — we are forever grateful to them.
Lou F
March 27, 2025
Trustindex verifies that the original source of the review is Google.
WeI had the pleasure of working with Klinge Realty Group to sell our home in Carmel Valley, and I cannot recommend them highly enough!
Jim and Donna demonstrated exceptional professionalism, offering expert guidance on market conditions and pricing strategy, which resulted in a quick and successful sale.
Communication was prompt and we were well-informed throughout the entire process.
For anyone looking for a dedicated and knowledgeable real estate team, look no further!
---
William Sams
March 25, 2025
Trustindex verifies that the original source of the review is Google.
Donna and Jim Klinge of Klinge Realty Group have our highest possible recommendation. From Donna and Jim’s first visit to our house through closing their advice and counsel was candid and honest in all dealings. They kept us fully informed throughout the process. The house sold less than three days after listing with a two-week closing. My wife and I have sold several houses during our lives. This was by far the best experience. Klinge Reality is a premium service realtor. You can’t make a better choice for someone to sell your home fast and for top dollar.
Emily Hernandez
December 29, 2024
Trustindex verifies that the original source of the review is Google.
Donna and Jim provided exceptional support and professionalism throughout the entire process. We couldn't have been happier with their efforts. They made our house shine, and thanks to their expertise, it sold above the listing price in the very first weekend! Truly a fantastic experience from start to finish.
Jesus Adrian Sahagun
November 11, 2024
Trustindex verifies that the original source of the review is Google.
This year has been difficult on our family, mainly due to having to sell our home. Thankfully we knew God had a plan for us and working with the Klinge team was a key part of it. It was an obvious decision to work with them again after such an amazing experience when purchasing the same home we needed to sell. The challenge was, how will we do this in so little time with so much going on? Jim and Donna held our hand every step of the way. Whenever an unexpected issue arose they found and provided a solution. Never once did we feel pressured to make a decision and the Klinges were always reassuring after providing the information that the decision was ours to make. Despite the curve balls, they never panicked and exemplified the “can do” attitude, making us feel optimistic and taken care of. Their expertise and professionalism was superb. But of all the reasons to work with the Klinges, the most impactful and valuable is their compassion and genuine care for their clients. We pray that we can one day purchase our forever home and you better believe that Jim and Donna will be representing us - as long as they will have us of course. Thank you again Klinge team! Your execution, experience, and care are unmatched.
SABIHA PASHA
July 23, 2024
Trustindex verifies that the original source of the review is Google.
Jim and Donna were fantastic! Jim understanding my needs, recommending potential places, pointing out the pros and cons of each property was invaluable. Then when the offer was accepted Donna’s organized guidance through the inspections, paperwork etc made the whole process seem effortless.
So grateful that I had them on my side!
Anu Koberg
July 13, 2024
Trustindex verifies that the original source of the review is Google.
We first found Jim through his blog at bubbleinfo.com, which really showcased his knowledge of SoCal real estate. Since then we've done three transactions with Jim and Donna, and they are an incredible full service agency, with Jim's deep market insight and Donna's deft contract and project management. We trust them implicitly in their analysis and strategy, which is based on years of experience. They're always available and on top of things, and we strongly recommend them to anyone.