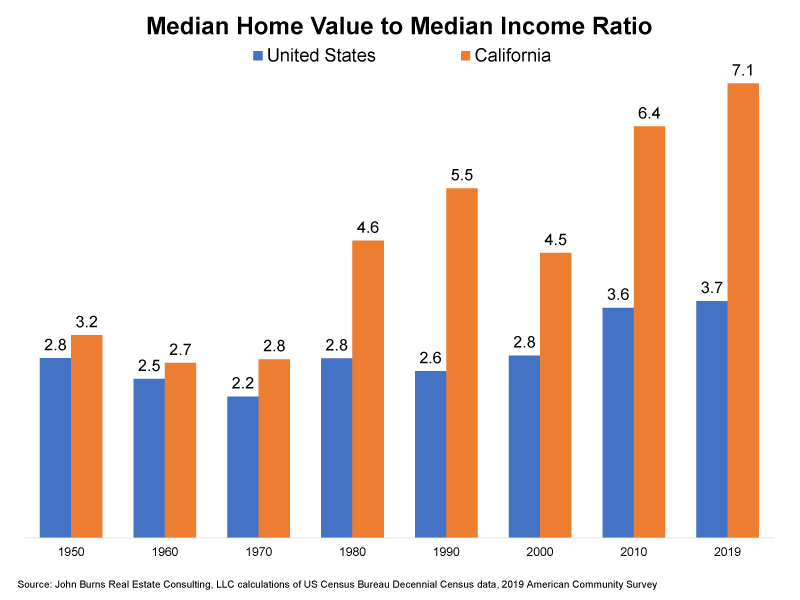
If there is anyone left who still believes in market fundamentals, here’s a graph that shows how the traditional 3:1 price-to-income ratio is still a decent measuring stick in the rest of America. But in California, it has escalated to dizzying heights!
San Diego County
Median Household Income: $75,456
Median Sales Price, YTD: $705,000
Price-to-Income Ratio: 9.3
Encinitas
Median Household Income: $113,175
Median Sales Price, YTD: $1,465,000
Price-to-Income Ratio: 12.9
~~~~~~~~~~~~~~~~~~~~~~~~~~~~~~~~~~~~~~~~~
With the affluent in full control of the real estate market, expect these numbers to get dizzier!


Some of this is the bifurcation along economic lines. Instead of the assumed bell curve of income and ownership we are seeing what is often called double Guassian distribution.
https://i.stack.imgur.com/HdKiy.png
You may note that the double Guassian doesn’t have the long tail to higher income that supports ever increasing prices. There’s a steeper wall there.
Well that explains it, thanks! 🙂
@Rob_Dawg
I took up a career in biology specifically to avoid the hard maths.
I suspect that interest rates dropping consistently over the past 40 years have allowed the increased ratio.
How much of the CA increase is due to prop13?
I do agree with the Dawg, though, that bifurcation of income distribution also has played a role in desirable places. Should be able to detect the signal for this by looking at less desirable places, like antelope valley, etc. versus the coast.