

Who is selling? The chart below tracks when the home was purchased by the sellers. Today’s numbers are from those sales closed between Aug 21-31 of this year:
| Year Purchased | ||||||
| 0 – 2003 | ||||||
| 2004 – 2008 | ||||||
| 2009 – 2011 | ||||||
| 2012 – 2020 | ||||||
| New Home |
So much for my theory about boomers leaving town! Today’s percentage of long-time owners sellers was the lowest yet…..but we know that over 50% of boomers delayed selling their home due to covid.
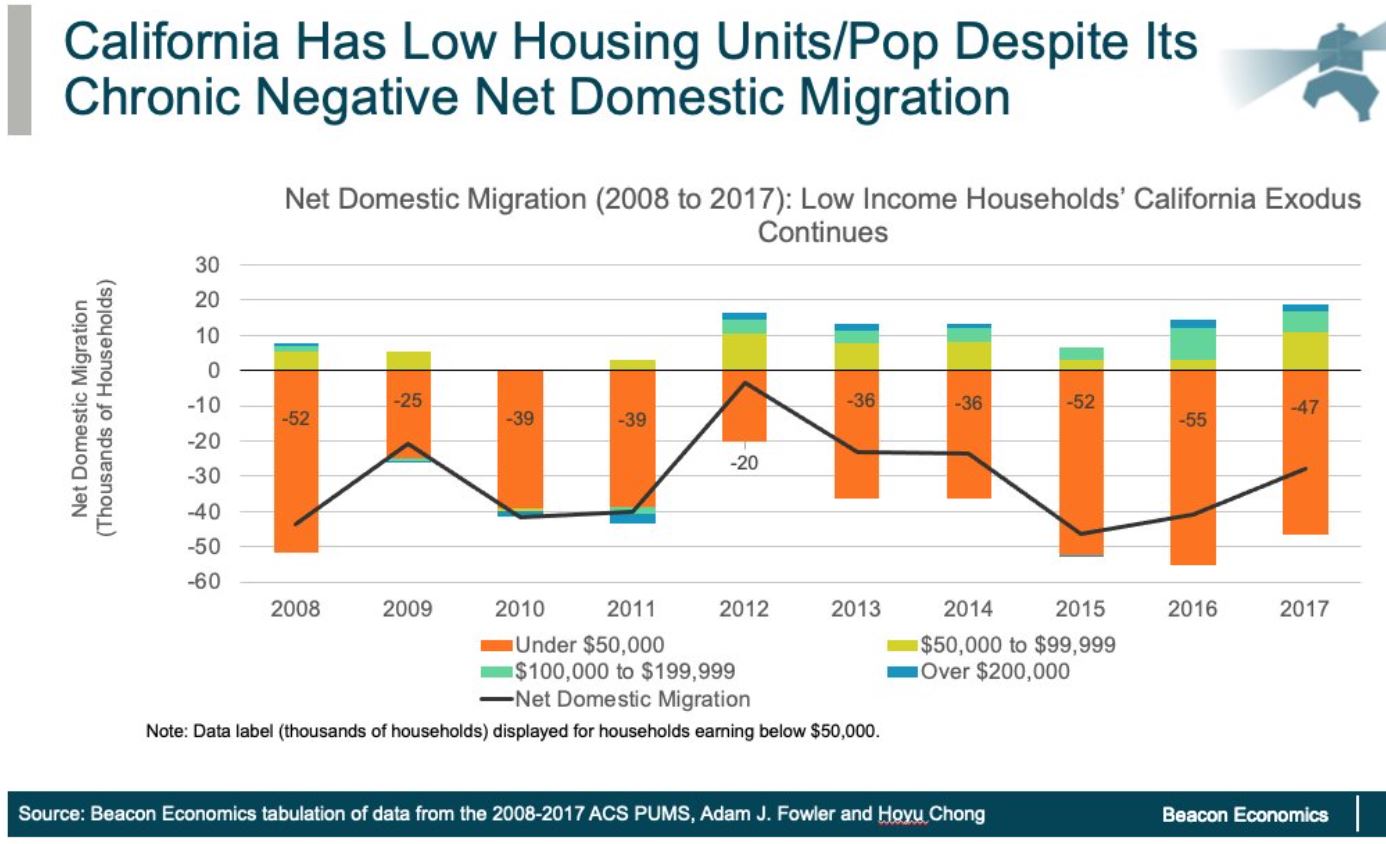
The chart at the top (click to enlarge) shows the California migration, and it’s a money thing.
People who leave the state find it too expensive here, and can do better elsewhere – and are willing to go for it! Younger people are probably more inclined to leave, at least at first. Grandparents to follow!
Of course, even the recent purchasers have no problem selling for a decent-to-huge gain, and more of them have been taking their profits – and hopefully buying another home, either here or elsewhere. Though the 2012-2020 group is the only one that grows just because we’re adding years over time.
More stats:
| # of Sales | ||||||
| Avg. $$/sf | ||||||
| Median SP | ||||||
| Avg DOM | ||||||
| 0-10 DOM | ||||||
| Lost $$ | ||||||
| DOM = 0 |
There were four flippers in today’s group, same as last time.


I wonder if SALT, WFH, fires, homeless, and riots change the net migration of the high income groups.
No – they just get a taller gate.
The high income groups learn ways around the tax code. Here’s an example:
https://twitter.com/nxthompson/status/1310591077003464714
Whenever we get a 5+ year run up in prices we always seem to lose young families. The six figure profits of a few hundred K are just too appealing to a young family. They can go back to Mid America or elsewhere and buy their dream home in cash with the gains they lucked into here. I remember exactly this happening Back in My Day almost 20 years ago. One day all the kids friends were gone back to Michigan, Wisconsin, Ohio. Was kind for sad for them