

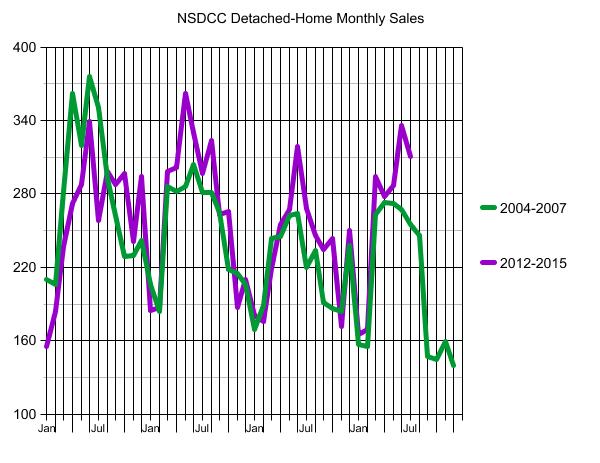
Every day we hear some pundit talking about the latest real estate bubble forming. Can we learn anything from comparing recent sales to those during the bubblicious 2004-2007 era?
Sales were dropping precipitously in 2005 and 2006 after the 2003-2004 run-up. There was one last blowout at the end of 2006 and into 2007 when Countrywide began pushing the no-doc, 100% financing up to $1,500,000.
When Angelo took away the punch bowl in the middle of 2007, the party was over – you can see how sales tanked, beginning in August, 2007.
One big difference when comparing these two eras is that the neg-am teaser rate in 2007 is today’s 30-year fixed rate. When the teaser rate went away, and people had to qualify again, the market collapsed.
It doesn’t look that way today.
This year, sales have been strong, in spite of the San Diego Case-Shiller Index rising 42% since January, 2012. If we hit an unsustainable stretch, the first indicator will be sales dropping off, like they did at the end of 2007.


Jim. If you population adjust that graph then it gets even more ominous.
That said I don’t think lower sales volume will be as important this time. Lack of desperation for want of a better phrase.
Agreed – a dropping sales count will only indicate that buyers have had enough, and checked out. Or we ran out of buyers.
A stale, stagnant market is upon us, and unlikely to change – unless buyers are willing to keep paying more than the last guy.
P.S. Did you see this? You’re #1:
http://www.washingtonpost.com/news/wonkblog/wp/2015/08/17/every-county-in-america-ranked-by-natural-beauty/
@JtR…
There should have been a disclaimer associated with that article. The disclaimer should indicate that Oxnard and Port Hueneme were excluded from consideration.