

Yesterday, Bill featured the C.A.R. release about September sales that included the president’s comment that buyers are ‘self-sidelining’ in anticipation of lower prices ahead. White included his obligatory blame on the tax reform, which he was so adamantly against even though his case was based on faulty evidence – and it passed anyway.
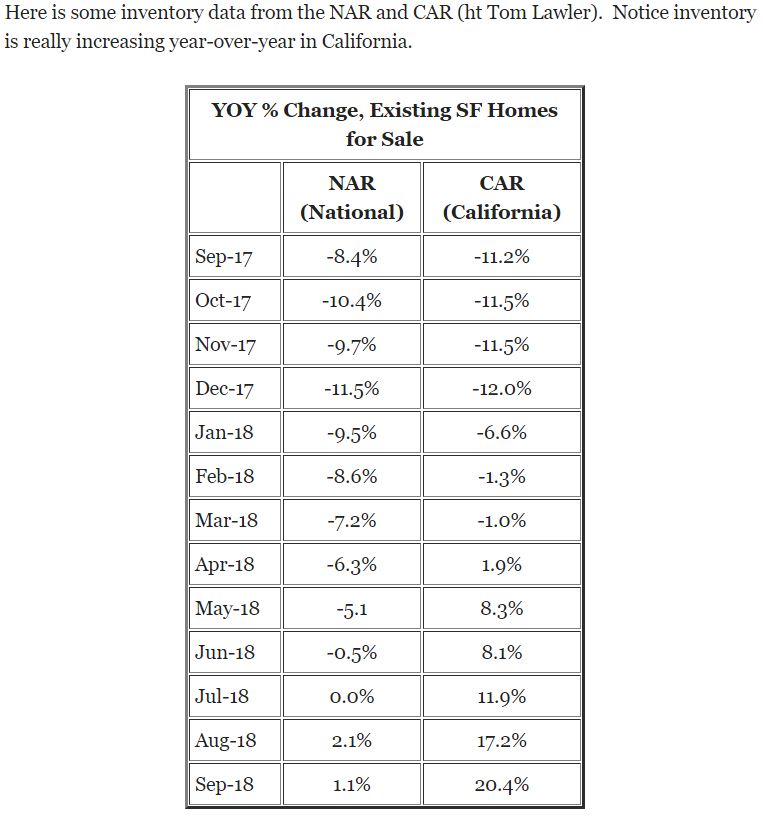
Bill also included the chart above that showed inventory explosion in CA:
https://www.calculatedriskblog.com/2018/10/california-california-housing-market.html
Let’s review our NSDCC stats to see how we are behaving:
| Year | ||||
| 2013 | ||||
| 2014 | ||||
| 2015 | ||||
| 2016 | ||||
| 2017 | ||||
| 2018 |
Our current NSDCC inventory is 25% higher than last year, but it just highlights what a great year we had in 2017 – when the TL/TS ratio was similar to the full-tilt frenzy we had in 2013.
This year looks a lot like the more-normal years of 2014-2016, when the sledding was much tougher. As long as our current stats are staying in-line with previous years, we should be fine.
Expect more of the same – buying and selling homes is going to be difficult.
Get Good Help!


I don’t have the mid-Oct inventory count for 2013 – I started keeping those in 2014.
> In markets such as Los Angeles, for example, reports say that up to 30 percent of sales are being withheld from the MLS for the sake of more private channels,
Private. Nice way to sugar coat.
You can feel it, can’t you? It’s all coming apart, right before our eyes.